MLB Grind Down: Wednesday, June 8th
The RotoGrinders MLB Grind Down will give you an in-depth analysis into the upcoming MLB schedule. This article will break down the numbers for every single game and give you analysis on which trends you can exploit. While matchups are a major factor in daily fantasy baseball, there are plenty of other factors to consider such as injuries, weather, and salaries.
The analysis should point you in the right direction, but it is still up to you to decipher the information and make your own selections. No sport has more variance than baseball. The best choice is not always the right choice but following the trends will win you money over time.
Note: As always, if you want to try a new DFS site, be sure to click through a RotoGrinders link and use our DraftKings promo code and FanDuel promo code to receive the best perks in the industry.
Chicago Cubs at Philadelphia – 1:05 PM ET
| Chicago Cubs | Philadelphia |
 | |  | |
| RIGHT | RIGHT |
| Vegas Moneyline | Vegas Over/Under |
| CHC -180 | 7.5 |
| Stats | wOBA | HR All. | K% | BB% | Stats | wOBA | HR All. | K% | BB% |
| SP vs. Left | 0.316 | 13 | 15.9% | 8.7% | SP vs. Left | 0.298 | 7 | 24.9% | 10.1% |
| SP vs. Right | 0.267 | 15 | 25.5% | 4.0% | SP vs. Right | 0.326 | 6 | 29.1% | 7.4% |
Pitcher Grind Down
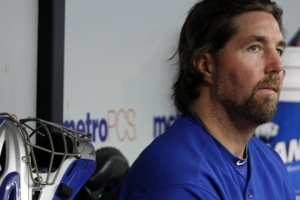
| John Lackey |
 | FanDuel | DraftKings |
| Salary: | $10,000 | Salary: | $12,900 |
| FPPG: | 41.2 | FPPG: | 22.8 |
| Pitcher Rating: | 83.8 | Pitcher Rank: | 5 |
| Statistics | Starts | PitchPS | SIERA | ERA | K% | BB% | SS% | GB% | FB% | HH% |
| L14 Days | 3 | 94.7 | 3.27 | 1.74 | 30.0% | 8.8% | 14.1% | 45.7% | 34.8% | 36.2% |
| 2016 | 11 | 97.0 | 3.42 | 2.88 | 26.5% | 6.6% | 12.9% | 42.2% | 36.8% | 34.9% |
| 2015 | 33 | 94.8 | 3.90 | 2.77 | 19.5% | 5.9% | 9.4% | 46.0% | 33.3% | 30.1% |
With four early games on the schedule, there are three different slates across the industry – early only, all day, and the main slate. As we always do with the Grind Down, we will cover any and every game on the schedule. Lackey will be making his 12th start of the season today against the Phillies. He has really pitched well so far, posting a 3.42 SIERA with a strikeout rate of 26.5%. I’m a little hesitant to say that he can keep those numbers up though, because pitchers typically don’t trend upward when they get into their late 30’s. None of that matters today though, as he is a top five pitching options against the Phillies. On the season, they are ranked 28th in team wOBA and 18th in team K% against right-handed pitching.
| Vince Velasquez |
 | FanDuel | DraftKings |
| Salary: | $8,500 | Salary: | $8,100 |
| FPPG: | 35.3 | FPPG: | 19.2 |
| Pitcher Rating: | 71.8 | Pitcher Rank: | 11 |
| Statistics | Starts | PitchPS | SIERA | ERA | K% | BB% | SS% | GB% | FB% | HH% |
| L14 Days | 3 | 90.3 | 4.70 | 8.31 | 21.5% | 10.8% | 10.3% | 25.0% | 45.5% | 31.8% |
| 2016 | 11 | 93.2 | 3.49 | 3.67 | 28.5% | 8.6% | 11.2% | 34.8% | 43.7% | 26.9% |
| 2015 | 7 | 139.4 | 3.74 | 4.37 | 25.1% | 9.1% | 10.5% | 31.3% | 46.7% | 27.3% |
Velasquez hasn’t been great in his last couple of starts, but he still owns an impressive 3.49 SIERA with a strikeout rate of 28.5% on the season. His numbers are a bit inflated by that one 16-strikeout performance against the Padres, but he should still be thought of as an elite strikeout pitcher. The biggest issue facing him today is his matchup. The Cubs are ranked third in runs scored per game and eighth in team wOBA against right-handed pitching this season. There are better plays for both cash games and tournaments today.
Batter Grind Down
Chicago Cubs
The Cubs have a mediocre team total of 4.21 runs, but it is actually the third highest projection of the eight teams playing in the early slate. They draw a boom or bust matchup against , who has looked very good and very bad at different points throughout the season. The left-handed batters are also in play, but Velasquez has allowed a significantly higher wOBA to right-handed hitters in his career.
- Cubs Offense (2016)
Team wOBA vs. RHP — 0.330 (8 of 30)
Team ISO vs. RHP — 0.163 (13 of 30)
Team K% vs. RHP — 21.8% (19 of 30)
Runs Per Game — 5.35 (3 of 30)
Projected Run Total — 4.21 (17 of 30)
Projected Lineup
| # | Player | Bats | wOBA vs. RHP | ISO vs. RHP | wOBA L14 | FD Position | FD Salary | DK Position | DK Salary |
| 1 | | SWITCH | 0.344 | 0.180 | 0.359 | OF | $4,100 | OF | $4,500 |
| 2 | | LEFT | 0.336 | 0.145 | 0.313 | OF | $3,200 | OF | $4,000 |
| 3 | | RIGHT | 0.380 | 0.216 | 0.424 | 3B | $4,000 | 3B/OF | $4,800 |
| 4 | | LEFT | 0.391 | 0.265 | 0.447 | 1B | $4,300 | 1B | $4,900 |
| 5 | | SWITCH | 0.351 | 0.168 | 0.323 | 2B | $3,200 | 2B | $4,300 |
| 6 | | | | | 0.000 | | | | |
| 7 | | LEFT | 0.323 | 0.153 | 0.226 | C | $2,400 | C | $3,000 |
| 8 | | RIGHT | 0.250 | 0.106 | 0.348 | SS | $2,700 | 2B/3B | $3,000 |
| 9 | | RIGHT | 0.129 | 0.028 | 0.000 | P | $10,000 | P | $12,900 |
| | Team Averages | — | 0.313 | 0.158 | 0.271 | — | — | — | — |
Elite Plays – (FD), ,
Secondary Plays – , ,
Stackability – Cash & GPP
Philadelphia
The Phillies draw one of the worst matchups on the board. They can’t seem to do much of anything offensively these days, which is why they have the second lowest implied run total on the board. has been tough on both left and right-handed hitters, holding both under a .316 wOBA over the last two seasons.
- Phillies Offense (2016)
Team wOBA vs. RHP — 0.291 (28 of 30)
Team ISO vs. RHP — 0.146 (20 of 30)
Team K% vs. RHP — 21.4% (18 of 30)
Runs Per Game — 3.24 (29 of 30)
Projected Run Total — 3.29 (27 of 30)
Projected Lineup
| # | Player | Bats | wOBA vs. RHP | ISO vs. RHP | wOBA L14 | FD Position | FD Salary | DK Position | DK Salary |
| 1 | | LEFT | 0.358 | 0.134 | 0.329 | OF | $3,400 | OF | $3,200 |
| 2 | | RIGHT | 0.292 | 0.085 | 0.318 | 2B | $2,800 | 2B | $2,500 |
| 3 | | SWITCH | 0.289 | 0.120 | 0.260 | SS | $2,600 | SS | $2,700 |
| 4 | | RIGHT | 0.340 | 0.193 | 0.288 | 3B | $3,100 | 3B | $2,900 |
| 5 | | LEFT | 0.314 | 0.227 | 0.194 | 1B | $2,400 | 1B | $2,500 |
| 6 | | RIGHT | 0.291 | 0.141 | 0.359 | C | $2,600 | C | $2,300 |
| 7 | | LEFT | 0.303 | 0.164 | 0.217 | OF | $2,200 | 3B/OF | $2,500 |
| 8 | | RIGHT | 0.318 | 0.187 | 0.299 | OF | $2,000 | OF | $2,800 |
| 9 | | RIGHT | 0.238 | 0.000 | 0.220 | P | $8,500 | P | $8,100 |
| | Team Averages | — | 0.305 | 0.139 | 0.276 | — | — | — | — |
Elite Plays – NONE
Secondary Plays – (DK)
Stackability – NONE
Toronto at Detroit – 1:08 PM ET
| Toronto | Detroit |
 | |  | |
| RIGHT | RIGHT |
| Vegas Moneyline | Vegas Over/Under |
| DET -125 | 9.0 |
| Stats | wOBA | HR All. | K% | BB% | Stats | wOBA | HR All. | K% | BB% |
| SP vs. Left | 0.305 | 17 | 13.2% | 8.8% | SP vs. Left | 0.316 | 16 | 18.8% | 6.3% |
| SP vs. Right | 0.314 | 17 | 16.5% | 6.3% | SP vs. Right | 0.278 | 14 | 18.8% | 3.1% |
Pitcher Grind Down
| R.A. Dickey |
 | FanDuel | DraftKings |
| Salary: | $7,000 | Salary: | $6,900 |
| FPPG: | 23.7 | FPPG: | 11.8 |
| Pitcher Rating: | 34.1 | Pitcher Rank: | 26 |
| Statistics | Starts | PitchPS | SIERA | ERA | K% | BB% | SS% | GB% | FB% | HH% |
| L14 Days | 3 | 100.0 | 5.38 | 3.38 | 15.4% | 14.1% | 6.7% | 54.7% | 24.5% | 32.1% |
| 2016 | 12 | 98.3 | 4.69 | 4.21 | 16.9% | 9.1% | 9.4% | 47.3% | 31.7% | 29.3% |
| 2015 | 33 | 98.9 | 4.76 | 3.91 | 14.3% | 6.9% | 9.1% | 41.9% | 37.2% | 23.9% |
I could probably just copy and paste the same excerpt every time Dickey takes the mound because my opinion on him from a fantasy perspective hasn’t changed. He may not have the highest ERA in baseball, but he has a high SIERA of 4.69 and a low strikeout rate of 16.9%. He also has to pitch in some of the toughest ballparks in baseball being in the American League East. With his reverse splits, he is an easy fade today against a right-handed heavy Tigers’ lineup.
| Jordan Zimmermann |
 | FanDuel | DraftKings |
| Salary: | $9,400 | Salary: | $9,500 |
| FPPG: | 36.7 | FPPG: | 18.4 |
| Pitcher Rating: | 55.6 | Pitcher Rank: | 21 |
| Statistics | Starts | PitchPS | SIERA | ERA | K% | BB% | SS% | GB% | FB% | HH% |
| L14 Days | 1 | 93.0 | 4.39 | 3.18 | 12.5% | 8.3% | 6.5% | 68.4% | 26.3% | 31.6% |
| 2016 | 10 | 101.5 | 4.42 | 2.58 | 15.9% | 4.8% | 7.2% | 45.3% | 38.2% | 25.7% |
| 2015 | 33 | 94.0 | 3.83 | 3.66 | 19.7% | 4.7% | 8.4% | 42.0% | 36.2% | 29.5% |
Zimmermann has been a candidate for regression all season. His SIERA is nearly two runs higher than his ERA and it’s only a matter of time before the hits start finding holes. His .274 BABIP is his lowest since his rookie season, while his left on base percentage of 79.9 is a career high. He seems a bit too expensive for a pitcher that has a strikeout rate under 16% this season. For now, I will continue to avoid Zimmermann, as there are better options at his price point.
Batter Grind Down
Toronto
The Blue Jays have been a mediocre offense against right-handed pitching this season, ranking 15th in team wOBA and 12th in team ISO. While I don’t want to target today, I’m not sure that I want to use many hitters against him either. Over the last two seasons, he has held right-handed hitters to a .278 wOBA.
- Blue Jays Offense (2016)
Team wOBA vs. RHP — 0.311 (15 of 30)
Team ISO vs. RHP — 0.168 (12 of 30)
Team K% vs. RHP — 23.0% (22 of 30)
Runs Per Game — 4.13 (20 of 30)
Projected Run Total — 4.35 (10 of 30)
Projected Lineup
| # | Player | Bats | wOBA vs. RHP | ISO vs. RHP | wOBA L14 | FD Position | FD Salary | DK Position | DK Salary |
| 1 | | RIGHT | 0.385 | 0.286 | 0.286 | OF | $4,300 | OF | $3,900 |
| 2 | | RIGHT | 0.379 | 0.254 | 0.373 | 3B | $3,900 | 3B | $4,200 |
| 3 | | RIGHT | 0.375 | 0.265 | 0.377 | 1B | $3,800 | 1B | $4,100 |
| 4 | | SWITCH | 0.337 | 0.217 | 0.285 | 1B | $3,100 | 1B | $3,000 |
| 5 | | RIGHT | 0.301 | 0.127 | 0.261 | OF | $2,700 | OF | $2,900 |
| 6 | | LEFT | 0.303 | 0.083 | 0.461 | OF | $2,400 | OF | $2,700 |
| 7 | | RIGHT | 0.373 | 0.182 | 0.411 | SS | $2,600 | 2B/SS | $2,400 |
| 8 | | LEFT | 0.293 | 0.115 | 0.542 | 2B | $2,000 | 2B | $2,300 |
| 9 | | LEFT | 0.198 | 0.015 | 0.000 | C | $2,000 | C | $2,400 |
| | Team Averages | — | 0.327 | 0.172 | 0.333 | — | — | — | — |
Elite Plays – NONE
Secondary Plays – , , ,
Stackability – NONE
Detroit
The Tigers have the highest team total of the eight teams playing in the early slate. They draw an excellent matchup against , who doesn’t strike many batters out while also giving up a decent number of home runs – 34 in his last 45 starts. Hitters from both sides of the plate are in play here, as Dickey has allowed a .305+ wOBA to both left and right-handed hitters.
- Tigers Offense (2016)
Team wOBA vs. RHP — 0.331 (7 of 30)
Team ISO vs. RHP — 0.173 (10 of 30)
Team K% vs. RHP — 23.3% (25 of 30)
Runs Per Game — 4.71 (10 of 30)
Projected Run Total — 4.65 (4 of 30)
Projected Lineup
| # | Player | Bats | wOBA vs. RHP | ISO vs. RHP | wOBA L14 | FD Position | FD Salary | DK Position | DK Salary |
| 1 | | RIGHT | 0.338 | 0.145 | 0.420 | 2B | $3,800 | 2B | $5,100 |
| 2 | | RIGHT | 0.237 | 0.064 | 0.330 | 2B | $2,000 | 2B/OF | $2,200 |
| 3 | | RIGHT | 0.413 | 0.214 | 0.283 | 1B | $3,700 | 1B | $4,100 |
| 4 | | RIGHT | 0.314 | 0.168 | 0.226 | 3B | $3,000 | 3B | $3,500 |
| 5 | | RIGHT | 0.363 | 0.245 | 0.319 | OF | $4,100 | OF | $4,600 |
| 6 | | RIGHT | 0.337 | 0.199 | 0.337 | OF | $3,100 | OF | $3,800 |
| 7 | | RIGHT | 0.248 | 0.073 | 0.373 | C | $2,400 | C | $2,600 |
| 8 | | LEFT | 0.269 | 0.058 | 0.245 | SS | $2,100 | 3B/SS | $2,500 |
| 9 | | RIGHT | 0.280 | 0.057 | 0.344 | SS | $2,500 | SS | $2,700 |
| | Team Averages | — | 0.311 | 0.136 | 0.320 | — | — | — | — |
Elite Plays – , ,
Secondary Plays – , , ,
Stackability – Cash & GPP
Atlanta at San Diego – 3:40 PM ET
| Atlanta | San Diego |
 | |  | |
| RIGHT | LEFT |
| Vegas Moneyline | Vegas Over/Under |
| SD -150 | 6.5 |
| Stats | wOBA | HR All. | K% | BB% | Stats | wOBA | HR All. | K% | BB% |
| SP vs. Left | 0.376 | 25 | 15.5% | 11.3% | SP vs. Left | 0.208 | 3 | 27.1% | 10.4% |
| SP vs. Right | 0.247 | 12 | 26.2% | 5.4% | SP vs. Right | 0.288 | 9 | 25.1% | 9.8% |
Pitcher Grind Down
| Julio Teheran |
 | FanDuel | DraftKings |
| Salary: | $8,200 | Salary: | $10,900 |
| FPPG: | 28.4 | FPPG: | 16.3 |
| Pitcher Rating: | 70.1 | Pitcher Rank: | 13 |
| Statistics | Starts | PitchPS | SIERA | ERA | K% | BB% | SS% | GB% | FB% | HH% |
| L14 Days | 3 | 101.0 | 3.00 | 3.50 | 31.0% | 7.0% | 10.2% | 41.9% | 37.2% | 27.3% |
| 2016 | 12 | 100.3 | 3.90 | 2.92 | 22.9% | 7.3% | 9.3% | 43.6% | 39.6% | 34.8% |
| 2015 | 33 | 99.2 | 4.24 | 4.04 | 20.3% | 8.7% | 10.8% | 39.5% | 36.2% | 31.4% |
Teheran finds himself in an interesting spot today against the Padres. While I almost exclusively target him when he is pitching at home, I may make an exception for a matchup against the Padres in Petco Park. Teheran comes into the start in good form, posting a 3.00 SIERA with a strikeout rate of 31% in his last two starts. He is an underdog today, but the matchup is as good as they come. On the season, the Padres are ranked 29th in team wOBA and 26th in team K% against right-handed pitching. I wouldn’t use him in cash games, but Teheran is an excellent GPP option.
| Drew Pomeranz |
 | FanDuel | DraftKings |
| Salary: | $9,700 | Salary: | $11,700 |
| FPPG: | 39.8 | FPPG: | 22.5 |
| Pitcher Rating: | 93.5 | Pitcher Rank: | 1 |
| Statistics | Starts | PitchPS | SIERA | ERA | K% | BB% | SS% | GB% | FB% | HH% |
| L14 Days | 3 | 104.3 | 3.94 | 2.84 | 27.3% | 13.0% | 9.0% | 61.0% | 26.8% | 10.9% |
| 2016 | 11 | 101.1 | 3.73 | 2.22 | 29.4% | 11.8% | 11.5% | 49.0% | 37.4% | 25.3% |
| 2015 | 9 | 160.2 | 3.73 | 3.66 | 23.0% | 8.7% | 11.0% | 42.2% | 36.3% | 24.9% |
Didn’t think I’d see the day that Pomeranz would grade out as the number one pitching option on a day when , , and were all on the mound, but here we are. He has been tremendous this season, posting a 3.73 SIERA with a strikeout rate of 29.4%. He has also been able to pitch deeper into games, which has raised both his floor and his ceiling from a fantasy perspective. He draws he best matchup on the board, as the Braves are ranked 30th in team wOBA and team ISO against left-handed pitching this season.
Batter Grind Down
Atlanta
The Braves are ranked dead last in four of the five offensive categories listed below. That is not promising in the slightest. They draw an awful matchup against , who is having a breakout season for the Padres. I will be avoiding all of the Braves’ hitters in this matchup.
- Braves Offense (2016)
Team wOBA vs. LHP — 0.255 (30 of 30)
Team ISO vs. LHP — 0.080 (30 of 30)
Team K% vs. LHP — 23.2% (22 of 30)
Runs Per Game — 3.09 (30 of 30)
Projected Run Total — 2.96 (30 of 30)
Projected Lineup
| # | Player | Bats | wOBA vs. LHP | ISO vs. LHP | wOBA L14 | FD Position | FD Salary | DK Position | DK Salary |
| 1 | | LEFT | 0.226 | 0.044 | 0.255 | OF | $2,600 | OF | $2,500 |
| 2 | Chase d’Arnaud | RIGHT | 0.339 | 0.170 | 0.310 | 2B | $2,500 | 3B/SS | $2,800 |
| 3 | | LEFT | 0.318 | 0.125 | 0.262 | 1B | $2,800 | 1B | $3,100 |
| 4 | | RIGHT | 0.315 | 0.127 | 0.396 | OF | $2,600 | OF | $2,500 |
| 5 | | LEFT | 0.279 | 0.053 | 0.256 | OF | $2,300 | OF | $2,800 |
| 6 | | RIGHT | 0.320 | 0.107 | 0.329 | C | $2,200 | C | $2,600 |
| 7 | | RIGHT | 0.327 | 0.190 | 0.168 | 3B | $2,300 | 3B | $2,700 |
| 8 | | LEFT | 0.295 | 0.127 | 0.171 | 3B | $2,100 | 2B | $2,400 |
| 9 | | RIGHT | 0.087 | 0.000 | 0.176 | P | $8,200 | P | $10,900 |
| | Team Averages | — | 0.278 | 0.105 | 0.258 | — | — | — | — |
Elite Plays – NONE
Secondary Plays – NONE
Stackability – NONE
San Diego
The Padres may be favorites in this game, but I don’t think anyone is expecting this one to turn into a shootout. San Diego is one of the worst offenses in baseball and they currently have the seventh lowest implied run total on the board. The one area to potentially attack this matchup is with left-handed hitters. Over the last two seasons, has allowed a .376 wOBA and 25 home runs to batters from the left side of the plate.
- Padres Offense (2016)
Team wOBA vs. RHP — 0.280 (29 of 30)
Team ISO vs. RHP — 0.137 (25 of 30)
Team K% vs. RHP — 24.1% (26 of 30)
Runs Per Game — 4.05 (21 of 30)
Projected Run Total — 3.54 (24 of 30)
Projected Lineup
| # | Player | Bats | wOBA vs. RHP | ISO vs. RHP | wOBA L14 | FD Position | FD Salary | DK Position | DK Salary |
| 1 | | LEFT | 0.283 | 0.088 | 0.378 | OF | $3,200 | OF | $3,400 |
| 2 | | RIGHT | 0.331 | 0.201 | 0.465 | 1B | $3,600 | 1B | $4,400 |
| 3 | | RIGHT | 0.301 | 0.174 | 0.357 | OF | $3,400 | OF | $3,800 |
| 4 | | SWITCH | 0.336 | 0.164 | 0.466 | 3B | $3,300 | 2B/3B | $3,200 |
| 5 | | RIGHT | 0.310 | 0.152 | 0.179 | OF | $2,700 | OF | $3,200 |
| 6 | | LEFT | 0.364 | 0.220 | 0.317 | 1B | $2,800 | 3B | $2,800 |
| 7 | | RIGHT | 0.282 | 0.145 | 0.415 | C | $2,900 | C | $3,100 |
| 8 | | RIGHT | 0.273 | 0.107 | 0.393 | SS | $2,500 | SS | $2,900 |
| 9 | | LEFT | 0.000 | 0.000 | 0.000 | P | $9,700 | P | $11,700 |
| | Team Averages | — | 0.276 | 0.139 | 0.330 | — | — | — | — |
Elite Plays – NONE
Secondary Plays – , , ,
Stackability – NONE
Tampa Bay at Arizona – 3:40 PM ET
| Tampa Bay | Arizona |
 | |  | |
| RIGHT | RIGHT |
| Vegas Moneyline | Vegas Over/Under |
| ARI -105 | 8.5 |
| Stats | wOBA | HR All. | K% | BB% | Stats | wOBA | HR All. | K% | BB% |
| SP vs. Left | 0.262 | 7 | 24.6% | 5.2% | SP vs. Left | 0.310 | 2 | 20.0% | 17.2% |
| SP vs. Right | 0.326 | 20 | 17.8% | 8.5% | SP vs. Right | 0.356 | 3 | 16.1% | 6.8% |
Pitcher Grind Down
| Jake Odorizzi |
 | FanDuel | DraftKings |
| Salary: | $8,200 | Salary: | $9,000 |
| FPPG: | 26.9 | FPPG: | 14.9 |
| Pitcher Rating: | 63.2 | Pitcher Rank: | 15 |
| Statistics | Starts | PitchPS | SIERA | ERA | K% | BB% | SS% | GB% | FB% | HH% |
| L14 Days | 3 | 111.7 | 3.70 | 2.00 | 27.5% | 10.1% | 9.9% | 46.5% | 37.2% | 25.6% |
| 2016 | 12 | 101.3 | 4.17 | 3.33 | 21.0% | 7.4% | 9.1% | 39.7% | 41.8% | 35.9% |
| 2015 | 28 | 98.4 | 3.90 | 3.35 | 21.4% | 6.6% | 10.1% | 37.3% | 40.6% | 27.0% |
The final game in the early slate is between the Rays and Diamondbacks. Odorizzi is a lot like in that I typically only like to target him when he is pitching at home. Unlike Teheran, his matchup doesn’t make up for it today. The Diamondbacks have a talented offense and Odorizzi has to face them in the hitter-friendly Chase Field. If you want to take a chance on a pitcher in this game, you might as well take the cheaper option in .
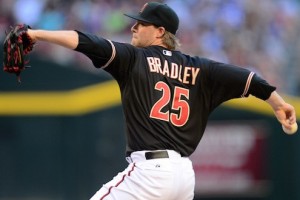
| Archie Bradley |
 | FanDuel | DraftKings |
| Salary: | $6,600 | Salary: | $7,700 |
| FPPG: | 32.8 | FPPG: | 16.4 |
| Pitcher Rating: | 61.5 | Pitcher Rank: | 17 |
| Statistics | Starts | PitchPS | SIERA | ERA | K% | BB% | SS% | GB% | FB% | HH% |
| L14 Days | 2 | 104.0 | 2.50 | 2.70 | 37.3% | 7.8% | 13.5% | 42.9% | 35.7% | 17.9% |
| 2016 | 4 | 104.8 | 3.93 | 4.94 | 24.5% | 10.8% | 8.6% | 53.0% | 27.3% | 25.8% |
| 2015 | 8 | 80.5 | 5.28 | 5.80 | 14.3% | 13.7% | 5.9% | 58.0% | 27.7% | 38.6% |
Bradley didn’t have a great rookie season, but he is coming off of back-to-back quality starts. He is one of the cheapest pitching options in the early slate and he certainly provides decent value against a Rays’ offense that is ranked 29th in team K% against right-handed pitching this season. Bradley certainly has some red flags (10.8% walk rate and a low swinging strike rate), but the upside is there.
Batter Grind Down
Tampa Bay
While I don’t mind taking a shot on today, I also don’t mind targeting a few hitters against him. The sample size is small (12 starts), but Bradley has allowed a .310 wOBA to left-handed hitters and a .356 wOBA to right-handed hitters over the last two seasons. The Rays also see a ballpark boost playing in the hitter-friendly Chase Field.
- Rays Offense (2016)
Team wOBA vs. RHP — 0.309 (19 of 30)
Team ISO vs. RHP — 0.187 (5 of 30)
Team K% vs. RHP — 25.3% (29 of 30)
Runs Per Game — 4.16 (18 of 30)
Projected Run Total — 4.22 (16 of 30)
Projected Lineup
| # | Player | Bats | wOBA vs. RHP | ISO vs. RHP | wOBA L14 | FD Position | FD Salary | DK Position | DK Salary |
| 1 | | RIGHT | 0.259 | 0.138 | 0.161 | OF | $2,300 | OF | $3,000 |
| 2 | | LEFT | 0.339 | 0.185 | 0.270 | SS | $3,100 | SS | $3,900 |
| 3 | | RIGHT | 0.318 | 0.180 | 0.513 | 3B | $4,100 | 3B | $5,200 |
| 4 | | LEFT | 0.328 | 0.192 | 0.451 | 1B | $3,400 | 1B | $4,700 |
| 5 | | RIGHT | 0.321 | 0.180 | 0.253 | OF | $3,100 | OF | $4,000 |
| 6 | | LEFT | 0.360 | 0.280 | 0.246 | OF | $2,600 | OF | $3,600 |
| 7 | | RIGHT | 0.286 | 0.185 | 0.241 | 2B | $2,300 | 2B/SS | $3,200 |
| 8 | | SWITCH | 0.331 | 0.201 | 0.494 | C | $2,100 | C | $3,300 |
| 9 | | RIGHT | 0.220 | 0.000 | | P | $8,200 | P | $9,000 |
| | Team Averages | — | 0.307 | 0.171 | 0.329 | — | — | — | — |
Elite Plays – NONE
Secondary Plays – , , ,
Stackability – GPP
Arizona
The Diamondbacks come into this game with the 14th highest team total overall, but the second highest of the eight teams in the early slate. As I mentioned above, is a different pitcher at home than he is on the road, where he has allowed a .340 wOBA in his career. I should also point out that Odorizzi is a reverse-splits pitcher, allowing a .326 wOBA and 20 home runs to right-handed hitters over the last two seasons.
- Diamondbacks Offense (2016)
Team wOBA vs. RHP — 0.319 (10 of 30)
Team ISO vs. RHP — 0.158 (16 of 30)
Team K% vs. RHP — 22.6% (20 of 30)
Runs Per Game — 4.41 (13 of 30)
Projected Run Total — 4.28 (14 of 30)
Projected Lineup
| # | Player | Bats | wOBA vs. RHP | ISO vs. RHP | wOBA L14 | FD Position | FD Salary | DK Position | DK Salary |
| 1 | | RIGHT | 0.287 | 0.098 | 0.229 | 2B | $3,000 | 2B | $3,600 |
| 2 | | LEFT | 0.271 | 0.048 | 0.284 | OF | $2,200 | OF | $2,700 |
| 3 | | RIGHT | 0.402 | 0.241 | 0.469 | 1B | $4,100 | 1B | $5,000 |
| 4 | | LEFT | 0.347 | 0.178 | 0.385 | 3B | $3,000 | 3B | $3,900 |
| 5 | | RIGHT | 0.304 | 0.175 | 0.219 | C | $2,700 | C | $3,000 |
| 6 | | LEFT | 0.386 | 0.218 | 0.730 | OF | $2,700 | OF | $3,500 |
| 7 | | RIGHT | 0.291 | 0.111 | 0.244 | OF | $2,900 | OF | $2,900 |
| 8 | | RIGHT | 0.244 | 0.110 | 0.202 | SS | $2,100 | SS | $2,200 |
| 9 | | RIGHT | 0.000 | 0.000 | 0.176 | P | $6,600 | P | $7,700 |
| | Team Averages | — | 0.281 | 0.131 | 0.326 | — | — | — | — |
Elite Plays – ,
Secondary Plays – , , / ,
Stackability – Cash & GPP
Kansas City at Baltimore – 7:05 PM ET
| Kansas City | Baltimore |
 | |  | |
| RIGHT | RIGHT |
| Vegas Moneyline | Vegas Over/Under |
| BAL -145 | 8.5 |
| Stats | wOBA | HR All. | K% | BB% | Stats | wOBA | HR All. | K% | BB% |
| SP vs. Left | 0.300 | 14 | 18.0% | 8.9% | SP vs. Left | 0.312 | 8 | 18.9% | 10.6% |
| SP vs. Right | 0.316 | 10 | 18.6% | 8.1% | SP vs. Right | 0.334 | 21 | 17.4% | 7.5% |
Pitcher Grind Down
| Edinson Volquez |
 | FanDuel | DraftKings |
| Salary: | $8,300 | Salary: | $6,600 |
| FPPG: | 29.9 | FPPG: | 14.6 |
| Pitcher Rating: | 42.9 | Pitcher Rank: | 25 |
| Statistics | Starts | PitchPS | SIERA | ERA | K% | BB% | SS% | GB% | FB% | HH% |
| L14 Days | 3 | 106.7 | 4.37 | 4.74 | 19.5% | 9.8% | 11.3% | 48.2% | 25.0% | 22.8% |
| 2016 | 12 | 103.5 | 4.36 | 4.03 | 18.5% | 8.5% | 9.1% | 51.3% | 31.6% | 23.3% |
| 2015 | 33 | 99.9 | 4.35 | 3.55 | 18.2% | 8.5% | 9.5% | 46.0% | 32.9% | 30.4% |
Volquez has been a serviceable pitcher over the last couple of seasons, posting a 4.36 SIERA with a strikeout rate right above 18%. He is typically in play on smaller slates when there are very few pitching options available. That’s not the case tonight, as he grades out as one of the worst pitching options on the board. He is an easy fade against the Orioles, who are ranked second in team wOBA and first in team ISO against right-handed pitching.
| Chris Tillman |
 | FanDuel | DraftKings |
| Salary: | $8,300 | Salary: | $7,600 |
| FPPG: | 34.6 | FPPG: | 17.9 |
| Pitcher Rating: | 57.8 | Pitcher Rank: | 19 |
| Statistics | Starts | PitchPS | SIERA | ERA | K% | BB% | SS% | GB% | FB% | HH% |
| L14 Days | 3 | 103.3 | 4.95 | 5.30 | 17.1% | 10.5% | 8.1% | 45.5% | 36.4% | 36.4% |
| 2016 | 12 | 95.3 | 4.22 | 3.33 | 23.3% | 10.3% | 9.8% | 41.4% | 39.2% | 31.7% |
| 2015 | 31 | 94.9 | 4.69 | 4.99 | 16.2% | 8.6% | 7.1% | 43.5% | 35.4% | 26.9% |
Tillman got off to a hot start this season, but has cooled off a bit lately. He now owns a 4.22 SIERA with a strikeout rate of 23.3%. The major red flag that I see is his 10.3% walk rate and his hard hit contact rate of 31.7%. The Royals may not have the best offense in baseball, but I never feel confident targeting mediocre pitchers against them. I will be avoiding both pitchers in this game.
Batter Grind Down
Kansas City
The Royals come into tonight’s game with the 12th lowest team total on the board. While they do see a ballpark boost playing in Camden Yards, they aren’t an offense that we get excited to target in DFS. They don’t hit many very many home runs. Their matchup against is decent, as he has allowed a .312 wOBA to left-handed hitters and a .334 wOBA to right-handed hitters over the last two seasons.
- Royals Offense (2016)
Team wOBA vs. RHP — 0.311 (15 of 30)
Team ISO vs. RHP — 0.133 (28 of 30)
Team K% vs. RHP — 19.4% (10 of 30)
Runs Per Game — 3.86 (24 of 30)
Projected Run Total — 3.99 (19 of 30)
Projected Lineup
| # | Player | Bats | wOBA vs. RHP | ISO vs. RHP | wOBA L14 | FD Position | FD Salary | DK Position | DK Salary |
| 1 | | RIGHT | 0.267 | 0.060 | 0.207 | SS | $2,600 | SS | $2,900 |
| 2 | | RIGHT | 0.327 | 0.087 | 0.319 | OF | $3,100 | 2B/OF | $4,100 |
| 3 | | RIGHT | 0.329 | 0.132 | 0.331 | OF | $3,100 | OF | $4,400 |
| 4 | | LEFT | 0.391 | 0.199 | 0.461 | 1B | $3,400 | 1B | $4,800 |
| 5 | | RIGHT | 0.337 | 0.198 | 0.251 | C | $2,500 | C | $3,900 |
| 6 | | SWITCH | 0.335 | 0.214 | 0.368 | 1B | $2,700 | 1B | $3,400 |
| 7 | | RIGHT | 0.310 | 0.144 | 0.285 | 3B | $2,100 | 3B | $2,800 |
| 8 | | LEFT | 0.304 | 0.120 | 0.356 | OF | $2,900 | OF | $3,700 |
| 9 | | LEFT | 0.318 | 0.000 | 0.502 | OF | $2,000 | OF | $3,400 |
| | Team Averages | — | 0.324 | 0.128 | 0.342 | — | — | — | — |
Elite Plays – NONE
Secondary Plays – , , (FD)
Stackability – NONE
Baltimore
The Orioles come into tonight’s game with the seventh highest team total on the board. The major question is whether will be in the lineup, after he charged the mound and “threw a punch at last night. A suspension is likely coming for Machado, so make sure he is in the lineup if you are considering him tonight. In terms of the Orioles’ matchup against , he has given up pretty equal splits to left and right-handed hitters.
- Orioles Offense (2016)
Team wOBA vs. RHP — 0.347 (2 of 30)
Team ISO vs. RHP — 0.202 (1 of 30)
Team K% vs. RHP — 23.0% (22 of 30)
Runs Per Game — 4.75 (9 of 30)
Projected Run Total — 4.51 (7 of 30)
Projected Lineup
| # | Player | Bats | wOBA vs. RHP | ISO vs. RHP | wOBA L14 | FD Position | FD Salary | DK Position | DK Salary |
| 1 | | RIGHT | 0.336 | 0.207 | 0.344 | OF | $3,300 | OF | $4,300 |
| 2 | Hyun-Soo Kim | LEFT | 0.419 | 0.119 | 0.421 | OF | $2,600 | OF | $3,500 |
| 3 | | RIGHT | 0.389 | 0.251 | 0.398 | SS | $4,000 | 3B/SS | $4,900 |
| 4 | | RIGHT | 0.346 | 0.199 | 0.511 | OF | $4,100 | OF | $5,000 |
| 5 | | LEFT | 0.394 | 0.318 | 0.301 | 1B | $3,700 | 1B | $4,200 |
| 6 | | SWITCH | 0.337 | 0.159 | 0.300 | C | $3,200 | C | $3,500 |
| 7 | | LEFT | 0.336 | 0.234 | 0.359 | 3B | $2,700 | 1B | $3,500 |
| 8 | | RIGHT | 0.355 | 0.234 | 0.248 | 2B | $3,000 | 2B | $3,600 |
| 9 | | LEFT | 0.272 | 0.129 | 0.337 | 2B | $2,300 | 3B | $2,800 |
| | Team Averages | — | 0.354 | 0.206 | 0.358 | — | — | — | — |
Elite Plays – Hyun-Soo Kim,
Secondary Plays – , ,
Stackability – Cash & GPP
Are you an incentives member? Come check out the MLB Expert Chat from 5:30 – 6:00 PM ET.
Jump to Page 1 2 3
