MLB Grind Down: Friday, September 9th

Jump to Page 1 2 3
The RotoGrinders MLB Grind Down will give you an in-depth analysis into the upcoming MLB schedule. This article will break down the numbers for every single game and give you analysis on which trends you can exploit. While matchups are a major factor in daily fantasy baseball, there are plenty of other factors to consider such as injuries, weather, and salaries.
The analysis should point you in the right direction, but it is still up to you to decipher the information and make your own selections. No sport has more variance than baseball. The best choice is not always the right choice but following the trends will win you money over time.
Note: As always, if you want to try a new DFS site, be sure to click through a RotoGrinders link and use our DraftKings promo code and FanDuel promo code to receive the best perks in the industry.
Stackability Rating System:
GREEN – One of the top stacks of the day, viable in cash games and GPPs
YELLOW – A viable stack option in most formats, specifically GPPs
ORANGE – There are better stacks out there, but playable in large GPPs
RED – Not a recommended stack for cash games or GPPs
Cincinnati at Pittsburgh – 7:05 PM ET
| Cincinnati | Pittsburgh | ||||||||
 | Tim Adleman |  | Steven Brault | ||||||
| RIGHT | LEFT | ||||||||
| Vegas Moneyline | Vegas Over/Under | ||||||||
| PIT -157 | 9.0 | ||||||||
| Stats | wOBA | HR All. | HC% | K% | Stats | wOBA | HR All. | HC% | K% |
|---|---|---|---|---|---|---|---|---|---|
| SP vs. Left (2015-16) | 0.365 | 6 | 27.8% | 23.2% | SP vs. Left (2015-16) | 0.328 | 0 | 9.1% | 18.8% |
| SP vs. Right (2015-16) | 0.340 | 4 | 35.2% | 12.4% | SP vs. Right (2015-16) | 0.353 | 2 | 31.3% | 19.7% |
Pitcher Grind Down
| Tim Adleman | ||||||||||
 | FanDuel | DraftKings | ||||||||
| Salary: | $6,000 | Salary: | $5,700 | |||||||
| FPPG: | 22.6 | FPPG: | 11.2 | |||||||
| Pitcher Rating: | 34.0 | Pitcher Rank: | 29 | |||||||
| Statistics | Starts | PitchPS | SIERA | ERA | K% | BB% | SS% | GB% | FB% | HC% |
|---|---|---|---|---|---|---|---|---|---|---|
| L30 Days | 4 | 81.3 | 5.06 | 4.29 | 15.9% | 4.6% | 10.5% | 25.4% | 52.2% | 35.3% |
| 2016 | 8 | 82.6 | 4.84 | 4.02 | 17.5% | 7.6% | 9.7% | 34.7% | 46.3% | 32.0% |
Home:—ERA: 3.86 — K%: 16.7% — wOBA Allowed: 0.348
Away:—ERA: 4.24 — K%: 18.8% — wOBA Allowed: 0.360
Am I the only one that is having a hard time concentrating on baseball with the first NFL Sunday only two days away?
Adleman has not pitched well in his six start this season, posting a 4.84 SIERA with a strikeout rate of only 17.5%. He is a fly ball pitcher that has allowed a hard contact rate of 32%. While the Pirates have struggled against right-handed pitching, there isn’t enough upside for Adleman to warrant fantasy consideration.
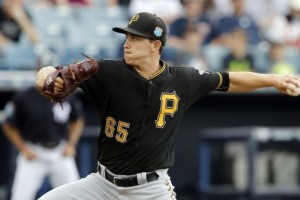
| Steven Brault | ||||||||||
 | FanDuel | DraftKings | ||||||||
| Salary: | $5,800 | Salary: | $4,000 | |||||||
| FPPG: | 21.8 | FPPG: | 11.0 | |||||||
| Pitcher Rating: | 61.1 | Pitcher Rank: | 14 | |||||||
| Statistics | Starts | PitchPS | SIERA | ERA | K% | BB% | SS% | GB% | FB% | HC% |
|---|---|---|---|---|---|---|---|---|---|---|
| L30 Days | 2 | 88.0 | 4.75 | 3.00 | 21.4% | 11.9% | 9.7% | 37.0% | 29.6% | 33.3% |
| 2016 | 4 | 91.0 | 4.97 | 3.32 | 19.5% | 11.5% | 9.3% | 35.1% | 36.8% | 27.1% |
Home:—ERA: 1.80 — K%: 23.8% — wOBA Allowed: 0.354
Away:—ERA: 3.86 — K%: 18.2% — wOBA Allowed: 0.347
Brault has a low ERA in his first four major league starts, but his peripheral statistics tell another story. During that stretch, he has a 4.97 SIERA with a walk rate of 11.5%. While I do like that he is pitching at home against the Reds, there are more favorable matchups to exploit tonight. Brault is a deep GPP flier at best in this full slate.
Batter Grind Down
Cincinnati
The Reds have a mediocre run projection tonight, as they square off against rookie Steven Brault. The sample size is small, but Brault has allowed a .353 wOBA to right-handed hitters this season. Jose Peraza is an intriguing play if he is batting leadoff again. He has good stolen base potential, especially if Francisco Cervelli is behind the plate.
- Reds Offense (2016)
Team wOBA vs. LHP — 0.302 (24 of 30)
Team wOBA L30 Days — 0.332 (11 of 30)
Team ISO vs. LHP — 0.153 (21 of 30)
Team K% vs. LHP — 23.2% (25 of 30)
Pitches Per PA vs. LHP — 3.90 (12 of 30)
Runs Per Game — 4.37 (19 of 30)
Projected Run Total — 4.17 (16 of 30)
Projected Lineup
| # | Player | Bats | wOBA vs. LHP | ISO vs. LHP | HC% vs. LHP | wOBA L14 | FD Position | FD Salary | DK Position | DK Salary |
|---|---|---|---|---|---|---|---|---|---|---|
| 1 | Jose Peraza | RIGHT | 0.363 | 0.154 | 22.0% | 0.488 | SS | $2,900 | OF/SS | $4,100 |
| 2 | Zack Cozart | RIGHT | 0.340 | 0.236 | 31.3% | 0.280 | SS | $3,500 | SS | $4,200 |
| 3 | Joey Votto | LEFT | 0.402 | 0.177 | 30.4% | 0.403 | 1B | $3,700 | 1B | $4,500 |
| 4 | Adam Duvall | RIGHT | 0.316 | 0.217 | 40.2% | 0.302 | OF | $3,100 | OF | $3,900 |
| 5 | Brandon Phillips | RIGHT | 0.301 | 0.092 | 22.9% | 0.301 | 2B | $3,000 | 2B | $3,600 |
| 6 | Eugenio Suarez | RIGHT | 0.374 | 0.227 | 31.9% | 0.302 | 3B | $2,700 | 3B | $4,100 |
| 7 | Tucker Barnhart | SWITCH | 0.226 | 0.065 | 15.6% | 0.246 | C | $2,400 | C | $3,000 |
| 8 | Tyler Holt | RIGHT | 0.266 | 0.057 | 15.8% | 0.379 | OF | $2,200 | OF | $3,000 |
| 9 | Tim Adleman | RIGHT | 0.000 | 0.000 | 0.0% | 0.000 | P | $6,000 | P | $5,700 |
| Team Averages | — | 0.288 | 0.136 | 23.3% | 0.300 | — | — | — | — |
Elite Plays – Jose Peraza
Secondary Plays – Joey Votto, Adam Duvall
Stackability – ORANGE
Pittsburgh
The Pirates have the second highest run projection in the slate. I repeat, the Pirates have the second highest run projection in the slate. They have been a disappointment offensively this season, but you have to like the matchup against Tim Adleman. On the season, he has allowed a .340+ wOBA to both left and right-handed hitters.
- Pirates Offense (2016)
Team wOBA vs. RHP — 0.311 (21 of 30)
Team wOBA L30 Days — 0.314 (24 of 30)
Team ISO vs. RHP — 0.140 (27 of 30)
Team K% vs. RHP — 20.8% (14 of 30)
Pitches Per PA vs. RHP — 3.97 (4 of 30)
Runs Per Game — 4.48 (17 of 30)
Projected Run Total — 4.83 (2 of 30)
Projected Lineup
| # | Player | Bats | wOBA vs. RHP | ISO vs. RHP | HC% vs. RHP | wOBA L14 | FD Position | FD Salary | DK Position | DK Salary |
|---|---|---|---|---|---|---|---|---|---|---|
| 1 | Josh Harrison | RIGHT | 0.295 | 0.097 | 25.7% | 0.319 | 2B | $3,300 | 2B | $3,500 |
| 2 | John Jaso | LEFT | 0.342 | 0.144 | 32.3% | 0.457 | 1B | $2,500 | 1B | $3,100 |
| 3 | Andrew McCutchen | RIGHT | 0.352 | 0.182 | 38.2% | 0.337 | OF | $3,200 | OF | $3,900 |
| 4 | Gregory Polanco | LEFT | 0.331 | 0.171 | 33.4% | 0.236 | OF | $4,000 | OF | $5,000 |
| 5 | Starling Marte | RIGHT | 0.350 | 0.154 | 32.2% | 0.388 | OF | $3,700 | OF | $5,400 |
| 6 | Jung-Ho Kang | RIGHT | 0.367 | 0.216 | 37.6% | 0.866 | 3B | $3,300 | 3B | $4,900 |
| 7 | Francisco Cervelli | RIGHT | 0.318 | 0.075 | 26.8% | 0.274 | C | $2,900 | C | $2,900 |
| 8 | Jordy Mercer | RIGHT | 0.275 | 0.088 | 24.5% | 0.287 | SS | $2,600 | SS | $3,100 |
| 9 | Steven Brault | LEFT | 0.176 | 0.000 | 0.0% | 0.000 | P | $5,800 | P | $4,000 |
| Team Averages | — | 0.312 | 0.125 | 27.9% | 0.352 | — | — | — | — |
Elite Plays – Andrew McCutchen, Jung-Ho Kang
Secondary Plays – Josh Harrison, Gregory Polanco, Starling Marte
Stackability – YELLOW / GREEN
Philadelphia at Washington – 7:05 PM ET
| Philadelphia | Washington | ||||||||
 | Jake Thompson |  | Tanner Roark | ||||||
| RIGHT | RIGHT | ||||||||
| Vegas Moneyline | Vegas Over/Under | ||||||||
| WAS -265 | 9.0 | ||||||||
| Stats | wOBA | HR All. | HC% | K% | Stats | wOBA | HR All. | HC% | K% |
|---|---|---|---|---|---|---|---|---|---|
| SP vs. Left (2015-16) | 0.381 | 3 | 31.6% | 13.4% | SP vs. Left (2015-16) | 0.319 | 15 | 30.8% | 16.4% |
| SP vs. Right (2015-16) | 0.340 | 4 | 37.3% | 16.2% | SP vs. Right (2015-16) | 0.293 | 16 | 20.3% | 18.8% |
Pitcher Grind Down
| Jake Thompson | ||||||||||
 | FanDuel | DraftKings | ||||||||
| Salary: | $6,100 | Salary: | $4,000 | |||||||
| FPPG: | 17.7 | FPPG: | 7.2 | |||||||
| Pitcher Rating: | 30.0 | Pitcher Rank: | 30 | |||||||
| Statistics | Starts | PitchPS | SIERA | ERA | K% | BB% | SS% | GB% | FB% | HC% |
|---|---|---|---|---|---|---|---|---|---|---|
| L30 Days | 5 | 98.6 | 5.40 | 5.59 | 16.4% | 12.5% | 6.9% | 50.6% | 39.1% | 31.1% |
| 2016 | 6 | 96.0 | 5.54 | 6.48 | 14.7% | 12.0% | 7.1% | 49.0% | 36.5% | 34.3% |
Home:—ERA: 4.13 — K%: 18.5% — wOBA Allowed: 0.298
Away:—ERA: 12.54 — K%: 6.4% — wOBA Allowed: 0.500
Thompson has been one of my favorite pitchers to target hitters against and that’s not a tradition that I am willing to abandon just yet. He comes into tonight’s game as a massive underdog against the Nationals, who have a lot more to play for than the Phillies. With such a low strikeout rate, Thompson can be avoided in both cash games and tournaments.
| Tanner Roark | ||||||||||
 | FanDuel | DraftKings | ||||||||
| Salary: | $8,500 | Salary: | $9,300 | |||||||
| FPPG: | 33.1 | FPPG: | 17.1 | |||||||
| Pitcher Rating: | 57.4 | Pitcher Rank: | 19 | |||||||
| Statistics | Starts | PitchPS | SIERA | ERA | K% | BB% | SS% | GB% | FB% | HC% |
|---|---|---|---|---|---|---|---|---|---|---|
| L30 Days | 5 | 101.8 | 5.41 | 2.97 | 14.5% | 10.5% | 6.5% | 41.4% | 34.5% | 31.5% |
| 2016 | 28 | 102.9 | 4.35 | 2.89 | 19.3% | 8.0% | 8.4% | 48.9% | 30.8% | 24.5% |
| 2015 | 12 | 150.0 | 4.16 | 4.38 | 15.0% | 5.6% | 7.1% | 47.8% | 30.6% | 26.3% |
Home:—ERA: 3.33 — K%: 18.8% — wOBA Allowed: 0.302
Away:—ERA: 3.56 — K%: 16.7% — wOBA Allowed: 0.308
I’ve been harping on the potential regression for Roark recently. His low ERA is unsustainable given the rest of his numbers. In his last five starts, he has a 5.41 SIERA with a strikeout rate of only 14.5%. Eventually, the wheels are going to come off. While I am always a fan of targeting pitchers against the Phillies, I will have very limited exposure to Roark.
Batter Grind Down
Philadelphia
In what should surprise no one, the Phillies have one of the lowest implied team totals in the slate. They have struggled against right-handed pitching this season, they are playing in a pitcher’s ballpark, and they draw a difficult matchup against Tanner Roark. Even though I expect regression to hit eventually, Roark has held both left and right-handed hitters under a .320 wOBA.
- Phillies Offense (2016)
Team wOBA vs. RHP — 0.296 (29 of 30)
Team wOBA L30 Days — 0.287 (27 of 30)
Team ISO vs. RHP — 0.157 (19 of 30)
Team K% vs. RHP — 22.3% (24 of 30)
Pitches Per PA vs. RHP — 3.80 (27 of 30)
Runs Per Game — 3.67 (30 of 30)
Projected Run Total — 3.55 (27 of 30)
Projected Lineup
| # | Player | Bats | wOBA vs. RHP | ISO vs. RHP | HC% vs. RHP | wOBA L14 | FD Position | FD Salary | DK Position | DK Salary |
|---|---|---|---|---|---|---|---|---|---|---|
| 1 | Cesar Hernandez | SWITCH | 0.312 | 0.105 | 26.7% | 0.321 | 2B | $3,300 | 2B | $3,800 |
| 2 | Odubel Herrera | LEFT | 0.343 | 0.144 | 29.7% | 0.280 | OF | $3,300 | OF | $3,800 |
| 3 | Maikel Franco | RIGHT | 0.317 | 0.180 | 28.4% | 0.191 | 3B | $3,000 | 3B | $3,100 |
| 4 | Tommy Joseph | RIGHT | 0.314 | 0.238 | 37.2% | 0.188 | 1B | $2,300 | 1B | $3,500 |
| 5 | Cameron Rupp | RIGHT | 0.290 | 0.144 | 30.2% | 0.112 | C | $2,700 | C | $2,700 |
| 6 | Freddy Galvis | SWITCH | 0.293 | 0.137 | 28.1% | 0.357 | SS | $2,700 | SS | $3,700 |
| 7 | Aaron Altherr | RIGHT | 0.330 | 0.187 | 32.6% | 0.220 | OF | $2,700 | OF | $3,500 |
| 8 | Peter Bourjos | RIGHT | 0.282 | 0.153 | 22.6% | 0.322 | OF | $2,700 | OF | $3,100 |
| 9 | Jake Thompson | RIGHT | 0.146 | 0.000 | 16.7% | 0.000 | P | $6,100 | P | $4,000 |
| Team Averages | — | 0.292 | 0.143 | 28.0% | 0.221 | — | — | — | — |
Elite Plays – NONE
Secondary Plays – Ryan Howard
Stackability – RED
Washington
The Nationals had a big letdown last night against Alec Asher. They will look to right the ship tonight against Jake Thompson, who has been downright awful in his first six major league starts. With the highest implied team total on the board, hitters from both sides of the plate are in play here.
- Nationals Offense (2016)
Team wOBA vs. RHP — 0.320 (13 of 30)
Team wOBA L30 Days — 0.331 (12 of 30)
Team ISO vs. RHP — 0.165 (16 of 30)
Team K% vs. RHP — 19.4% (7 of 30)
Pitches Per PA vs. RHP — 3.89 (13 of 30)
Runs Per Game — 4.76 (8 of 30)
Projected Run Total — 5.45 (1 of 30)
Projected Lineup
| # | Player | Bats | wOBA vs. RHP | ISO vs. RHP | HC% vs. RHP | wOBA L14 | FD Position | FD Salary | DK Position | DK Salary |
|---|---|---|---|---|---|---|---|---|---|---|
| 1 | Trea Turner | RIGHT | 0.373 | 0.211 | 31.1% | 0.388 | OF | $4,200 | 2B/OF | $5,300 |
| 2 | Jayson Werth | RIGHT | 0.299 | 0.141 | 34.0% | 0.368 | OF | $3,700 | OF | $4,200 |
| 3 | Daniel Murphy | LEFT | 0.378 | 0.227 | 36.2% | 0.346 | 2B | $4,300 | 2B | $5,500 |
| 4 | Bryce Harper | LEFT | 0.424 | 0.284 | 36.7% | 0.356 | OF | $4,000 | OF | $5,300 |
| 5 | Wilson Ramos | RIGHT | 0.307 | 0.144 | 30.2% | 0.294 | C | $3,600 | C | $4,100 |
| 6 | Anthony Rendon | RIGHT | 0.329 | 0.156 | 36.0% | 0.350 | 3B | $3,800 | 3B | $4,200 |
| 7 | Ryan Zimmerman | RIGHT | 0.283 | 0.156 | 32.6% | 0.181 | 1B | $3,200 | 1B | $3,100 |
| 8 | Danny Espinosa | SWITCH | 0.303 | 0.157 | 30.1% | 0.290 | SS | $2,900 | SS | $3,200 |
| 9 | Tanner Roark | RIGHT | 0.151 | 0.030 | 8.0% | 0.176 | P | $8,500 | P | $9,300 |
| Team Averages | — | 0.316 | 0.167 | 30.5% | 0.305 | — | — | — | — |
Elite Plays – Trea Turner, Daniel Murphy, Bryce Harper
Secondary Plays – Anthony Rendon, Wilson Ramos
Stackability – YELLOW / GREEN
Tampa Bay at NY Yankees – 7:05 PM ET
| Tampa Bay | NY Yankees | ||||||||
 | Blake Snell |  | Michael Pineda | ||||||
| LEFT | RIGHT | ||||||||
| Vegas Moneyline | Vegas Over/Under | ||||||||
| NYY -140 | 8.5 | ||||||||
| Stats | wOBA | HR All. | HC% | K% | Stats | wOBA | HR All. | HC% | K% |
|---|---|---|---|---|---|---|---|---|---|
| SP vs. Left (2015-16) | 0.290 | 0 | 34.9% | 26.0% | SP vs. Left (2015-16) | 0.330 | 17 | 32.4% | 25.0% |
| SP vs. Right (2015-16) | 0.324 | 4 | 29.8% | 23.2% | SP vs. Right (2015-16) | 0.327 | 26 | 31.4% | 24.7% |
Pitcher Grind Down
| Blake Snell | ||||||||||
 | FanDuel | DraftKings | ||||||||
| Salary: | $8,000 | Salary: | $7,100 | |||||||
| FPPG: | 29.1 | FPPG: | 14.6 | |||||||
| Pitcher Rating: | 58.4 | Pitcher Rank: | 18 | |||||||
| Statistics | Starts | PitchPS | SIERA | ERA | K% | BB% | SS% | GB% | FB% | HC% |
|---|---|---|---|---|---|---|---|---|---|---|
| L30 Days | 5 | 85.0 | 5.06 | 4.66 | 24.2% | 15.8% | 12.7% | 29.8% | 38.6% | 36.8% |
| 2016 | 15 | 93.9 | 4.61 | 3.39 | 23.8% | 12.7% | 10.5% | 37.5% | 35.6% | 30.8% |
Home:—ERA: 3.38 — K%: 25.4% — wOBA Allowed: 0.309
Away:—ERA: 3.41 — K%: 21.3% — wOBA Allowed: 0.328
Snell has shown great strikeout potential this season, but until he can improve his command, he will remain a risky fantasy option. On the season, he owns a 4.61 SIERA with a strikeout rate of 23.8% and a walk rate of 12.7%. He draws a fairly difficult matchup against the Yankees, who have had an offensive surge in the last four weeks.
| Michael Pineda | ||||||||||
 | FanDuel | DraftKings | ||||||||
| Salary: | $8,200 | Salary: | $7,400 | |||||||
| FPPG: | 29.1 | FPPG: | 15.2 | |||||||
| Pitcher Rating: | 80.8 | Pitcher Rank: | 6 | |||||||
| Statistics | Starts | PitchPS | SIERA | ERA | K% | BB% | SS% | GB% | FB% | HC% |
|---|---|---|---|---|---|---|---|---|---|---|
| L30 Days | 5 | 86.0 | 3.60 | 4.78 | 20.5% | 5.4% | 13.0% | 54.3% | 22.2% | 37.0% |
| 2016 | 27 | 95.5 | 3.44 | 5.10 | 26.3% | 6.4% | 14.0% | 46.4% | 31.6% | 33.7% |
| 2015 | 27 | 94.4 | 3.09 | 4.37 | 23.4% | 3.1% | 11.9% | 48.2% | 29.9% | 30.1% |
Home:—ERA: 4.60 — K%: 25.7% — wOBA Allowed: 0.325
Away:—ERA: 4.86 — K%: 23.9% — wOBA Allowed: 0.332
Pineda grades out as one of the best values at the pitcher position, but that always sees to be the case. In 27 starts this season, he has a 3.44 SIERA with a strikeout rate of 26.3%. The main issue is that his solid peripheral stats have yet to show up in his actual ERA. The good news is that he gets to face a strikeout-happy Rays’ offense. Even if Pineda gives up a couple of runs, the strikeouts should be there.
Batter Grind Down
The Rays are ranked 15th in team wOBA and fourth in team ISO against right-handed pitching this season. While they see a favorable ballpark shift playing in Yankee Stadium, I don’t love their matchup against Michael Pineda. As I mentioned above, his ERA estimators suggest that he has been a better pitcher than that 5.10 ERA.
Tampa Bay
- Rays Offense (2016)
Team wOBA vs. RHP — 0.316 (15 of 30)
Team wOBA L30 Days — 0.333 (9 of 30)
Team ISO vs. RHP — 0.190 (4 of 30)
Team K% vs. RHP — 23.8% (27 of 30)
Pitches Per PA vs. RHP — 3.89 (12 of 30)
Runs Per Game — 4.24 (22 of 30)
Projected Run Total — 4.02 (22 of 30)
Projected Lineup
| # | Player | Bats | wOBA vs. RHP | ISO vs. RHP | HC% vs. RHP | wOBA L14 | FD Position | FD Salary | DK Position | DK Salary |
|---|---|---|---|---|---|---|---|---|---|---|
| 1 | Logan Forsythe | RIGHT | 0.335 | 0.139 | 31.5% | 0.403 | 2B | $3,200 | 2B | $4,300 |
| 2 | Kevin Kiermaier | LEFT | 0.324 | 0.176 | 27.8% | 0.353 | OF | $3,600 | OF | $4,600 |
| 3 | Evan Longoria | RIGHT | 0.332 | 0.201 | 33.8% | 0.247 | 3B | $3,800 | 3B | $3,700 |
| 4 | Brad Miller | LEFT | 0.349 | 0.228 | 34.7% | 0.215 | SS | $3,300 | 1B/SS | $4,000 |
| 5 | Logan Morrison | LEFT | 0.322 | 0.192 | 35.1% | 0.523 | 1B | $2,500 | 1B | $4,000 |
| 6 | Steven Souza | RIGHT | 0.309 | 0.165 | 32.8% | 0.145 | OF | $2,700 | OF | $2,700 |
| 7 | Nick Franklin | SWITCH | 0.314 | 0.210 | 36.0% | 0.345 | 2B | $3,000 | 2B/OF | $3,800 |
| 8 | Corey Dickerson | LEFT | 0.343 | 0.259 | 34.0% | 0.298 | OF | $2,900 | OF | $3,400 |
| 9 | Bobby Wilson | RIGHT | 0.253 | 0.089 | 22.8% | 0.307 | C | $2,000 | C | $2,800 |
| Team Averages | — | 0.320 | 0.184 | 32.1% | 0.315 | — | — | — | — |
Elite Plays – NONE
Secondary Plays – Kevin Kiermaier
Stackability – ORANGE
NY Yankees
The Yankees have the seventh highest run projection in the slate, as they square off against Blake Snell at home. In 15 starts this season, Snell has allowed a .324 wOBA to right-handed hitters. Gary Sanchez has cooled off a bit recently, but that has suppressed his salary.
- Yankees Offense (2016)
Team wOBA vs. LHP — 0.300 (25 of 30)
Team wOBA L30 Days — 0.330 (13 of 30)
Team ISO vs. LHP — 0.133 (27 of 30)
Team K% vs. LHP — 18.3% (3 of 30)
Pitches Per PA vs. LHP — 3.77 (29 of 30)
Runs Per Game — 4.25 (21 of 30)
Projected Run Total — 4.48 (7 of 30)
Projected Lineup
| # | Player | Bats | wOBA vs. LHP | ISO vs. LHP | HC% vs. LHP | wOBA L14 | FD Position | FD Salary | DK Position | DK Salary |
|---|---|---|---|---|---|---|---|---|---|---|
| 1 | Brett Gardner | LEFT | 0.317 | 0.102 | 23.0% | 0.280 | OF | $3,300 | OF | $3,300 |
| 2 | Jacoby Ellsbury | LEFT | 0.280 | 0.078 | 23.6% | 0.396 | OF | $3,300 | OF | $3,800 |
| 3 | Gary Sanchez | RIGHT | 0.209 | 0.130 | 30.8% | 0.375 | C | $3,800 | C | $4,300 |
| 4 | Didi Gregorius | LEFT | 0.316 | 0.107 | 22.8% | 0.277 | SS | $3,100 | SS | $3,700 |
| 5 | Starlin Castro | RIGHT | 0.296 | 0.119 | 27.8% | 0.336 | 2B | $2,500 | 2B | $3,500 |
| 6 | Chase Headley | SWITCH | 0.316 | 0.112 | 27.0% | 0.359 | 3B | $2,700 | 3B | $3,400 |
| 7 | Austin Romine | RIGHT | 0.305 | 0.171 | 30.7% | 0.222 | C | $2,300 | C | $2,500 |
| 8 | Aaron Judge | RIGHT | 0.068 | 0.000 | 40.0% | 0.177 | OF | $2,400 | OF | $3,700 |
| 9 | Tyler Austin | RIGHT | 0.110 | 0.000 | 60.0% | 0.391 | 1B | $2,300 | 1B | $2,500 |
| Team Averages | — | 0.246 | 0.091 | 31.7% | 0.313 | — | — | — | — |
Elite Plays – NONE
Secondary Plays – Brett Gardner, Jacoby Ellsbury, Gary Sanchez, Starlin Castro
Stackability – ORANGE / YELLOW
Boston at Toronto – 7:07 PM ET
| Boston | Toronto | ||||||||
 | Rick Porcello |  | Marco Estrada | ||||||
| RIGHT | RIGHT | ||||||||
| Vegas Moneyline | Vegas Over/Under | ||||||||
| BOS -114 | 8.5 | ||||||||
| Stats | wOBA | HR All. | HC% | K% | Stats | wOBA | HR All. | HC% | K% |
|---|---|---|---|---|---|---|---|---|---|
| SP vs. Left (2015-16) | 0.308 | 24 | 33.2% | 20.9% | SP vs. Left (2015-16) | 0.273 | 24 | 28.0% | 19.5% |
| SP vs. Right (2015-16) | 0.312 | 21 | 29.8% | 19.9% | SP vs. Right (2015-16) | 0.287 | 21 | 31.7% | 20.8% |
Pitcher Grind Down
| Rick Porcello | ||||||||||
 | FanDuel | DraftKings | ||||||||
| Salary: | $9,500 | Salary: | $11,000 | |||||||
| FPPG: | 37.5 | FPPG: | 19.8 | |||||||
| Pitcher Rating: | 69.0 | Pitcher Rank: | 11 | |||||||
| Statistics | Starts | PitchPS | SIERA | ERA | K% | BB% | SS% | GB% | FB% | HC% |
|---|---|---|---|---|---|---|---|---|---|---|
| L30 Days | 6 | 103.5 | 3.65 | 2.47 | 21.2% | 1.8% | 8.9% | 41.7% | 38.6% | 29.9% |
| 2016 | 28 | 102.7 | 3.85 | 3.23 | 20.6% | 3.8% | 7.7% | 44.4% | 36.5% | 30.6% |
| 2015 | 28 | 98.0 | 3.73 | 4.92 | 20.2% | 5.2% | 8.5% | 45.7% | 32.5% | 32.8% |
Home:—ERA: 3.60 — K%: 21.1% — wOBA Allowed: 0.300
Away:—ERA: 4.46 — K%: 19.8% — wOBA Allowed: 0.319
Porcello has quietly pitched well this season, sporting a 3.23 ERA (3.85 SIERA) with a strikeout rate of 20.6%. He doesn’t walk many batters and he produces enough ground balls to limit his hard contact allowed. Unfortunately, he has to face the Blue Jays in the Rogers Centre tonight. On the season, Toronto is ranked ninth in team wOBA and fifth in team ISO against right-handed pitching.
| Marco Estrada | ||||||||||
 | FanDuel | DraftKings | ||||||||
| Salary: | $7,800 | Salary: | $6,800 | |||||||
| FPPG: | 32.4 | FPPG: | 17.6 | |||||||
| Pitcher Rating: | 50.8 | Pitcher Rank: | 23 | |||||||
| Statistics | Starts | PitchPS | SIERA | ERA | K% | BB% | SS% | GB% | FB% | HC% |
|---|---|---|---|---|---|---|---|---|---|---|
| L30 Days | 5 | 90.4 | 4.82 | 6.58 | 18.3% | 8.3% | 10.6% | 32.1% | 44.0% | 32.6% |
| 2016 | 24 | 98.2 | 4.33 | 3.56 | 22.5% | 8.5% | 10.8% | 34.0% | 46.7% | 32.6% |
| 2015 | 28 | 104.0 | 4.64 | 3.13 | 18.1% | 7.6% | 9.9% | 32.2% | 52.3% | 27.4% |
Home:—ERA: 3.11 — K%: 19.9% — wOBA Allowed: 0.278
Away:—ERA: 3.52 — K%: 20.2% — wOBA Allowed: 0.280
Despite being an extreme fly ball pitcher, Estrada has pitched well at home in the last two seasons, posting a 3.11 ERA with a strikeout rate of 19.9%. His numbers suggest some regression, but that has been the case for nearly two full seasons now. The main issue tonight is his matchup against the Red Sox, who are ranked first in team wOBA against right-handed pitching. When AL East teams meet up, there are generally a lot of runs scored.
Batter Grind Down
Boston
The Red Sox may not be playing at home, but they are facing an extreme fly ball pitcher in a hitter-friendly ballpark. In the last two seasons, Marco Estrada has held both left and right-handed hitters under a .290 wOBA, but he gave up 45 home runs during that stretch. A Red Sox stack is always in play, but I actually prefer using them as one-off targets in tournaments.
- Red Sox Offense (2016)
Team wOBA vs. RHP — 0.349 (1 of 30)
Team wOBA L30 Days — 0.353 (2 of 30)
Team ISO vs. RHP — 0.184 (6 of 30)
Team K% vs. RHP — 18.4% (3 of 30)
Pitches Per PA vs. RHP — 3.94 (6 of 30)
Runs Per Game — 5.50 (1 of 30)
Projected Run Total — 4.34 (10 of 30)
Projected Lineup
| # | Player | Bats | wOBA vs. RHP | ISO vs. RHP | HC% vs. RHP | wOBA L14 | FD Position | FD Salary | DK Position | DK Salary |
|---|---|---|---|---|---|---|---|---|---|---|
| 1 | Dustin Pedroia | RIGHT | 0.357 | 0.136 | 29.7% | 0.499 | 2B | $3,400 | 2B | $4,100 |
| 2 | Xander Bogaerts | RIGHT | 0.330 | 0.118 | 27.7% | 0.317 | SS | $3,600 | SS | $3,900 |
| 3 | David Ortiz | LEFT | 0.426 | 0.336 | 45.0% | 0.331 | 1B | $4,300 | 1B | $5,100 |
| 4 | Mookie Betts | RIGHT | 0.368 | 0.209 | 33.2% | 0.366 | OF | $3,900 | OF | $4,800 |
| 5 | Hanley Ramirez | RIGHT | 0.319 | 0.160 | 34.2% | 0.434 | 1B | $3,700 | 1B | $4,200 |
| 6 | Sandy Leon | SWITCH | 0.329 | 0.119 | 29.5% | 0.290 | C | $2,700 | C | $3,100 |
| 7 | Chris Young | RIGHT | 0.352 | 0.000 | 0.0% | 0.379 | OF | $3,500 | P | $4,000 |
| 8 | Yoan Moncada | SWITCH | 0.230 | 0.067 | 16.7% | 0.254 | 3B | $3,000 | 2B/3B | $3,000 |
| 9 | Jackie Bradley Jr. | LEFT | 0.369 | 0.266 | 37.9% | 0.340 | OF | $3,400 | OF | $4,400 |
| Team Averages | — | 0.342 | 0.157 | 28.2% | 0.357 | — | — | — | — |
Elite Plays – David Ortiz, Mookie Betts
Secondary Plays – Dustin Pedroia, Xander Bogaerts, Hanley Ramirez, Sandy Leon
Stackability – YELLOW
Toronto
The Blue Jays are always in play at home in the hitter-friendly Rogers Centre. While their matchup against Rick Porcello doesn’t look great on paper, he has allowed 45 home runs (the same number as Marco Estrada) in the last two seasons. Much like the Red Sox, I prefer to use the Blue Jays as one-offs tonight rather than a full stack when it comes to GPPs.
- Blue Jays Offense (2016)
Team wOBA vs. RHP — 0.327 (9 of 30)
Team wOBA L30 Days — 0.336 (6 of 30)
Team ISO vs. RHP — 0.188 (5 of 30)
Team K% vs. RHP — 22.6% (26 of 30)
Pitches Per PA vs. RHP — 4.07 (1 of 30)
Runs Per Game — 4.86 (7 of 30)
Projected Run Total — 4.16 (18 of 30)
Projected Lineup
| # | Player | Bats | wOBA vs. RHP | ISO vs. RHP | HC% vs. RHP | wOBA L14 | FD Position | FD Salary | DK Position | DK Salary |
|---|---|---|---|---|---|---|---|---|---|---|
| 1 | Jose Bautista | RIGHT | 0.377 | 0.266 | 37.1% | 0.341 | OF | $3,800 | OF | $4,000 |
| 2 | Josh Donaldson | RIGHT | 0.396 | 0.265 | 37.9% | 0.478 | 3B | $4,100 | 3B | $4,500 |
| 3 | Edwin Encarnacion | RIGHT | 0.389 | 0.285 | 36.5% | 0.325 | 1B | $4,100 | 1B | $3,900 |
| 4 | Russell Martin | RIGHT | 0.328 | 0.198 | 30.6% | 0.324 | C | $3,000 | C | $3,100 |
| 5 | Troy Tulowitzki | RIGHT | 0.323 | 0.178 | 34.6% | 0.295 | SS | $2,900 | SS | $3,600 |
| 6 | Michael Saunders | LEFT | 0.335 | 0.199 | 36.9% | 0.364 | OF | $3,000 | OF | $3,400 |
| 7 | Melvin Upton | RIGHT | 0.291 | 0.149 | 32.1% | 0.326 | OF | $3,300 | OF | $3,000 |
| 8 | Kevin Pillar | RIGHT | 0.302 | 0.125 | 25.6% | 0.358 | OF | $2,800 | OF | $2,800 |
| 9 | Devon Travis | RIGHT | 0.357 | 0.183 | 28.1% | 0.274 | 2B | $3,200 | 2B | $3,300 |
| Team Averages | — | 0.344 | 0.205 | 33.3% | 0.343 | — | — | — | — |
Elite Plays – Edwin Encarnacion
Secondary Plays – Jose Bautista, Josh Donaldson, Russell Martin
Stackability – YELLOW
Baltimore at Detroit – 7:08 PM ET
| Baltimore | Detroit | ||||||||
 | Kevin Gausman |  | Michael Fulmer | ||||||
| RIGHT | RIGHT | ||||||||
| Vegas Moneyline | Vegas Over/Under | ||||||||
| DET -115 | 8.5 | ||||||||
| Stats | wOBA | HR All. | HC% | K% | Stats | wOBA | HR All. | HC% | K% |
|---|---|---|---|---|---|---|---|---|---|
| SP vs. Left (2015-16) | 0.279 | 12 | 28.9% | 25.3% | SP vs. Left (2015-16) | 0.272 | 6 | 29.8% | 16.4% |
| SP vs. Right (2015-16) | 0.358 | 28 | 30.1% | 21.0% | SP vs. Right (2015-16) | 0.285 | 8 | 31.4% | 24.4% |
Pitcher Grind Down
| Kevin Gausman | ||||||||||
 | FanDuel | DraftKings | ||||||||
| Salary: | $8,700 | Salary: | $9,600 | |||||||
| FPPG: | 31.7 | FPPG: | 16.9 | |||||||
| Pitcher Rating: | 61.7 | Pitcher Rank: | 13 | |||||||
| Statistics | Starts | PitchPS | SIERA | ERA | K% | BB% | SS% | GB% | FB% | HC% |
|---|---|---|---|---|---|---|---|---|---|---|
| L30 Days | 5 | 107.2 | 3.33 | 1.82 | 29.8% | 9.1% | 11.6% | 53.4% | 28.8% | 31.5% |
| 2016 | 25 | 102.8 | 3.75 | 3.58 | 24.1% | 6.5% | 11.0% | 43.6% | 35.0% | 31.2% |
| 2015 | 17 | 110.4 | 3.69 | 4.25 | 21.9% | 6.2% | 10.9% | 44.4% | 38.1% | 27.4% |
Home:—ERA: 2.24 — K%: 22.7% — wOBA Allowed: 0.275
Away:—ERA: 5.39 — K%: 23.5% — wOBA Allowed: 0.357
Gausman is one of the few pitchers that we should almost automatically look to avoid when he is pitching on the road. There are obviously some exceptions, but a matchup against the Tigers in Detroit isn’t one of them. In the last two seasons, Gausman has a 5.39 ERA on the road with a .357 wOBA allowed. He is also a reverse-splits pitcher, which plays right into the hands of the right-handed heavy Tigers’ offense.
| Michael Fulmer | ||||||||||
 | FanDuel | DraftKings | ||||||||
| Salary: | $8,300 | Salary: | $8,000 | |||||||
| FPPG: | 33.6 | FPPG: | 18.2 | |||||||
| Pitcher Rating: | 69.1 | Pitcher Rank: | 10 | |||||||
| Statistics | Starts | PitchPS | SIERA | ERA | K% | BB% | SS% | GB% | FB% | HC% |
|---|---|---|---|---|---|---|---|---|---|---|
| L30 Days | 4 | 96.5 | 4.18 | 4.21 | 16.8% | 2.8% | 9.8% | 42.7% | 32.9% | 31.0% |
| 2016 | 22 | 95.0 | 4.01 | 2.77 | 20.3% | 6.4% | 10.6% | 49.4% | 30.2% | 30.6% |
Home:—ERA: 2.95 — K%: 19.1% — wOBA Allowed: 0.281
Away:—ERA: 2.68 — K%: 20.9% — wOBA Allowed: 0.277
Fulmer has cooled off over the last month of play, posting a 4.18 SIERA with a strikeout rate of 16.8%. He has shown great command for a rookie and has basically worked up to being the number two starter in this rotation. He draws a boom or bust type of matchup tonight against the Orioles, who are ranked third in team wOBA, but 22nd in team K% against right-handed pitching this season. With two of the best offenses in baseball going at it, I have a hard time justifying either pitcher in this game.
Batter Grind Down
Baltimore
The Orioles may be a top three offense against right-handed pitching, but they come into tonight’s game with a below-average run projection. Michael Fulmer has been tough on both left and right-handed hitters, holding them under a .290 wOBA this season. Chris Davis has been heating up, but he is dealing a hand injury, which is never good for a baseball player.
- Orioles Offense (2016)
Team wOBA vs. RHP — 0.340 (3 of 30)
Team wOBA L30 Days — 0.329 (14 of 30)
Team ISO vs. RHP — 0.202 (1 of 30)
Team K% vs. RHP — 21.8% (22 of 30)
Pitches Per PA vs. RHP — 3.86 (18 of 30)
Runs Per Game — 4.75 (9 of 30)
Projected Run Total — 4.16 (19 of 30)
Projected Lineup
| # | Player | Bats | wOBA vs. RHP | ISO vs. RHP | HC% vs. RHP | wOBA L14 | FD Position | FD Salary | DK Position | DK Salary |
|---|---|---|---|---|---|---|---|---|---|---|
| 1 | Adam Jones | RIGHT | 0.345 | 0.207 | 31.9% | 0.329 | OF | $3,800 | OF | $4,300 |
| 2 | Pedro Alvarez | LEFT | 0.345 | 0.251 | 39.2% | 0.326 | 3B | $3,400 | 1B | $3,500 |
| 3 | Manny Machado | RIGHT | 0.383 | 0.251 | 35.0% | 0.406 | 3B | $4,000 | 3B/SS | $4,300 |
| 4 | Mark Trumbo | RIGHT | 0.351 | 0.230 | 34.9% | 0.368 | OF | $3,500 | OF | $4,000 |
| 5 | Chris Davis | LEFT | 0.389 | 0.319 | 43.8% | 0.418 | 1B | $3,900 | 1B | $4,200 |
| 6 | Jonathan Schoop | RIGHT | 0.352 | 0.218 | 33.1% | 0.223 | 2B | $3,300 | 2B | $3,800 |
| 7 | Matt Wieters | SWITCH | 0.318 | 0.163 | 31.6% | 0.298 | C | $2,700 | C | $3,100 |
| 8 | Jonathan Schoop | RIGHT | 0.352 | 0.218 | 33.1% | 0.223 | 2B | $3,300 | 2B | $3,800 |
| 9 | J.J. Hardy | RIGHT | 0.277 | 0.126 | 28.7% | 0.249 | SS | $2,300 | SS | $2,700 |
| Team Averages | — | 0.346 | 0.220 | 34.6% | 0.316 | — | — | — | — |
Elite Plays – NONE
Secondary Plays – Pedro Alvarez, Manny Machado, Chris Davis
Stackability – ORANGE
Detroit
The Tigers are ranked tenth or better in both team wOBA and team ISO against right-handed pitching this season. Of the two offenses in this game, I highly prefer the Tigers. In the last two seasons, Kevin Gausman has allowed a .358 wOBA and 28 home runs to right-handed hitters. This is one of the few spots where I will be actively targeting the individual righty/righty matchups.
- Tigers Offense (2016)
Team wOBA vs. RHP — 0.329 (7 of 30)
Team wOBA L30 Days — 0.329 (14 of 30)
Team ISO vs. RHP — 0.172 (10 of 30)
Team K% vs. RHP — 21.1% (18 of 30)
Pitches Per PA vs. RHP — 3.86 (16 of 30)
Runs Per Game — 4.61 (13 of 30)
Projected Run Total — 4.34 (9 of 30)
Projected Lineup
| # | Player | Bats | wOBA vs. RHP | ISO vs. RHP | HC% vs. RHP | wOBA L14 | FD Position | FD Salary | DK Position | DK Salary |
|---|---|---|---|---|---|---|---|---|---|---|
| 1 | Ian Kinsler | RIGHT | 0.335 | 0.152 | 29.3% | 0.407 | 2B | $3,800 | 2B | $3,800 |
| 2 | Cameron Maybin | RIGHT | 0.321 | 0.092 | 21.3% | 0.305 | OF | $2,900 | OF | $3,200 |
| 3 | Miguel Cabrera | RIGHT | 0.400 | 0.218 | 39.9% | 0.411 | 1B | $3,900 | 1B | $4,500 |
| 4 | Victor Martinez | SWITCH | 0.308 | 0.158 | 36.2% | 0.276 | C | $3,600 | 1B | $3,000 |
| 5 | J.D. Martinez | RIGHT | 0.384 | 0.251 | 40.4% | 0.389 | OF | $3,700 | OF | $4,000 |
| 6 | Justin Upton | RIGHT | 0.339 | 0.208 | 36.7% | 0.444 | OF | $3,000 | OF | $3,500 |
| 7 | Casey McGehee | RIGHT | 0.216 | 0.063 | 22.5% | 0.257 | 3B | $2,000 | 3B | $2,000 |
| 8 | Jarrod Saltalamacchia | SWITCH | 0.306 | 0.202 | 39.6% | 0.239 | C | $2,200 | C | $2,800 |
| 9 | Jose Iglesias | RIGHT | 0.275 | 0.054 | 14.7% | 0.255 | SS | $2,400 | SS | $2,000 |
| Team Averages | — | 0.320 | 0.155 | 31.2% | 0.331 | — | — | — | — |