MLB Grind Down: Saturday, May 13th

Jump to Page 1 2 3
The RotoGrinders MLB Grind Down will give you an in-depth analysis into the upcoming MLB schedule. This article will break down the numbers for every single game and give you analysis on which trends you can exploit. While matchups are a major factor in daily fantasy baseball, there are plenty of other factors to consider such as injuries, weather, and salaries.
The analysis should point you in the right direction, but it is still up to you to decipher the information and make your own selections. No sport has more variance than baseball. The best choice is not always the right choice but following the trends will win you money over time.
Note: As always, if you want to try a new DFS site, be sure to click through a RotoGrinders link and use our DraftKings promo code, FanDuel promo code, and FantasyDraft promo code to receive the best perks in the industry.
Stackability Rating System:
GREEN – A viable full stack in cash games and GPPs.
YELLOW – A viable mini-stack in cash games and full stack in GPPs.
ORANGE – A viable stack in large field GPPs.
RED – Not a recommended stack for cash games or GPPs.
Boston at Minnesota – 2:10 PM ET
| Boston | Minnesota | ||||||||||
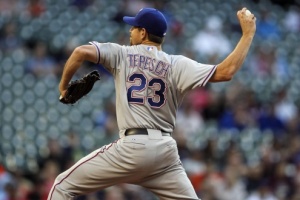
 | Rick Porcello |  | Nick Tepesch | ||||||||
| RIGHT | RIGHT | ||||||||||
| Vegas Moneyline | Vegas Over/Under | ||||||||||
| BOS-146 | 9.0 | ||||||||||
| Stats | wOBA | HC% | BB% | K% | GB% | Stats | wOBA | HC% | BB% | K% | GB% |
|---|---|---|---|---|---|---|---|---|---|---|---|
| SP vs. Left (2016-17) | 0.267 | 32.8% | 4.0% | 21.5% | 40.4% | SP vs. Left (2016-17) | 0.424 | 60.0% | 0.0% | 0.0% | 20.0% |
| SP vs. Right (2016-17) | 0.298 | 30.0% | 3.8% | 21.8% | 45.5% | SP vs. Right (2016-17) | 0.421 | 18.2% | 0.0% | 21.4% | 27.3% |
Pitcher Grind Down
| Rick Porcello | |||||||||
 | FanDuel | DraftKings | FantasyDraft | ||||||
| Salary: | $9,200 | Salary: | $11,000 | Salary: | |||||
| Salary Rank: | 3 of 30 | Salary Rank: | 3 of 30 | Salary Rank: | of 30 | ||||
| Stats | Starts | SIERA | ERA | K% | BB% | GB% | HC% | SC% | |
|---|---|---|---|---|---|---|---|---|---|
| 2016 | 33 | 3.78 | 3.15 | 21.2% | 3.6% | 43.1% | 30.0% | 16.9% | |
| 2017 | 6 | 3.56 | 4.46 | 24.1% | 5.6% | 42.1% | 39.5% | 19.3% | |
We have a total of 12 games on the schedule today, however just three are part of the afternoon slate. We’ll quickly run through the options on the early slate and then move on to the late. Rick Porcello is currently pitching at about the same level he did last season. That doesn’t mean he’s going to win the Cy Young again (don’t get me started). Porcello is sporting a 3.56 ERA with a 24.1% K rate. He’s not the worst option on the board but he certainly isn’t worth his current price tag. The Twins have the fourth best wOBA in the league against RH pitching at .342 with a 21.3% K rate.
Quick Breakdown: – Porcello would be a fine option if it were not for his elevated price tag. He’s a tournament option at best on the three-game early slate.
| Nick Tepesch | |||||||||
 | FanDuel | DraftKings | FantasyDraft | ||||||
| Salary: | $5,500 | Salary: | $5,000 | Salary: | |||||
| Salary Rank: | 28 of 30 | Salary Rank: | 27 of 30 | Salary Rank: | of 30 | ||||
| Stats | Starts | SIERA | ERA | K% | BB% | GB% | HC% | SC% | |
|---|---|---|---|---|---|---|---|---|---|
| 2016 | 1 | 4.53 | 11.25 | 15.8% | 0.0% | 25.0% | 31.3% | 12.5% | |
Nick Tepesch made just one start last season and it was not good by any means. Prior to that he hadn’t pitched in the major leagues since 2014. Even way back then he wasn’t good with a .319 wOBA against LH hitters and .370 wOBA against RH hitters. The Red Sox have the lowest K% in the league against RH pitching at 16.6%. Even as the cheapest pitcher on the board, Nick Tepesch is not in play here.
Quick Breakdown: – We can safely avoid Tepesch today, but stacking against him is an option.
Batter Grind Down
Boston
Nick Tepesch doesn’t do anything particularly well. His career wOBA versus RH and LH hitters is nearly equal. We can target batters from either side of the plate here. That starts with Andrew Benintendi (.392 wOBA) and Mookie Betts (.386 wOBA) who both smash RH pitching. To be honest, just about anyone who makes the lineup here is in play other than the fringe guys like Josh Rutledge.
Projected Lineup (Splits vs. RH Pitching)
| # | Player | Bats | wOBA | ISO | HC% | BB% | K% | GB% | FD Pos. | FD Sal. | DK Pos. | DK Sal. | FDRFT Pos. | FDRFT Sal. |
|---|---|---|---|---|---|---|---|---|---|---|---|---|---|---|
| 1 | Dustin Pedroia | RIGHT | 0.348 | 0.121 | 33.6% | 7.5% | 9.8% | 50.7% | 2B | $3,100 | 2B | $4,300 | ||
| 2 | Andrew Benintendi | LEFT | 0.393 | 0.203 | 37.6% | 7.9% | 15.3% | 34.6% | OF | $3,700 | OF | $4,700 | ||
| 3 | Mookie Betts | RIGHT | 0.386 | 0.202 | 33.8% | 7.4% | 10.7% | 41.8% | OF | $3,900 | OF | $5,500 | ||
| 4 | Hanley Ramirez | RIGHT | 0.344 | 0.192 | 37.8% | 9.1% | 19.2% | 48.7% | 1B | $3,800 | 1B/OF | $5,000 | ||
| 5 | Xander Bogaerts | RIGHT | 0.340 | 0.136 | 28.6% | 7.1% | 16.5% | 48.0% | SS | $3,500 | SS | $4,700 | ||
| 6 | Mitch Moreland | LEFT | 0.308 | 0.190 | 38.8% | 7.9% | 22.2% | 39.6% | 1B | $3,200 | 1B | $3,900 | ||
| 7 | Josh Rutledge | RIGHT | 0.257 | 0.105 | 27.3% | 7.1% | 40.5% | 71.4% | 3B | $2,300 | 2B/3B | $2,900 | ||
| 8 | Jackie Bradley Jr. | LEFT | 0.361 | 0.242 | 38.8% | 10.6% | 21.8% | 46.6% | OF | $2,900 | OF | $4,400 | ||
| 9 | Sandy Leon | SWITCH | 0.295 | 0.122 | 33.3% | 5.8% | 26.3% | 44.5% | C | $2,100 | C | $3,100 |
Elite Plays – Andrew Benintendi and Mookie Betts
Secondary Plays – Dustin Pedroia, Hanley Ramirez and Xander Bogarts
Stackability – GREEN – A viable full stack in cash games and GPPs.
Minnesota
While I’m not rostering Rick Porcello, I’m not going out of my way to stack against him either. He’s a pretty decent real life pitcher. The one knock against him this year is that he’s allowing hard contact at 39.5%. I wouldn’t mind taking a shot on a guy like Miguel Sano who is generating hard contact at 43% right now. That’s probably as far as I would take it.
Projected Lineup (Splits vs. RH Pitching)
| # | Player | Bats | wOBA | ISO | HC% | BB% | K% | GB% | FD Pos. | FD Sal. | DK Pos. | DK Sal. | FDRFT Pos. | FDRFT Sal. |
|---|---|---|---|---|---|---|---|---|---|---|---|---|---|---|
| 1 | Brian Dozier | RIGHT | 0.358 | 0.254 | 33.4% | 8.8% | 19.3% | 39.4% | 2B | $4,100 | 2B | $4,800 | ||
| 2 | Joe Mauer | LEFT | 0.334 | 0.131 | 32.9% | 14.3% | 14.1% | 47.4% | 1B | $2,800 | 1B | $3,700 | ||
| 3 | Miguel Sano | RIGHT | 0.356 | 0.248 | 43.0% | 12.0% | 36.3% | 32.8% | 3B | $3,800 | 3B | $4,500 | ||
| 4 | Max Kepler | LEFT | 0.346 | 0.212 | 34.6% | 10.9% | 18.3% | 44.3% | OF | $3,500 | OF | $3,800 | ||
| 5 | Robbie Grossman | SWITCH | 0.331 | 0.118 | 29.8% | 16.7% | 25.2% | 39.1% | OF | $2,700 | OF | $3,600 | ||
| 6 | Jason Castro | LEFT | 0.324 | 0.198 | 37.0% | 13.0% | 32.5% | 42.4% | C | $2,500 | C | $2,900 | ||
| 7 | Jorge Polanco | SWITCH | 0.303 | 0.106 | 23.5% | 8.3% | 13.5% | 35.2% | SS | $2,700 | SS | $3,400 | ||
| 8 | Eddie Rosario | LEFT | 0.322 | 0.182 | 33.1% | 3.3% | 23.8% | 45.8% | OF | $2,600 | OF | $3,500 | ||
| 9 | Byron Buxton | RIGHT | 0.291 | 0.184 | 24.1% | 6.4% | 36.2% | 36.6% | OF | $2,700 | OF | $3,500 |
Elite Plays – None
Secondary Plays – Miguel Sano
Stackability – ORANGE – A viable stack in large field GPPs.
Toronto at Tampa Bay – 4:10 PM ET
| Toronto | Tampa Bay | ||||||||||
 | Marco Estrada |  | Jake Odorizzi | ||||||||
| RIGHT | RIGHT | ||||||||||
| Vegas Moneyline | Vegas Over/Under | ||||||||||
| TB -114 | 8.0 | ||||||||||
| Stats | wOBA | HC% | BB% | K% | GB% | Stats | wOBA | HC% | BB% | K% | GB% |
|---|---|---|---|---|---|---|---|---|---|---|---|
| SP vs. Left (2016-17) | 0.265 | 26.1% | 8.7% | 22.9% | 36.3% | SP vs. Left (2016-17) | 0.265 | 32.0% | 6.9% | 26.0% | 38.5% |
| SP vs. Right (2016-17) | 0.298 | 34.8% | 8.5% | 23.5% | 32.3% | SP vs. Right (2016-17) | 0.333 | 34.4% | 6.8% | 18.1% | 35.1% |
Pitcher Grind Down
| Marco Estrada | |||||||||
 | FanDuel | DraftKings | FantasyDraft | ||||||
| Salary: | $9,000 | Salary: | $10,000 | Salary: | |||||
| Salary Rank: | 4 of 30 | Salary Rank: | 4 of 30 | Salary Rank: | of 30 | ||||
| Stats | Starts | SIERA | ERA | K% | BB% | GB% | HC% | SC% | |
|---|---|---|---|---|---|---|---|---|---|
| 2016 | 29 | 4.35 | 3.48 | 22.8% | 9.0% | 33.5% | 31.3% | 21.1% | |
| 2017 | 6 | 3.62 | 2.43 | 25.2% | 6.6% | 38.4% | 25.7% | 13.9% | |
I continue to be amazed by how Marco Estrada gets away with so many fly balls. He’s hovered around 48% for his career. His wOBA against LH (.296) nearly matches his .303 wOBA against RH. Estrada is actually pitching decently well this season with a 2.43 ERA and a 25.2% K rate. The Rays are a decent a matchup here as they rank second against right-handed pitching with a 25.4% K rate. They also don’t feature a lot of power with a .172 ISO.
Quick Breakdown: – Estrada is one of three options that make sense on the early slate. Odorizzi is my top choice followed by Estrada, then Porcello.
| Jake Odorizzi | |||||||||
 | FanDuel | DraftKings | FantasyDraft | ||||||
| Salary: | $7,500 | Salary: | $7,900 | Salary: | |||||
| Salary Rank: | 12 of 30 | Salary Rank: | 10 of 30 | Salary Rank: | of 30 | ||||
| Stats | Starts | SIERA | ERA | K% | BB% | GB% | HC% | SC% | |
|---|---|---|---|---|---|---|---|---|---|
| 2016 | 33 | 4.21 | 3.69 | 21.5% | 7.0% | 36.6% | 33.7% | 16.8% | |
| 2017 | 4 | 4.14 | 3.50 | 20.0% | 5.7% | 33.3% | 31.4% | 9.8% | |
Jake Odorizzi is not off to a great start this year. He’s sporting a 4.14 SIERA and just a 20% K rate. The good news is that he draws a matchup against a Blue Jays team that isn’t all that great right now. They are ninth in K% at 22.7% and own an 81 wRC+. As a reminder, wRC+ is a park-adjusted metric that rates an offense’s ability to generate runs. A score of 100 is supposed to be average. This offense is about 20% below average at generating runs.
Quick Breakdown: – Odorizzi’s poor start has his price way down. He’s my top option on the early three-game slate. He should be able to handle a Blue Jays offense that has gotten things going lately but still isn’t one to be feared.
Batter Grind Down
Toronto
The Jays are not the best offense to target on this slate. Even a struggling Odorizzi is still a really good pitcher. He does have some drastic splits with a .267 wOBA against LH and .333 wOBA against RH hitters. I suppose that puts Jose Bautista and Russell Martin in play as they both hit RH pitching decently well. Some of that is based on their career numbers though and not what they are doing right now. Bautista is striking out over 30% of the time this season. I’m probably not going here myself.
Projected Lineup (Splits vs. RH Pitching)
| # | Player | Bats | wOBA | ISO | HC% | BB% | K% | GB% | FD Pos. | FD Sal. | DK Pos. | DK Sal. | FDRFT Pos. | FDRFT Sal. |
|---|---|---|---|---|---|---|---|---|---|---|---|---|---|---|
| 1 | Kevin Pillar | RIGHT | 0.299 | 0.116 | 26.6% | 4.9% | 15.3% | 48.7% | OF | $3,400 | OF | $3,200 | ||
| 2 | Jose Bautista | RIGHT | 0.352 | 0.203 | 39.1% | 17.4% | 22.1% | 36.8% | OF | $3,800 | OF | $4,200 | ||
| 3 | Russell Martin | RIGHT | 0.324 | 0.169 | 29.8% | 11.6% | 27.1% | 47.8% | C | $3,100 | C | $3,600 | ||
| 4 | Kendrys Morales | SWITCH | 0.305 | 0.183 | 42.2% | 8.6% | 19.6% | 48.8% | 1B | $2,800 | 1B | $3,600 | ||
| 5 | Justin Smoak | SWITCH | 0.314 | 0.187 | 41.6% | 10.8% | 35.7% | 27.1% | 1B | $2,800 | 1B | $3,100 | ||
| 6 | Steve Pearce | RIGHT | 0.340 | 0.161 | 30.3% | 9.4% | 17.6% | 46.9% | OF | $2,800 | OF | $3,600 | ||
| 7 | Ryan Goins | LEFT | 0.250 | 0.154 | 31.5% | 6.3% | 22.8% | 49.3% | 2B | $2,500 | 2B/SS | $2,600 | ||
| 8 | Devon Travis | RIGHT | 0.326 | 0.157 | 30.7% | 5.7% | 19.7% | 46.5% | 2B | $2,200 | 2B | $3,700 | ||
| 9 | Chris Coghlan | LEFT | 0.279 | 0.137 | 28.4% | 10.6% | 25.5% | 45.8% | OF | $2,200 | 3B | $3,400 |
Elite Plays – None
Secondary Plays – None
Stackability – ORANGE – A viable stack in large field GPPs.
Tampa Bay
As JMToWin often mentions, fly ball pitchers are a great place to find a home run but stacking against them often leads to several long outs. The Rays that can hit for power are the best options here. Corey Dickerson owns a .341 wOBA against RH pitching. He’s the best option. After that, you could take a look at Evan Longoria on FD where he is cheap but I would look elsewhere (Sano) on DK.
Projected Lineup (Splits vs. RH Pitching)
| # | Player | Bats | wOBA | ISO | HC% | BB% | K% | GB% | FD Pos. | FD Sal. | DK Pos. | DK Sal. | FDRFT Pos. | FDRFT Sal. |
|---|---|---|---|---|---|---|---|---|---|---|---|---|---|---|
| 1 | Corey Dickerson | LEFT | 0.341 | 0.263 | 31.5% | 6.7% | 22.5% | 34.3% | OF | $3,100 | OF | $3,800 | ||
| 2 | Kevin Kiermaier | LEFT | 0.303 | 0.144 | 29.8% | 9.6% | 18.2% | 45.1% | OF | $2,900 | OF | $3,500 | ||
| 3 | Evan Longoria | RIGHT | 0.350 | 0.252 | 36.9% | 6.2% | 21.4% | 32.9% | 3B | $2,800 | 3B | $4,200 | ||
| 4 | Brad Miller | LEFT | 0.339 | 0.239 | 36.1% | 9.9% | 24.9% | 45.9% | SS | $3,300 | 2B | $3,700 | ||
| 5 | Logan Morrison | LEFT | 0.330 | 0.205 | 36.7% | 9.8% | 21.5% | 42.7% | 1B | $2,800 | 1B | $3,300 | ||
| 6 | Steve Souza | RIGHT | 0.331 | 0.174 | 31.0% | 8.0% | 31.4% | 40.7% | OF | $3,300 | OF | $3,900 | ||
| 7 | Tim Beckham | RIGHT | 0.306 | 0.213 | 42.5% | 4.3% | 30.8% | 41.9% | SS | $3,100 | SS | $3,300 | ||
| 8 | Colby Rasmus | LEFT | 0.304 | 0.163 | 35.7% | 10.7% | 28.4% | 36.8% | OF | $2,200 | OF | $3,400 | ||
| 9 | Derek Norris | RIGHT | 0.242 | 0.138 | 31.8% | 6.5% | 32.5% | 33.5% | C | $2,500 | C | $2,800 |
Elite Plays – Corey Dickerson
Secondary Plays – Evan Longoria
Stackability – YELLOW – A viable mini-stack in cash games and full stack in GPPs.
Cleveland at Kansas City – 4:15 PM ET
| Cleveland | Kansas City | ||||||||||
 | Josh Tomlin |  | Jason Vargas | ||||||||
| RIGHT | LEFT | ||||||||||
| Vegas Moneyline | Vegas Over/Under | ||||||||||
| CLE-106 | 8.0 | ||||||||||
| Stats | wOBA | HC% | BB% | K% | GB% | Stats | wOBA | HC% | BB% | K% | GB% |
|---|---|---|---|---|---|---|---|---|---|---|---|
| SP vs. Left (2016-17) | 0.293 | 37.2% | 2.5% | 14.9% | 48.4% | SP vs. Left (2016-17) | 0.283 | 23.8% | 0.0% | 12.5% | 42.9% |
| SP vs. Right (2016-17) | 0.367 | 32.2% | 2.9% | 17.1% | 42.2% | SP vs. Right (2016-17) | 0.229 | 28.7% | 5.5% | 25.3% | 40.0% |
Pitcher Grind Down
| Josh Tomlin | |||||||||
 | FanDuel | DraftKings | FantasyDraft | ||||||
| Salary: | $7,200 | Salary: | $7,700 | Salary: | |||||
| Salary Rank: | 15 of 30 | Salary Rank: | 11 of 30 | Salary Rank: | of 30 | ||||
| Stats | Starts | SIERA | ERA | K% | BB% | GB% | HC% | SC% | |
|---|---|---|---|---|---|---|---|---|---|
| 2016 | 29 | 4.24 | 4.40 | 16.3% | 2.8% | 43.8% | 33.9% | 16.4% | |
| 2017 | 5 | 3.64 | 8.87 | 15.6% | 2.8% | 52.9% | 37.5% | 8.0% | |
The final game of the early slate features an over/under of 8 with Jason Vargas against Josh Tomlin. Through five starts this season Josh Tomlin has an 8.87 ERA. His SIERA of 3.64 says he’s been unlucky. Tomlin has great control with a 2.8% walk rate. For our purposes though, we probably aren’t interested here as he also owns a K rate of just 15.6% this year. The Royals are not a great offense against RH pitching with a 77 wRC+ and a .286 wOBA though.
Quick Breakdown: – Tomlin probably isn’t going to get blown up in this spot. His ground ball rate of 52.9% tells us that. He doesn’t really have any upside though without the ability to strikeout many batters.
| Jason Vargas | |||||||||
 | FanDuel | DraftKings | FantasyDraft | ||||||
| Salary: | $8,500 | Salary: | $7,600 | Salary: | |||||
| Salary Rank: | 6 of 30 | Salary Rank: | 12 of 30 | Salary Rank: | of 30 | ||||
| Stats | Starts | SIERA | ERA | K% | BB% | GB% | HC% | SC% | |
|---|---|---|---|---|---|---|---|---|---|
| 2016 | 3 | 3.96 | 2.25 | 23.4% | 6.4% | 36.4% | 33.3% | 15.2% | |
| 2017 | 5 | 3.43 | 1.42 | 23.6% | 4.1% | 42.0% | 25.8% | 18.0% | |
Jason Vargas gets a similar recommendation to Tomlin. He’s pitching well this season with a 1.42 ERA, 23.6% K rate and 4.1% BB rate. He also doesn’t allow a lot of hard contact at just 25.8%. With that said, he doesn’t draw the best matchup. The Indians have a 19.2% K rate against LH pitching this season. They haven’t hit all that well with a .283 wOBA but there are plenty of bats in this lineup that can get the job done.
Quick Breakdown: – The safest options in the early slate are Odorizzi, Estrada and Porcello. You’re taking on quite a bit of risk if you decide to go anywhere else.
Batter Grind Down
Cleveland
There are several Indians that hit LH pitching well including Francisco Lindor, Edwin Encarnacion and Jose Ramirez. They grade out as somewhat mediocre options here though. The biggest problem for the Indians is they are price too close to the Red Sox and other bats that are in a better spot. You could certainly get away with using a couple here on a three-game slate though.
Projected Lineup (Splits vs. LH Pitching)
| # | Player | Bats | wOBA | ISO | HC% | BB% | K% | GB% | FD Pos. | FD Sal. | DK Pos. | DK Sal. | FDRFT Pos. | FDRFT Sal. |
|---|---|---|---|---|---|---|---|---|---|---|---|---|---|---|
| 1 | Carlos Santana | SWITCH | 0.304 | 0.120 | 29.6% | 11.0% | 8.9% | 55.6% | 1B | $3,800 | 1B | $4,500 | ||
| 2 | Francisco Lindor | SWITCH | 0.329 | 0.138 | 30.8% | 7.0% | 15.1% | 47.1% | SS | $4,100 | SS | $4,900 | ||
| 3 | Michael Brantley | LEFT | 0.320 | 0.135 | 40.7% | 9.5% | 26.2% | 40.7% | OF | $4,000 | OF | $5,000 | ||
| 4 | Edwin Encarnacion | RIGHT | 0.362 | 0.214 | 40.9% | 19.0% | 22.6% | 38.2% | 1B | $3,100 | 1B | $4,700 | ||
| 5 | Jose Ramirez | SWITCH | 0.356 | 0.163 | 34.3% | 7.9% | 13.5% | 41.2% | 3B | $4,000 | 2B/3B | $4,600 | ||
| 6 | Jason Kipnis | LEFT | 0.320 | 0.168 | 28.2% | 6.0% | 25.3% | 43.3% | 2B | $2,800 | 2B | $4,400 | ||
| 7 | Brandon Guyer | RIGHT | 0.385 | 0.191 | 28.7% | 4.7% | 13.5% | 36.0% | OF | $2,100 | OF | $3,300 | ||
| 8 | Abraham Almonte | SWITCH | 0.301 | 0.143 | 27.0% | 6.5% | 23.9% | 54.8% | OF | $2,700 | OF | $3,400 | ||
| 9 | Yan Gomes | RIGHT | 0.339 | 0.176 | 26.2% | 6.4% | 23.4% | 42.2% | C | $2,600 | C | $3,100 |
Elite Plays – None
Secondary Plays – Francisco Lindor and Edwin Encarnacion
Stackability – YELLOW – A viable mini-stack in cash games and full stack in GPPs.
Kansas City
The Royals have not been a very great offense but Josh Tomlin does have some really drastic splits. He has a .367 wOBA against RH hitting compared .293 against LH. Salvador Perez is the best option here as he hits RH pitching with a .313 wOBA. Even with Tomlin’s reverse splits, you could get away with Mike Moustakas here as well.
Projected Lineup (Splits vs. RH Pitching)
| # | Player | Bats | wOBA | ISO | HC% | BB% | K% | GB% | FD Pos. | FD Sal. | DK Pos. | DK Sal. | FDRFT Pos. | FDRFT Sal. |
|---|---|---|---|---|---|---|---|---|---|---|---|---|---|---|
| 1 | Whit Merrifield | RIGHT | 0.288 | 0.110 | 32.1% | 5.0% | 20.3% | 44.4% | 2B | $2,700 | 2B/OF | $3,600 | ||
| 2 | Mike Moustakas | LEFT | 0.362 | 0.286 | 35.8% | 7.2% | 12.0% | 36.6% | 3B | $3,400 | 3B | $4,000 | ||
| 3 | Lorenzo Cain | RIGHT | 0.307 | 0.093 | 27.5% | 7.5% | 21.1% | 50.5% | OF | $3,600 | OF | $4,100 | ||
| 4 | Eric Hosmer | LEFT | 0.343 | 0.165 | 35.6% | 9.7% | 18.5% | 57.8% | 1B | $3,000 | 1B | $4,100 | ||
| 5 | Salvador Perez | RIGHT | 0.313 | 0.198 | 36.0% | 3.1% | 20.7% | 34.8% | C | $2,900 | C | $3,700 | ||
| 6 | Alex Gordon | LEFT | 0.298 | 0.151 | 35.8% | 9.8% | 27.5% | 38.3% | OF | $2,700 | OF | $3,800 | ||
| 7 | Jorge Bonifacio | RIGHT | 0.377 | 0.240 | 26.3% | 10.7% | 21.4% | 36.8% | OF | $2,400 | OF | $3,200 | ||
| 8 | Brandon Moss | LEFT | 0.324 | 0.275 | 39.8% | 9.9% | 30.3% | 25.6% | 1B | $2,700 | OF | $3,500 | ||
| 9 | Alcides Escobar | RIGHT | 0.274 | 0.083 | 20.6% | 3.7% | 15.1% | 47.7% | SS | $2,300 | SS | $3,400 |
Elite Plays – Salvador Perez
Secondary Plays – Mike Moustakas
Stackability – YELLOW – A viable mini-stack in cash games and full stack in GPPs.
Washington at Philadelphia – 7:05 PM ET
| Washington | Philadelphia | ||||||||||
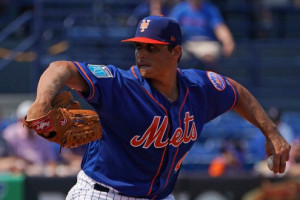
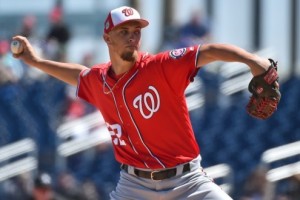
 | A.J. Cole |  | Vince Velasquez | ||||||||
| RIGHT | RIGHT | ||||||||||
| Vegas Moneyline | Vegas Over/Under | ||||||||||
| PHI-105 | 8.5 | ||||||||||
| Stats | wOBA | HC% | BB% | K% | GB% | Stats | wOBA | HC% | BB% | K% | GB% |
|---|---|---|---|---|---|---|---|---|---|---|---|
| SP vs. Left (2016-17) | 0.331 | 25.0% | 9.8% | 23.9% | 31.7% | SP vs. Left (2016-17) | 0.343 | 32.7% | 10.8% | 25.6% | 37.1% |
| SP vs. Right (2016-17) | 0.325 | 26.4% | 6.6% | 22.4% | 32.1% | SP vs. Right (2016-17) | 0.322 | 32.2% | 7.1% | 28.0% | 36.8% |
Pitcher Grind Down
| A.J. Cole | |||||||||
 | FanDuel | DraftKings | FantasyDraft | ||||||
| Salary: | $5,700 | Salary: | $5,400 | Salary: | $10,800 | ||||
| Salary Rank: | 26 of 30 | Salary Rank: | 25 of 30 | Salary Rank: | 20 of 30 | ||||
| Stats | Starts | SIERA | ERA | K% | BB% | GB% | HC% | SC% | |
|---|---|---|---|---|---|---|---|---|---|
| 2016 | 8 | 4.33 | 5.17 | 23.2% | 8.3% | 31.9% | 25.7% | 18.6% | |
The first game of the late slate features A.J. Cole against Vincent Velasquez. This slate features both Clayton Kershaw and a game at Coors field. A.J. Cole had a .331 wOBA against LH hitting and a .325 wOBA against RH last season. He’s mildly interesting here as a SP2 because of the matchup. The Phillies rank 7th with a 24.1% K rate against RH pitching. Cole had a 23.2% K rate last season in eight starts.
Quick Breakdown: – Even though Cole is just making a spot start here he’s interesting as an SP2. He already owns a respectable K% and the Phillies offense can help somewhat in that department. You could certainly do a lot worse at SP2 on DraftKings tonight.
| Vince Velasquez | |||||||||
 | FanDuel | DraftKings | FantasyDraft | ||||||
| Salary: | $7,400 | Salary: | $8,100 | Salary: | $15,600 | ||||
| Salary Rank: | 13 of 30 | Salary Rank: | 9 of 30 | Salary Rank: | 7 of 30 | ||||
| Stats | Starts | SIERA | ERA | K% | BB% | GB% | HC% | SC% | |
|---|---|---|---|---|---|---|---|---|---|
| 2016 | 24 | 3.62 | 4.12 | 27.6% | 8.2% | 34.8% | 32.6% | 18.4% | |
| 2017 | 5 | 4.59 | 5.47 | 22.6% | 13.0% | 47.2% | 31.9% | 13.9% | |
Vincent Velasquez had a .343 wOBA against LH and a .322 wOBA against RH last season. He takes on a Nationals offense that has the second-best wOBA against RH pitching at .358. Velasquez hasn’t been all that great this season generating soft contact at just 13.2%. With Velasquez’ strikeout numbers down this season and a tough matchup against the Nationals, he’s easy to avoid tonight.
Quick Breakdown: – Velasquez might be a better pitcher than his current season numbers show but the matchup here tells us to look somewhere else.
Batter Grind Down
Washington
There are plenty of National hitters that smash RH pitching. That starts with Trea Turner who owns a .411 wOBA against RH pitching. With that said, there’s a game at Coors Field tonight. I don’t see any reason to go out of the way to stack Nationals tonight.
Projected Lineup (Splits vs. RH Pitching)
| # | Player | Bats | wOBA | ISO | HC% | BB% | K% | GB% | FD Pos. | FD Sal. | DK Pos. | DK Sal. | FDRFT Pos. | FDRFT Sal. |
|---|---|---|---|---|---|---|---|---|---|---|---|---|---|---|
| 1 | Trea Turner | RIGHT | 0.411 | 0.260 | 34.4% | 5.0% | 18.2% | 43.2% | SS | $4,200 | SS | $4,900 | IF/OF | $9,600 |
| 2 | Jayson Werth | RIGHT | 0.298 | 0.133 | 31.9% | 11.0% | 24.8% | 42.3% | OF | $3,100 | OF | $3,600 | LF | $7,200 |
| 3 | Bryce Harper | LEFT | 0.379 | 0.231 | 35.5% | 19.2% | 15.6% | 39.3% | OF | $5,000 | OF | $5,200 | RF | $10,000 |
| 4 | Ryan Zimmerman | RIGHT | 0.317 | 0.185 | 35.1% | 5.1% | 24.0% | 45.3% | 1B | $4,400 | 1B | $4,400 | 1B | $8,700 |
| 5 | Daniel Murphy | LEFT | 0.416 | 0.255 | 39.0% | 6.0% | 9.5% | 35.5% | 2B | $4,100 | 2B | $4,600 | 2B | $8,800 |
| 6 | Anthony Rendon | RIGHT | 0.333 | 0.173 | 34.6% | 8.7% | 18.7% | 37.9% | 3B | $3,000 | 3B | $4,000 | 3B | $7,600 |
| 7 | Michael Taylor | RIGHT | 0.254 | 0.107 | 31.9% | 5.5% | 29.8% | 43.9% | OF | $3,200 | OF | $3,500 | CF | $6,800 |
| 8 | Matt Wieters | SWITCH | 0.321 | 0.180 | 32.5% | 7.3% | 17.4% | 37.3% | C | $2,900 | C | $3,200 | C | $6,300 |
| 9 | A.J. Cole | RIGHT | 0.000 | 0.000 | 0.0% | 0.0% | 40.0% | 100.0% | P | $5,700 | P | $5,400 | P | $10,800 |
Elite Plays – None
Secondary Plays – Trea Turner
Stackability – ORANGE – A viable stack in large field GPPs.
Philadelphia
The Phillies get to take on a career minor leaguer in A.J. Cole but his numbers say he’s not a terrible pitcher. You could certainly use a Philly value bat or two here but there isn’t anyone that screams start me.
Projected Lineup (Splits vs. RH Pitching)
| # | Player | Bats | wOBA | ISO | HC% | BB% | K% | GB% | FD Pos. | FD Sal. | DK Pos. | DK Sal. | FDRFT Pos. | FDRFT Sal. |
|---|---|---|---|---|---|---|---|---|---|---|---|---|---|---|
| 1 | Cesar Hernandez | SWITCH | 0.339 | 0.119 | 26.5% | 11.0% | 19.3% | 52.6% | 2B | $3,500 | 2B | $3,400 | 2B | $6,600 |
| 2 | Aaron Altherr | RIGHT | 0.278 | 0.104 | 30.3% | 9.1% | 32.4% | 50.8% | OF | $3,500 | OF | $3,500 | RF | $6,900 |
| 3 | Odubel Herrera | LEFT | 0.349 | 0.157 | 29.0% | 9.4% | 20.4% | 43.0% | OF | $3,700 | OF | $3,500 | IF/OF | $6,800 |
| 4 | Maikel Franco | RIGHT | 0.296 | 0.153 | 29.9% | 6.8% | 16.0% | 44.0% | 3B | $3,600 | 3B | $4,100 | 3B | $8,100 |
| 5 | Michael Saunders | LEFT | 0.331 | 0.197 | 38.1% | 10.2% | 27.3% | 39.4% | OF | $2,800 | OF | $3,600 | RF | $7,200 |
| 6 | Tommy Joseph | RIGHT | 0.313 | 0.209 | 37.0% | 5.3% | 23.5% | 41.7% | 1B | $2,800 | 1B | $3,700 | 1B | $7,200 |
| 7 | Cameron Rupp | RIGHT | 0.302 | 0.171 | 33.2% | 6.8% | 28.0% | 47.4% | C | $2,700 | C | $3,200 | C | $6,400 |
| 8 | Freddy Galvis | SWITCH | 0.304 | 0.181 | 28.1% | 4.6% | 22.0% | 39.9% | SS | $2,800 | SS | $3,400 | SS | $6,600 |
| 9 | Vince Velasquez | RIGHT | 0.166 | 0.000 | 8.0% | 2.6% | 33.3% | 68.2% | P | $7,400 | P | $8,100 | P | $15,600 |
Elite Plays – None
Secondary Plays – None
Stackability -%{color:orange}*ORANGE*% – A viable stack in large field GPPs.
Milwaukee at Pittsburgh – 7:05 PM ET
| Milwaukee | Pittsburgh | ||||||||||
 | Matt Garza |  | Gerrit Cole | ||||||||
| RIGHT | RIGHT | ||||||||||
| Vegas Moneyline | Vegas Over/Under | ||||||||||
| PIT-156 | 8.0 | ||||||||||
| Stats | wOBA | HC% | BB% | K% | GB% | Stats | wOBA | HC% | BB% | K% | GB% |
|---|---|---|---|---|---|---|---|---|---|---|---|
| SP vs. Left (2016-17) | 0.364 | 38.7% | 10.4% | 12.1% | 51.6% | SP vs. Left (2016-17) | 0.358 | 36.9% | 6.7% | 23.6% | 40.8% |
| SP vs. Right (2016-17) | 0.301 | 33.8% | 5.2% | 19.5% | 57.0% | SP vs. Right (2016-17) | 0.286 | 25.0% | 6.5% | 17.1% | 50.0% |
Pitcher Grind Down
| Matt Garza | |||||||||
 | FanDuel | DraftKings | FantasyDraft | ||||||
| Salary: | $7,200 | Salary: | $6,400 | Salary: | $12,800 | ||||
| Salary Rank: | 15 of 30 | Salary Rank: | 20 of 30 | Salary Rank: | 15 of 30 | ||||
| Stats | Starts | SIERA | ERA | K% | BB% | GB% | HC% | SC% | |
|---|---|---|---|---|---|---|---|---|---|
| 2016 | 19 | 4.60 | 4.51 | 15.2% | 7.8% | 54.8% | 34.9% | 19.0% | |
| 2017 | 2 | 3.45 | 3.38 | 23.9% | 6.5% | 50.0% | 50.0% | 6.3% | |
The second game of the late slate features on over/under of eight. These are two serviceable pitcher against two offenses that aren’t that great. We’ll start with Matt Garza. Last season Garza had a 54% GB rate and allowed hard contact at 34.9%. Through two starts this season, the hard contact is up to 50% while the ground balls remain about the same. The Pirates are second to last in the league in K% versus RH at 16.9% this season. They are a below average offense though with an 84 wRC+. This isn’t a spot to use Garza but it isn’t that great of a spot to pick on him either.
Quick Breakdown: – The lack of strikeouts from the Pirates along with Garza’s hard contact rate tells us we probably want to look elsewhere tonight.
| Gerrit Cole | |||||||||
 | FanDuel | DraftKings | FantasyDraft | ||||||
| Salary: | $9,500 | Salary: | $9,600 | Salary: | $18,400 | ||||
| Salary Rank: | 2 of 30 | Salary Rank: | 5 of 30 | Salary Rank: | 3 of 30 | ||||
| Stats | Starts | SIERA | ERA | K% | BB% | GB% | HC% | SC% | |
|---|---|---|---|---|---|---|---|---|---|
| 2016 | 21 | 4.24 | 3.88 | 19.4% | 7.1% | 45.6% | 30.1% | 21.3% | |
| 2017 | 6 | 3.55 | 3.50 | 23.0% | 4.7% | 46.1% | 31.8% | 22.4% | |
With someone like Gerrit Cole who struggled with injuries last season I like to look at current year stats. Cole has a 3.55 SIERA which almost matches his ERA. He has a 23% K rate and is limiting walks to 4% in six starts. The Brewers are a popular team to pick on as they own a 25% K rate against RH pitching. There are a couple of LH bats in this lineup that could give Cole some trouble but he’s still a very solid choice tonight.
Quick Breakdown: – As mid-tier options go, Gerrit Cole ranks behind Lance McCullers but he’s firmly in play tonight on both single and multi-pitcher sites.
Batter Grind Down
Milwaukee
The one thing that should concern anyone rostering Gerrit Cole is that he’s allowing 40% hard contact to LH hitters this season. That could be a problem against Eric Thames who owns a .459 wOBA and 49.1% hard contact rate against RH pitching. It is worth noting though that Thames did most of his damage this season against the Reds. He’s been mediocre against other pitching staffs. He’s priced close enough to the Coors hitters as well as others in a better spot. That makes him a secondary option.
Projected Lineup (Splits vs. RH Pitching)
| # | Player | Bats | wOBA | ISO | HC% | BB% | K% | GB% | FD Pos. | FD Sal. | DK Pos. | DK Sal. | FDRFT Pos. | FDRFT Sal. |
|---|---|---|---|---|---|---|---|---|---|---|---|---|---|---|
| 1 | Jonathan Villar | SWITCH | 0.336 | 0.151 | 35.7% | 11.1% | 26.1% | 60.6% | 2B | $3,200 | 2B | $4,100 | 2B | $8,000 |
| 2 | Eric Thames | LEFT | 0.459 | 0.366 | 49.1% | 17.2% | 20.7% | 41.5% | 1B | $4,000 | 1B | $4,600 | 1B | $9,000 |
| 3 | Ryan Braun | RIGHT | 0.367 | 0.238 | 34.6% | 7.7% | 19.8% | 55.8% | OF | $3,700 | OF | $4,500 | LF | $8,800 |
| 4 | Travis Shaw | LEFT | 0.326 | 0.193 | 34.0% | 8.5% | 23.3% | 39.1% | 3B | $3,700 | 3B | $3,500 | 3B | $6,900 |
| 5 | Hernan Perez | RIGHT | 0.306 | 0.149 | 29.7% | 5.4% | 20.2% | 48.1% | OF | $2,900 | 3B/OF | $3,200 | IF/OF | $6,400 |
| 6 | Jett Bandy | RIGHT | 0.299 | 0.154 | 26.8% | 3.8% | 17.0% | 30.9% | C | $2,800 | C | $2,500 | C | $4,800 |
| 7 | Keon Broxton | RIGHT | 0.296 | 0.153 | 36.5% | 11.8% | 36.3% | 46.0% | OF | $3,100 | OF | $3,500 | CF | $6,800 |
| 8 | Orlando Arcia | RIGHT | 0.252 | 0.140 | 23.2% | 3.9% | 23.4% | 54.2% | SS | $2,300 | SS | $3,100 | SS | $6,000 |
| 9 | Matt Garza | RIGHT | 0.126 | 0.000 | 12.5% | 10.5% | 47.4% | 100.0% | P | $7,200 | P | $6,400 | P | $12,800 |
Elite Plays – None
Secondary Plays – Eric Thames and Ryan Braun
Stackability – ORANGE – A viable stack in large field GPPs.
Pittsburgh
The way to pick on Matt Garza is with LH batters. He owns a 12.1% K rate compared to 19.5% against RH. He also has a .367 wOBA against LH. The Pirates don’t have a lot of great LH (or switch) hitters but they have a couple. Josh Bell is the best option here with a .352 wOBA against RH pitching. Assuming he’s in the lineup, I also don’t mind John Jaso on FD at almost minimum price. He has a .338 wOBA against RH pitching.
Projected Lineup (Splits vs. RH Pitching)
| # | Player | Bats | wOBA | ISO | HC% | BB% | K% | GB% | FD Pos. | FD Sal. | DK Pos. | DK Sal. | FDRFT Pos. | FDRFT Sal. |
|---|---|---|---|---|---|---|---|---|---|---|---|---|---|---|
| 1 | Josh Harrison | RIGHT | 0.295 | 0.100 | 27.1% | 3.6% | 14.3% | 44.3% | 3B | $3,400 | 2B/3B | $3,600 | 2B | $7,200 |
| 2 | John Jaso | LEFT | 0.338 | 0.151 | 30.2% | 10.5% | 17.0% | 49.1% | 1B | $2,300 | 1B/OF | $3,000 | 1B | $6,000 |
| 3 | Andrew McCutchen | RIGHT | 0.320 | 0.163 | 35.1% | 9.6% | 21.4% | 36.3% | OF | $3,800 | OF | $4,400 | RF | $8,400 |
| 4 | Gregory Polanco | LEFT | 0.327 | 0.190 | 35.3% | 9.3% | 17.1% | 39.9% | OF | $3,200 | OF | $3,900 | LF | $7,800 |
| 5 | Josh Bell | SWITCH | 0.352 | 0.152 | 32.9% | 14.4% | 14.9% | 48.9% | 1B | $2,900 | 1B | $3,200 | IF/OF | $6,400 |
| 6 | Francisco Cervelli | RIGHT | 0.303 | 0.090 | 26.5% | 13.4% | 18.6% | 54.3% | C | $2,700 | C | $3,100 | C | $6,000 |
| 7 | Jordy Mercer | RIGHT | 0.289 | 0.096 | 24.8% | 8.0% | 14.2% | 49.8% | SS | $2,700 | SS | $3,100 | SS | $6,000 |
| 8 | Alen Hanson | SWITCH | 0.258 | 0.109 | 25.0% | 4.2% | 20.8% | 50.0% | 2B | $2,200 | 2B | $3,400 | SS | $6,600 |
| 9 | Gerrit Cole | RIGHT | 0.151 | 0.000 | 4.8% | 0.0% | 43.2% | 83.3% | P | $9,500 | P | $9,600 | P | $18,400 |