MLB Grind Down: Sunday, July 24 - Page Three
LA Angels at Houston – 2:10 PM ET
| LA Angels | Houston |
 | |  | |
| RIGHT | RIGHT |
| Vegas Moneyline | Vegas Over/Under |
| HOU -200 | 9.5 |
| Stats | wOBA | HR All. | K% | BB% | Stats | wOBA | HR All. | K% | BB% |
| SP vs. Left | 0.292 | 4 | 20.3% | 8.5% | SP vs. Left | 0.303 | 17 | 20.9% | 6.3% |
| SP vs. Right | 0.423 | 9 | 16.7% | 12.9% | SP vs. Right | 0.340 | 23 | 21.3% | 8.5% |
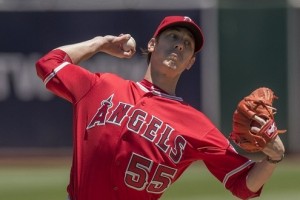
Pitcher Grind Down
| Tim Lincecum |
 | FanDuel | DraftKings |
| Salary: | $7,100 | Salary: | $6,700 |
| FPPG: | 21.8 | FPPG: | 8.2 |
| Pitcher Rating: | 43.8 | Pitcher Rank: | 25 |
| Statistics | Starts | PitchPS | SIERA | ERA | K% | BB% | SS% | GB% | FB% | HH% |
| L30 Days | 5 | 96.4 | 4.20 | 7.94 | 21.9% | 9.2% | 13.7% | 45.6% | 26.6% | 43.2% |
| 2016 | 6 | 96.7 | 4.42 | 6.59 | 19.6% | 9.1% | 12.6% | 45.9% | 26.5% | 39.0% |
| 2015 | 15 | 88.2 | 4.82 | 4.13 | 18.0% | 11.4% | 10.7% | 44.3% | 35.1% | 34.6% |
: At this point, you do not want anything to do with Lincecum. He is a guy we are looking to stack against, as the home runs are adding up as are the high run totals against him.
| Mike Fiers |
 | FanDuel | DraftKings |
| Salary: | $7,600 | Salary: | $5,400 |
| FPPG: | 23.1 | FPPG: | 10.8 |
| Pitcher Rating: | 66.3 | Pitcher Rank: | 11 |
| Statistics | Starts | PitchPS | SIERA | ERA | K% | BB% | SS% | GB% | FB% | HH% |
| L30 Days | 4 | 83.3 | 5.31 | 6.23 | 16.7% | 11.9% | 6.9% | 39.0% | 32.2% | 49.2% |
| 2016 | 17 | 92.7 | 4.45 | 4.75 | 16.6% | 5.8% | 8.6% | 41.8% | 30.2% | 37.7% |
| 2015 | 30 | 101.4 | 3.84 | 3.69 | 23.7% | 8.4% | 9.8% | 37.6% | 42.1% | 33.5% |
: This is another starter who it is hard to trust on the day. He did not even make it out of the fourth inning in his start against a bad Oakland offense and offers a low strikeout rate, making him even less attractive. The Angels strike out the least in the entire league against right-handed pitching so Fiers is not someone you want in your lineups outside of a flier on DK at that price.
Batter Grind Down
LA Angels
Angels: Los Angeles continues to have solid contribution near the top of the order only to see the bottom of the lineup completely fail. With no clear options to make things better, we are required to lean on Trout and company to do the heavy lifting.
- Angels Offense (2016)
Team wOBA vs. RHP — 0.316 (16 of 30)
Team ISO vs. RHP — 0.142 (24 of 30)
Team K% vs. RHP — 15.3% (1 of 30)
Runs Per Game — 4.66 (11 of 30)
Projected Run Total — 4.17 (25 of 30)
Projected Lineup
| # | Player | Bats | wOBA vs. RHP | ISO vs. RHP | wOBA L14 | FD Position | FD Salary | DK Position | DK Salary |
| 1 | | RIGHT | 0.337 | 0.091 | 0.251 | 3B | $2,700 | 3B | $2,900 |
| 2 | | LEFT | 0.332 | 0.162 | 0.378 | OF | $3,200 | OF | $3,800 |
| 3 | | RIGHT | 0.416 | 0.282 | 0.389 | OF | $4,800 | OF | $5,400 |
| 4 | | RIGHT | 0.333 | 0.209 | 0.442 | 1B | $3,500 | 1B | $4,000 |
| 5 | | SWITCH | 0.269 | 0.063 | 0.313 | OF | $2,100 | OF | $2,800 |
| 6 | | RIGHT | 0.291 | 0.078 | 0.362 | SS | $2,200 | SS | $2,800 |
| 7 | Ji-Man Choi | LEFT | 0.276 | 0.125 | 0.327 | 1B | $2,300 | 1B/OF | $3,100 |
| 8 | | RIGHT | 0.256 | 0.082 | 0.292 | C | $2,500 | C | $2,900 |
| 9 | | LEFT | 0.306 | 0.129 | 0.189 | 2B | $2,700 | 2B | $3,100 |
| | Team Averages | — | 0.313 | 0.136 | 0.327 | — | — | — | — |
Elite Plays –
Secondary Plays – , ,
Stackability – Orange
Houston
Astros: Sure, the Astros strike out a bunch, but they also can crush the ball, which will be in play with Lincecum on the mound for the Angels. He has been getting hit hard often, and all the usual suspects are in play for Houston in this one.
- Astros Offense (2016)
Team wOBA vs. RHP — 0.322 (10 of 30)
Team ISO vs. RHP — 0.173 (10 of 30)
Team K% vs. RHP — 24.0% (27 of 30)
Runs Per Game — 4.53 (15 of 30)
Projected Run Total — 5.33 (4 of 30)
Projected Lineup
| # | Player | Bats | wOBA vs. RHP | ISO vs. RHP | wOBA L14 | FD Position | FD Salary | DK Position | DK Salary |
| 1 | | RIGHT | 0.336 | 0.171 | 0.265 | OF | $4,000 | OF | $4,100 |
| 2 | | SWITCH | 0.301 | 0.141 | 0.348 | 1B | $3,600 | 1B/3B | $3,700 |
| 3 | | RIGHT | 0.351 | 0.159 | 0.486 | 2B | $4,200 | 2B | $5,500 |
| 4 | | RIGHT | 0.370 | 0.226 | 0.389 | SS | $3,500 | SS | $5,100 |
| 5 | | LEFT | 0.351 | 0.229 | 0.321 | 3B | $3,100 | 3B | $3,900 |
| 6 | | LEFT | 0.323 | 0.207 | 0.000 | OF | $2,800 | OF | $3,600 |
| 7 | | RIGHT | 0.300 | 0.145 | 0.140 | OF | $3,200 | OF | $2,500 |
| 8 | | RIGHT | 0.312 | 0.213 | 0.324 | C | $2,700 | C | $2,900 |
| 9 | | LEFT | 0.327 | 0.197 | 0.319 | C | $2,700 | C | $3,400 |
| | Team Averages | — | 0.330 | 0.188 | 0.288 | — | — | — | — |
Elite Plays – ,
Secondary Plays – , ,
Stackability – Yellow
Texas at Kansas City – 2:15 PM ET
| Texas | Kansas City |
 | |  | |
| RIGHT | RIGHT |
| Vegas Moneyline | Vegas Over/Under |
| KC -115 | 9.0 |
| Stats | wOBA | HR All. | K% | BB% | Stats | wOBA | HR All. | K% | BB% |
| SP vs. Left | 0.363 | 7 | 20.8% | 9.6% | SP vs. Left | 0.297 | 16 | 18.3% | 9.1% |
| SP vs. Right | 0.263 | 1 | 20.9% | 10.4% | SP vs. Right | 0.316 | 12 | 17.8% | 8.0% |
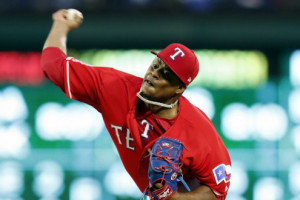
Pitcher Grind Down
| A.J. Griffin |
 | FanDuel | DraftKings |
| Salary: | $7,000 | Salary: | $5,900 |
| FPPG: | 25.1 | FPPG: | 12.8 |
| Pitcher Rating: | 52.4 | Pitcher Rank: | 17 |
| Statistics | Starts | PitchPS | SIERA | ERA | K% | BB% | SS% | GB% | FB% | HH% |
| L30 Days | 5 | 89.0 | 4.66 | 6.17 | 21.4% | 9.7% | 7.9% | 30.4% | 49.3% | 43.5% |
| 2016 | 11 | 91.1 | 4.67 | 4.26 | 20.8% | 10.0% | 8.2% | 34.8% | 45.7% | 39.0% |
A.J Griffin: With a hard hit percentage around 40% on the season and a walk rate around 10%, it is easy to see how Griffin has struggled. He will be facing a pesky Royals offense that may not rank well against right-handed pitching overall, but they still project well enough here to stay away from the Rangers starter. Even with the minimal pitching options, Griffin is not a guy we want in our lineups.
| Edinson Volquez |
 | FanDuel | DraftKings |
| Salary: | $7,100 | Salary: | $6,400 |
| FPPG: | 26.9 | FPPG: | 12.8 |
| Pitcher Rating: | 52.0 | Pitcher Rank: | 18 |
| Statistics | Starts | PitchPS | SIERA | ERA | K% | BB% | SS% | GB% | FB% | HH% |
| L30 Days | 5 | 90.6 | 4.92 | 6.75 | 15.3% | 9.3% | 8.4% | 52.3% | 31.8% | 40.9% |
| 2016 | 20 | 98.3 | 4.48 | 4.72 | 17.8% | 8.6% | 8.9% | 53.4% | 30.1% | 28.2% |
| 2015 | 33 | 99.9 | 4.35 | 3.55 | 18.2% | 8.5% | 9.5% | 46.0% | 32.9% | 30.4% |
: The Rangers are better than advertised, and Volquez had been struggling a bit up until his last start. This is a scenario where he does not strike out enough guys to make it worth rostering him, as Texas is pretty good at limiting opposing pitchers in that regard. With the strikeout numbers limited, it is easy to look elsewhere for pitching today.
Batter Grind Down
Texas
Rangers: One of the more underappreciated offenses in the league, Texas has done a pretty solid job of pushing runs across the plate all season long. Volquez is not a world beater, and as such, you can roster a number of guys from this team, as they are another squad that I like to exceed their projected run total today.
- Rangers Offense (2016)
Team wOBA vs. RHP — 0.318 (11 of 30)
Team ISO vs. RHP — 0.168 (14 of 30)
Team K% vs. RHP — 19.4% (7 of 30)
Runs Per Game — 4.82 (8 of 30)
Projected Run Total — 4.41 (16 of 30)
Projected Lineup
| # | Player | Bats | wOBA vs. RHP | ISO vs. RHP | wOBA L14 | FD Position | FD Salary | DK Position | DK Salary |
| 1 | | SWITCH | 0.394 | 0.189 | 0.320 | 2B | $2,400 | 2B/3B | $3,400 |
| 2 | | RIGHT | 0.316 | 0.170 | 0.421 | OF | $4,100 | OF | $4,100 |
| 3 | | LEFT | 0.328 | 0.214 | 0.322 | 2B | $3,000 | 2B | $4,000 |
| 4 | | RIGHT | 0.306 | 0.139 | 0.307 | 3B | $3,100 | 3B | $2,900 |
| 5 | | LEFT | 0.349 | 0.219 | 0.449 | 1B | $3,100 | 1B | $3,000 |
| 6 | | RIGHT | 0.284 | 0.153 | 0.223 | OF | $2,900 | 1B/OF | $2,800 |
| 7 | | LEFT | 0.348 | 0.167 | 0.275 | OF | $2,800 | OF | $3,400 |
| 8 | | RIGHT | 0.286 | 0.087 | 0.408 | SS | $2,900 | SS | $3,100 |
| 9 | | RIGHT | 0.323 | 0.232 | 0.398 | C | $2,700 | C | $3,300 |
| | Team Averages | — | 0.326 | 0.174 | 0.347 | — | — | — | — |
Elite Plays –
Secondary Plays – , ,
Stackability – Orange
Kansas City
Royals: Kansas City is frustrating because Griffin is a guy that I would typically pick on in this situation, but I honestly do not know where to go outside of the two first base eligible players in Hosmer and Morales. Sal Perez is really the only other trustworthy option in the lineup, and the potential just is not there for a huge fantasy day from this team.
- Royals Offense (2016)
Team wOBA vs. RHP — 0.308 (20 of 30)
Team ISO vs. RHP — 0.130 (29 of 30)
Team K% vs. RHP — 20.2% (12 of 30)
Runs Per Game — 4.02 (26 of 30)
Projected Run Total — 4.59 (12 of 30)
Projected Lineup
| # | Player | Bats | wOBA vs. RHP | ISO vs. RHP | wOBA L14 | FD Position | FD Salary | DK Position | DK Salary |
| 1 | | RIGHT | 0.267 | 0.061 | 0.208 | SS | $2,900 | SS | $3,500 |
| 2 | | RIGHT | 0.328 | 0.145 | 0.419 | 3B | $3,100 | 3B | $3,700 |
| 3 | | LEFT | 0.370 | 0.172 | 0.268 | 1B | $3,800 | 1B | $3,400 |
| 4 | | SWITCH | 0.352 | 0.215 | 0.224 | 1B | $3,200 | 1B/OF | $2,600 |
| 5 | | RIGHT | 0.333 | 0.200 | 0.355 | C | $3,200 | C | $3,800 |
| 6 | | LEFT | 0.328 | 0.163 | 0.331 | OF | $2,500 | OF | $4,300 |
| 7 | | RIGHT | 0.308 | 0.146 | 0.246 | OF | $2,200 | OF | $3,100 |
| 8 | | RIGHT | 0.280 | 0.103 | 0.243 | 2B | $2,500 | 2B/OF | $2,900 |
| 9 | | LEFT | 0.301 | 0.125 | 0.389 | OF | $2,700 | OF | $3,500 |
| | Team Averages | — | 0.319 | 0.148 | 0.298 | — | — | — | — |
Elite Plays – None
Secondary Plays – , ,
Stackability – Red
Tampa Bay at Oakland – 4:05 PM ET
| Tampa Bay | Oakland |
 | |  | |
| LEFT | RIGHT |
| Vegas Moneyline | Vegas Over/Under |
| TB -115 | 9.0 |
| Stats | wOBA | HR All. | K% | BB% | Stats | wOBA | HR All. | K% | BB% |
| SP vs. Left | 0.341 | 0 | 22.0% | 14.6% | SP vs. Left | 0.358 | 8 | 13.7% | 6.3% |
| SP vs. Right | 0.266 | 1 | 21.8% | 11.3% | SP vs. Right | 0.254 | 3 | 14.8% | 7.9% |
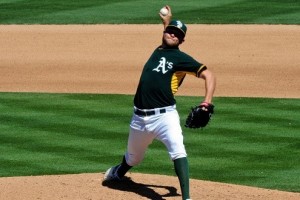
Pitcher Grind Down
| Blake Snell |
 | FanDuel | DraftKings |
| Salary: | $7,300 | Salary: | $8,600 |
| FPPG: | 29.4 | FPPG: | 15.2 |
| Pitcher Rating: | 58.8 | Pitcher Rank: | 12 |
| Statistics | Starts | PitchPS | SIERA | ERA | K% | BB% | SS% | GB% | FB% | HH% |
| L30 Days | 4 | 100.0 | 4.53 | 3.57 | 25.0% | 13.5% | 10.0% | 47.5% | 35.6% | 25.4% |
| 2016 | 7 | 98.0 | 4.68 | 3.11 | 21.8% | 12.1% | 8.3% | 44.3% | 33.0% | 27.5% |
: This is a very interesting matchup for Snell, as the A’s are a little better against lefties than righties, but he is coming off of a brilliant start and Oakland still is pretty bad overall. The start could have been a glimpse into the future for the highly touted Snell, and I am more than okay with grabbing some exposure to the youngster today.
| Jesse Hahn |
 | FanDuel | DraftKings |
| Salary: | $6,900 | Salary: | $5,600 |
| FPPG: | 14.4 | FPPG: | 4.5 |
| Pitcher Rating: | 49.5 | Pitcher Rank: | 20 |
| Statistics | Starts | PitchPS | SIERA | ERA | K% | BB% | SS% | GB% | FB% | HH% |
| 2016 | 7 | 76.4 | 5.27 | 6.49 | 10.3% | 9.6% | 5.8% | 54.0% | 22.6% | 26.4% |
| 2015 | 16 | 95.7 | 4.01 | 3.35 | 15.8% | 6.2% | 7.5% | 52.6% | 22.9% | 23.3% |
: The Rays may be pretty bad against right-handed pitching, but there is no way you can roster Hahn here. He simply does not have any upside with an extremely low K rate, and if the ball is put into play, that .180 ISO for Tampa scares me a bit.
Batter Grind Down
Tampa Bay
Rays: Typically a team you stay away from against righties, the Rays are less likely to strike out in this one, and when they do put the ball in play, the results have been pretty solid. They pack a pretty good punch as can be seen by their ISO column in the projected lineup today. is a guy that I love to play against low-strikeout pitchers and is a fantastic play today.
- Rays Offense (2016)
Team wOBA vs. RHP — 0.305 (24 of 30)
Team ISO vs. RHP — 0.180 (8 of 30)
Team K% vs. RHP — 24.4% (28 of 30)
Runs Per Game — 4.05 (24 of 30)
Projected Run Total — 4.59 (12 of 30)
Projected Lineup
| # | Player | Bats | wOBA vs. RHP | ISO vs. RHP | wOBA L14 | FD Position | FD Salary | DK Position | DK Salary |
| 1 | | RIGHT | 0.325 | 0.118 | 0.300 | 2B | $3,300 | 2B | $3,200 |
| 2 | | LEFT | 0.338 | 0.204 | 0.336 | SS | $3,600 | SS | $4,200 |
| 3 | | RIGHT | 0.327 | 0.192 | 0.494 | 3B | $4,300 | 3B | $4,400 |
| 4 | | LEFT | 0.356 | 0.271 | 0.395 | OF | $3,500 | OF | $3,800 |
| 5 | | RIGHT | 0.341 | 0.207 | 0.482 | OF | $3,400 | 1B/2B | $3,100 |
| 6 | | RIGHT | 0.311 | 0.167 | 0.149 | OF | $2,700 | OF | $2,900 |
| 7 | | LEFT | 0.318 | 0.180 | 0.242 | OF | $2,400 | OF | $3,400 |
| 8 | | RIGHT | 0.285 | 0.117 | 0.277 | OF | $2,800 | OF | $2,500 |
| 9 | | RIGHT | 0.290 | 0.227 | 0.211 | C | $2,500 | C | $2,000 |
| | Team Averages | — | 0.321 | 0.187 | 0.321 | — | — | — | — |
Elite Plays – ,
Secondary Plays – , ,
Stackability – Yellow
Oakland
A’s: With Snell on the mound, I am less likely to play Oakland bats, but if you do then we need to stick to the main two targets in and . With that said, even those two are not hitting the ball well lately, and an all out fade is not a terrible idea here.
- Athletics Offense (2016)
Team wOBA vs. LHP — 0.313 (21 of 30)
Team ISO vs. LHP — 0.166 (14 of 30)
Team K% vs. LHP — 18.3% (5 of 30)
Runs Per Game — 4.13 (23 of 30)
Projected Run Total — 4.41 (16 of 30)
Projected Lineup
| # | Player | Bats | wOBA vs. LHP | ISO vs. LHP | wOBA L14 | FD Position | FD Salary | DK Position | DK Salary |
| 1 | | RIGHT | 0.385 | 0.244 | 0.306 | SS | $3,400 | SS | $4,200 |
| 2 | | SWITCH | 0.332 | 0.135 | 0.272 | 2B | $3,100 | 2B | $2,300 |
| 3 | | LEFT | 0.262 | 0.098 | 0.394 | OF | $3,300 | OF | $2,400 |
| 4 | | RIGHT | 0.386 | 0.196 | 0.249 | 3B | $2,700 | 3B | $3,900 |
| 5 | | RIGHT | 0.310 | 0.229 | 0.290 | OF | $3,200 | OF | $3,700 |
| 6 | | RIGHT | 0.320 | 0.146 | 0.376 | 1B | $2,500 | 1B | $3,200 |
| 7 | | RIGHT | 0.125 | 0.000 | 0.313 | 1B | $2,300 | 3B | $2,200 |
| 8 | | RIGHT | 0.404 | 0.279 | 0.411 | OF | $2,600 | OF | $3,200 |
| 9 | | LEFT | | | | | | | |
| | Team Averages | — | 0.316 | 0.166 | 0.326 | — | — | — | — |
Elite Plays – None
Secondary Plays – , ,
Stackability – Red
Atlanta at Colorado – 4:10 PM ET
| Atlanta | Colorado |
 | |  | |
| RIGHT | RIGHT |
| Vegas Moneyline | Vegas Over/Under |
| COL -200 | 12.0 |
| Stats | wOBA | HR All. | K% | BB% | Stats | wOBA | HR All. | K% | BB% |
| SP vs. Left | 0.354 | 2 | 7.7% | 15.4% | SP vs. Left | 0.267 | 1 | 15.9% | 6.4% |
| SP vs. Right | 0.345 | 1 | 12.0% | 10.0% | SP vs. Right | 0.345 | 6 | 13.3% | 11.5% |
Pitcher Grind Down
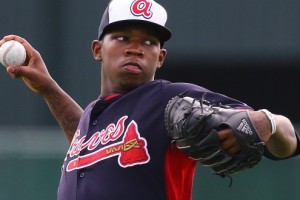
| Tyrell Jenkins |
 | FanDuel | DraftKings |
| Salary: | $5,900 | Salary: | $4,200 |
| FPPG: | 10.0 | FPPG: | 4.3 |
| Pitcher Rating: | 14.3 | Pitcher Rank: | 30 |
| Statistics | Starts | PitchPS | SIERA | ERA | K% | BB% | SS% | GB% | FB% | HH% |
| L30 Days | 2 | 165.0 | 5.70 | 4.05 | 10.1% | 12.4% | 5.8% | 56.9% | 29.2% | 27.9% |
| 2016 | 2 | 165.0 | 5.69 | 4.05 | 10.1% | 12.4% | 5.8% | 56.9% | 29.2% | 27.9% |
: When your walk rate is higher than your K rate, that is not a good sign. When that is a fact and you are pitching in Coors, it is downright scary. Jenkins has been solid at producing ground balls to this point, but the runs have been and issue, and in Coors there is no reason to go this route.
| Tyler Chatwood |
 | FanDuel | DraftKings |
| Salary: | $6,700 | Salary: | $5,500 |
| FPPG: | 26.2 | FPPG: | 12.3 |
| Pitcher Rating: | 49.7 | Pitcher Rank: | 19 |
| Statistics | Starts | PitchPS | SIERA | ERA | K% | BB% | SS% | GB% | FB% | HH% |
| L30 Days | 3 | 81.7 | 5.97 | 8.31 | 10.5% | 13.4% | 5.3% | 51.0% | 23.5% | 43.1% |
| 2016 | 17 | 91.1 | 4.70 | 3.83 | 14.5% | 9.2% | 7.0% | 57.4% | 24.2% | 29.8% |
: Since coming off of the DL, Chatwood has allowed twelve runs in thirteen innings over three starts. It takes a lot to put the Braves in play, but the Colorado air and Chatwood’s arm just about do it for us here today.
Batter Grind Down
Atlanta
Braves: As I just mentioned, it takes a fair amount for me to consider Atlanta bats, and today I like them about as much as I can remember all season long. You are going to see a lot of red in the projected lineup, which may scare some off, but just remember this ballpark is a completely different animal.
- Braves Offense (2016)
Team wOBA vs. RHP — 0.283 (30 of 30)
Team ISO vs. RHP — 0.116 (30 of 30)
Team K% vs. RHP — 19.9% (9 of 30)
Runs Per Game — 3.40 (30 of 30)
Projected Run Total — 5.42 (3 of 30)
Projected Lineup
| # | Player | Bats | wOBA vs. RHP | ISO vs. RHP | wOBA L14 | FD Position | FD Salary | DK Position | DK Salary |
| 1 | | LEFT | 0.311 | 0.109 | 0.365 | 2B | $3,300 | 2B/OF | $4,100 |
| 2 | Chase d’Arnaud | RIGHT | 0.288 | 0.076 | 0.321 | 3B | $3,600 | 3B/SS | $3,700 |
| 3 | | LEFT | 0.368 | 0.234 | 0.297 | 1B | $3,500 | 1B | $4,800 |
| 4 | | LEFT | 0.339 | 0.105 | 0.331 | OF | $3,000 | OF | $4,900 |
| 5 | | RIGHT | 0.293 | 0.153 | 0.422 | 3B | $3,400 | 3B | $4,500 |
| 6 | | LEFT | 0.334 | 0.116 | 0.342 | OF | $3,300 | OF | $5,200 |
| 7 | | LEFT | 0.311 | 0.126 | 0.385 | C | $2,600 | C | $3,400 |
| 8 | | SWITCH | 0.276 | 0.071 | 0.150 | SS | $2,200 | SS | $3,100 |
| 9 | | RIGHT | 0.000 | 0.000 | 0.000 | P | $5,900 | P | $4,200 |
| | Team Averages | — | 0.280 | 0.110 | 0.290 | — | — | — | — |
Elite Plays –
Secondary Plays – , , ,
Stackability – Yellow
Colorado
Rockies: With the amount of runners on base that Jenkins has allowed, he is actually pretty lucky with the ERA he has now. The Rockies are much more likely to make him pay today if he keeps that trend up and they have to be considered the top offense of the day. There is not a single hitter who you have to avoid in this scenario, as each should be presented with good opportunities.
- Rockies Offense (2016)
Team wOBA vs. RHP — 0.339 (4 of 30)
Team ISO vs. RHP — 0.184 (6 of 30)
Team K% vs. RHP — 20.1% (11 of 30)
Runs Per Game — 5.13 (4 of 30)
Projected Run Total — 6.58 (1 of 30)
Projected Lineup
| # | Player | Bats | wOBA vs. RHP | ISO vs. RHP | wOBA L14 | FD Position | FD Salary | DK Position | DK Salary |
| 1 | | LEFT | 0.364 | 0.184 | 0.328 | OF | $4,100 | OF | $5,400 |
| 2 | | RIGHT | 0.340 | 0.110 | 0.299 | 2B | $3,900 | 2B | $4,300 |
| 3 | | RIGHT | 0.383 | 0.301 | 0.306 | 3B | $4,900 | 3B | $5,300 |
| 4 | | LEFT | 0.411 | 0.292 | 0.388 | OF | $4,700 | OF | $5,600 |
| 5 | | RIGHT | 0.354 | 0.278 | 0.416 | SS | $4,000 | SS | $5,500 |
| 6 | | LEFT | 0.313 | 0.133 | 0.343 | 2B | $2,900 | 1B/OF | $3,600 |
| 7 | | RIGHT | 0.329 | 0.176 | 0.247 | 1B | $3,400 | 1B | $4,700 |
| 8 | | RIGHT | 0.347 | 0.172 | 0.252 | C | $2,800 | C | $3,800 |
| 9 | | RIGHT | 0.282 | 0.000 | 0.439 | P | $6,700 | P | $5,500 |
| | Team Averages | — | 0.347 | 0.183 | 0.335 | — | — | — | — |
Elite Plays – , ,
Secondary Plays – , ,
Stackability – Green
LA Dodgers at St. Louis – 8:08 PM ET
| LA Dodgers | St. Louis |
 | |  | |
| LEFT | RIGHT |
| Vegas Moneyline | Vegas Over/Under |
| LAD -125 | 9.0 |
| Stats | wOBA | HR All. | K% | BB% | Stats | wOBA | HR All. | K% | BB% |
| SP vs. Left | 0.304 | 11 | 15.6% | 5.5% | SP vs. Left | | | | |
| SP vs. Right | 0.303 | 25 | 24.6% | 9.0% | SP vs. Right | | | | |
Pitcher Grind Down
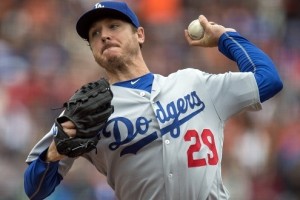
| Scott Kazmir |
 | FanDuel | DraftKings |
| Salary: | $8,800 | Salary: | $8,500 |
| FPPG: | 30.1 | FPPG: | 15.6 |
| Pitcher Rating: | 73.3 | Pitcher Rank: | 8 |
| Statistics | Starts | PitchPS | SIERA | ERA | K% | BB% | SS% | GB% | FB% | HH% |
| L30 Days | 4 | 92.5 | 3.23 | 3.43 | 30.7% | 8.0% | 10.0% | 40.4% | 38.5% | 22.6% |
| 2016 | 19 | 94.9 | 3.87 | 4.30 | 25.4% | 8.7% | 10.3% | 41.3% | 37.5% | 22.8% |
| 2015 | 31 | 94.9 | 4.10 | 3.10 | 20.3% | 7.7% | 10.3% | 42.9% | 37.3% | 25.7% |
: In his last start, Kazmir, coming off of extended rest, looked great once again. Facing a Cardinals team that has struggled against left handed pitching, it is easy to put him near the top of your list today and more specifically as a secondary option on DraftKings, where the options are severely limited. We have decent strikeout potential with Kazmir, and while the St. Louis bats have been better lately against lefties, I feel we can attack them here.
| Mike Mayers |
 | FanDuel | DraftKings |
| Salary: | | Salary: | |
| FPPG: | | FPPG: | |
| Pitcher Rating: | 47.1 | Pitcher Rank: | 23 |
| Statistics | Starts | PitchPS | SIERA | ERA | K% | BB% | SS% | GB% | FB% | HH% |
: Making his major league debut, Mayers has had solid success between AA and AAA this season but offers limited strikeout potential sitting just below 20% at both levels. He has held the opposition in check for most of his starts and profiles as more of a game manager than anything else. With not much to go on other than what we know about the Dodgers, I would take a wait-and-see approach on Mayers if he is even available for you to use on the site you play on.
Batter Grind Down
LA Dodgers
Dodgers: Los Angeles is coming off of a big win yesterday, where they got to early and will look to continue the hot hitting into today. It has been a rough go of thins for the Dodgers overall, as they were expected to be much better offensively than we have seen, and moving forward I expect them to climb the rankings as the season grinds on. The middle of this order is where you want to target players in this game, and Turner and Kendrick are as hot as anyone right now.
- Dodgers Offense (2016)
Team wOBA vs. RHP — 0.317 (14 of 30)
Team ISO vs. RHP — 0.159 (16 of 30)
Team K% vs. RHP — 20.7% (15 of 30)
Runs Per Game — 4.29 (19 of 30)
Projected Run Total — 4.65 (11 of 30)
Projected Lineup
| # | Player | Bats | wOBA vs. RHP | ISO vs. RHP | wOBA L14 | FD Position | FD Salary | DK Position | DK Salary |
| 1 | | LEFT | 0.311 | 0.137 | 0.306 | 2B | $3,100 | 2B | $4,300 |
| 2 | | LEFT | 0.404 | 0.241 | 0.370 | SS | $3,400 | SS | $4,100 |
| 3 | | RIGHT | 0.384 | 0.224 | 0.528 | 3B | $3,800 | 3B | $5,000 |
| 4 | | LEFT | 0.351 | 0.189 | 0.367 | 1B | $2,700 | 1B | $3,400 |
| 5 | | RIGHT | 0.319 | 0.114 | 0.511 | 2B | $3,400 | 2B/OF | $4,500 |
| 6 | | SWITCH | 0.328 | 0.205 | 0.508 | C | $3,300 | C | $4,300 |
| 7 | | LEFT | 0.346 | 0.225 | 0.098 | OF | $3,200 | OF | $3,700 |
| 8 | Scott | RIGHT | 0.259 | 0.119 | 0.397 | OF | $2,400 | 1B/OF | $3,600 |
| 9 | | LEFT | 0.156 | 0.000 | 0.000 | P | $8,800 | P | $8,500 |
| | Team Averages | — | 0.318 | 0.162 | 0.343 | — | — | — | — |
Elite Plays –
Secondary Plays – , ,
Stackability – Orange
St. Louis
Cardinals: Injuries have once again led the Cardinals to lean on players they were not expecting to use as often, but the results have once again been solid. It has not been a great season for the Redbirds against left-handed pitching, but is the exception, as he has blistered the ball against southpaws in his young career and is the main target from this squad today.
- Cardinals Offense (2016)
Team wOBA vs. LHP — 0.312 (22 of 30)
Team ISO vs. LHP — 0.162 (16 of 30)
Team K% vs. LHP — 21.0% (12 of 30)
Runs Per Game — 5.18 (2 of 30)
Projected Run Total — 4.35 (19 of 30)
Projected Lineup
| # | Player | Bats | wOBA vs. LHP | ISO vs. LHP | wOBA L14 | FD Position | FD Salary | DK Position | DK Salary |
| 1 | | RIGHT | 0.301 | 0.141 | 0.429 | OF | $2,900 | OF | $3,100 |
| 2 | | RIGHT | 0.352 | 0.172 | 0.398 | SS | $3,500 | SS | $3,900 |
| 3 | | RIGHT | 0.433 | 0.264 | 0.436 | OF | $3,300 | OF | $4,600 |
| 4 | | RIGHT | 0.327 | 0.212 | 0.388 | OF | $3,300 | OF | $3,300 |
| 5 | | RIGHT | 0.272 | 0.056 | 0.444 | C | $3,000 | C | $2,700 |
| 6 | | RIGHT | 0.300 | 0.197 | 0.345 | OF | $2,700 | OF | $2,800 |
| 7 | | RIGHT | 0.324 | 0.131 | 0.545 | 3B | $2,800 | 2B/3B | $3,200 |
| 8 | | LEFT | 0.405 | 0.150 | 0.292 | 2B | $2,400 | 2B/3B | $3,200 |
| 9 | | RIGHT | | | | | | | |
| | Team Averages | — | 0.339 | 0.165 | 0.410 | — | — | — | — |
Elite Plays –
Secondary Plays – ,
Stackability – Red
Jump to Page 1 2 3
