MLB Grind Down: Monday, May 9th
The RotoGrinders MLB Grind Down will give you an in-depth analysis into the upcoming MLB schedule. This article will break down the numbers for every single game and give you analysis on which trends you can exploit. While matchups are a major factor in daily fantasy baseball, there are plenty of other factors to consider such as injuries, weather, and salaries.
The analysis should point you in the right direction, but it is still up to you to decipher the information and make your own selections. No sport has more variance than baseball. The best choice is not always the right choice but following the trends will win you money over time.
Note: As always, if you want to try a new DFS site, be sure to click through a RotoGrinders link and use our DraftKings promo code and FanDuel promo code to receive the best perks in the industry.
Detroit at Washington – 7:05 PM
| Detroit | Washington |
 | |  | |
| RIGHT | RIGHT |
| Vegas Moneyline | Vegas Over/Under |
| WAS -200 | 7.5 |
| Stats | wOBA | HR All. | K% | BB% | Stats | wOBA | HR All. | K% | BB% |
| SP vs. Left | 0.310 | 13 | 23.1% | 10.7% | SP vs. Left | 0.238 | 5 | 29.5% | 7.2% |
| SP vs. Right | 0.369 | 21 | 19.5% | 6.1% | SP vs. Right | 0.314 | 10 | 29.6% | 3.0% |
Pitcher Grind Down
| Anibal Sanchez |
 | FanDuel | DraftKings |
| Salary: | $7,200 | Salary: | $7,500 |
| FPPG: | 27.8 | FPPG: | 12.5 |
| Pitcher Rating: | 56.3 | Pitcher Rank: | 12 |
| Statistics | Starts | SIERA | K% | SS% | BB% | GB% | FB% | HH% | O-K% |
| 2016 | 6 | 4.52 | 23.6% | 9.6% | 13.6% | 40.5% | 41.7% | 31.4% | 16 |
| 2015 | 25 | 4.03 | 20.9% | 9.3% | 7.4% | 40.0% | 39.1% | 27.1% | 28 |
Sanchez may not be an elite pitcher at this stage of his career, but he still has a strikeout rate north of 23% on the season. He has walked a few too many batters this year though, and his SIERA is below average at 4.52. He draws a fairly difficult matchup tonight against the Nationals, although he does get to face them in a National League ballpark. The biggest issue here is the fact that he is such a large underdog on the road. Run support will likely be scarce with pitching opposite him.
| Stephen Strasburg |
 | FanDuel | DraftKings |
| Salary: | $11,000 | Salary: | $11,600 |
| FPPG: | 49.0 | FPPG: | 26.9 |
| Pitcher Rating: | 94.3 | Pitcher Rank: | 2 |
| Statistics | Starts | SIERA | K% | SS% | BB% | GB% | FB% | HH% | O-K% |
| 2016 | 6 | 2.79 | 29.2% | 12.2% | 5.6% | 49.5% | 32.0% | 24.8% | 25 |
| 2015 | 23 | 2.76 | 29.6% | 11.2% | 5.0% | 42.2% | 34.3% | 28.9% | 13 |
Strasburg is off to a great start this season. In his first six starts, he has a 2.79 SIERA with a strikeout rate of 29.2%. He is producing a higher swinging strike rate this year and he is also producing a higher ground ball rate. The Tigers do have a lot of quality batter in their lineup, but Strasburg is going to have the platoon advantage tonight. The Tigers’ projected lineup has eight right-handed hitters in it. Strasburg is my second favorite pitching option on the board and is worth a look in all league formats.
Batter Grind Down
Detroit
- Tigers Offense
Team wOBA vs. RHP — 0.317 (12 of 30)
Team ISO vs. RHP — 0.142 (21 of 30)
Runs Per Game — 4.37 (14 of 30)
Projected Run Total — 3.17 (24 of 26)
The Tigers’ offense has not been great this season. They are ranked right around the league average in runs scored per game. They come into tonight’s contest with the third lowest team total on the board. They draw a difficult matchup against , who has held both left and right-handed hitters under a .315 wOBA over the last two seasons.
Projected Lineup
| # | Player | Bats | wOBA vs. RHP | ISO vs. RHP | wOBA L14 | FD Position | FD Salary | DK Position | DK Salary |
| 1 | | RIGHT | 0.333 | 0.136 | 0.328 | 2B | $3,700 | 2B | $3,900 |
| 2 | | RIGHT | 0.352 | 0.224 | 0.218 | OF | $2,700 | OF | $3,200 |
| 3 | | RIGHT | 0.402 | 0.189 | 0.453 | 1B | $3,700 | 1B | $3,500 |
| 4 | | RIGHT | 0.349 | 0.209 | 0.290 | OF | $3,000 | OF | $3,500 |
| 5 | | RIGHT | 0.313 | 0.159 | 0.493 | 3B | $3,400 | 3B | $3,100 |
| 6 | | RIGHT | 0.265 | 0.082 | 0.141 | C | $2,000 | C | $2,100 |
| 7 | | LEFT | 0.316 | 0.128 | 0.361 | OF | $2,600 | OF | $2,800 |
| 8 | | RIGHT | 0.285 | 0.049 | 0.185 | SS | $2,000 | SS | $2,300 |
| 9 | | RIGHT | 0.000 | 0.000 | | P | $7,200 | P | $7,500 |
| | Team Averages | — | 0.291 | 0.131 | 0.309 | — | — | — | — |
Elite Plays – NONE
Secondary Plays – NONE
Stackability – NONE
Washington
- Nationals Offense
Team wOBA vs. RHP — 0.310 (20 of 30)
Team ISO vs. RHP — 0.150 (15 of 30)
Runs Per Game — 4.39 (13 of 30)
Projected Run Total — 4.33 (13 of 26)
The Nationals have a mediocre team total tonight. They draw a decent matchup against , but they are facing him at home in the pitcher-friendly Nationals Park. Over the last two seasons, Sanchez has allowed a .369 wOBA and 21 home runs to right-handed hitters. I’d also like to bring up one note regarding . Teams are starting to walk him more and more often (22.7% walk rate this season). All of these walks could end up hurting his upside, although he obviously makes a strong play against a fly-ball pitcher like Sanchez.
Projected Lineup
| # | Player | Bats | wOBA vs. RHP | ISO vs. RHP | wOBA L14 | FD Position | FD Salary | DK Position | DK Salary |
| 1 | | LEFT | 0.322 | 0.079 | 0.286 | OF | $2,700 | OF | $3,600 |
| 2 | | RIGHT | 0.296 | 0.101 | 0.248 | 3B | $3,200 | 3B | $3,700 |
| 3 | | LEFT | 0.468 | 0.354 | 0.330 | OF | $4,500 | OF | $4,800 |
| 4 | | RIGHT | 0.285 | 0.143 | 0.251 | 1B | $2,900 | 1B | $3,300 |
| 5 | | LEFT | 0.364 | 0.207 | 0.442 | 2B | $3,700 | 2B | $4,400 |
| 6 | | RIGHT | 0.282 | 0.138 | 0.309 | OF | $3,300 | OF | $3,800 |
| 7 | | RIGHT | 0.285 | 0.137 | 0.498 | C | $2,900 | C | $3,200 |
| 8 | | SWITCH | 0.300 | 0.160 | 0.267 | SS | $2,300 | SS | $2,600 |
| 9 | | RIGHT | 0.148 | 0.000 | 0.147 | P | $11,000 | P | $11,600 |
| | Team Averages | — | 0.306 | 0.147 | 0.309 | — | — | — | — |
Elite Plays –
Secondary Plays – , ,
Stackability – NONE
Kansas City at NY Yankees – 7:05 PM
| Kansas City | NY Yankees |
 | Chris Young |  | |
| RIGHT | RIGHT |
| Vegas Moneyline | Vegas Over/Under |
| NYY -115 | 8.5 |
| Stats | wOBA | HR All. | K% | BB% | Stats | wOBA | HR All. | K% | BB% |
| SP vs. Left | 0.337 | 12 | 17.1% | 10.8% | SP vs. Left | 0.379 | 8 | 9.0% | 7.7% |
| SP vs. Right | 0.256 | 12 | 18.4% | 6.3% | SP vs. Right | 0.305 | 6 | 20.4% | 6.7% |
Pitcher Grind Down
| Chris Young |
 | FanDuel | DraftKings |
| Salary: | $5,500 | Salary: | $5,800 |
| FPPG: | 21.8 | FPPG: | 10.8 |
| Pitcher Rating: | 37.4 | Pitcher Rank: | 22 |
| Statistics | Starts | SIERA | K% | SS% | BB% | GB% | FB% | HH% | O-K% |
| 2016 | 6 | 4.19 | 22.0% | 10.0% | 8.3% | 32.2% | 51.1% | 39.1% | 10 |
| 2015 | 18 | 5.15 | 16.6% | 9.4% | 8.6% | 25.5% | 57.9% | 33.4% | 12 |
Young had that one big outing earlier in the season, but has otherwise been a fadeable pitcher in DFS. In his six starts, he has a 4.19 SIERA with a walk rate of 8.3%. He is an extreme fly-ball pitcher (51.1%) that is facing a talented Yankees’ offense in a hitter-friendly ballpark. Even though the Yankees are nursing a few injuries, they should still be able to get to Young tonight at home.
| Ivan Nova |
 | FanDuel | DraftKings |
| Salary: | $6,300 | Salary: | $5,100 |
| FPPG: | 8.5 | FPPG: | 3.7 |
| Pitcher Rating: | 43.5 | Pitcher Rank: | 18 |
| Statistics | Starts | SIERA | K% | SS% | BB% | GB% | FB% | HH% | O-K% |
| 2016 | 0 | 2.72 | 11.7% | 9.2% | 1.7% | 66.0% | 16.0% | 34.0% | 9 |
| 2015 | 17 | 4.58 | 15.3% | 7.8% | 8.0% | 49.0% | 31.7% | 32.3% | 1 |
Nova is making his first start of the season, after pitching 14 innings out of the bullpen. In 17 starts last year, he had a 4.58 SIERA with a strikeout rate of 15.3%. His strikeout rate has come down even farther this season to 11.7%. Basically, he lacks the upside needed to warrant fantasy consideration. To make matters worse, he is facing a Royals’ offense that has the fewest strikeouts of any team in baseball over the last two seasons.
Batter Grind Down
Kansas City
- Royals Offense
Team wOBA vs. RHP — 0.319 (13 of 30)
Team ISO vs. RHP — 0.149 (21 of 30)
Runs Per Game — 3.40 (28 of 30)
Projected Run Total — 4.16 (15 of 26)
The Royals’ offense may be experiencing a little bit of a World Series hangover. They are currently averaging the third fewest runs per game and they come into tonight’s contest with the 12th lowest team total on the board. While I don’t love the Royals’ offense as a whole tonight, has allowed a .379 wOBA to left-handed hitters over the last two seasons.
Projected Lineup
| # | Player | Bats | wOBA vs. RHP | ISO vs. RHP | wOBA L14 | FD Position | FD Salary | DK Position | DK Salary |
| 1 | | RIGHT | 0.269 | 0.062 | 0.287 | SS | $2,700 | SS | $3,700 |
| 2 | | RIGHT | 0.325 | 0.119 | 0.269 | OF | $3,100 | OF | $4,000 |
| 3 | | LEFT | 0.386 | 0.189 | 0.451 | 1B | $3,500 | 1B | $4,600 |
| 4 | | SWITCH | 0.352 | 0.228 | 0.190 | 1B | $2,300 | 1B | $3,600 |
| 5 | | LEFT | 0.339 | 0.151 | 0.310 | OF | $2,500 | OF | $3,600 |
| 6 | | RIGHT | 0.329 | 0.195 | 0.186 | C | $2,500 | C | $3,500 |
| 7 | | RIGHT | 0.242 | 0.097 | 0.252 | 2B | $2,100 | 2B | $2,800 |
| 8 | | RIGHT | 0.311 | 0.063 | 0.289 | 2B | $2,200 | 2B/3B | $2,800 |
| 9 | | LEFT | 0.297 | 0.128 | 0.231 | OF | $2,500 | OF | $3,800 |
| | Team Averages | — | 0.317 | 0.137 | 0.274 | — | — | — | — |
Elite Plays – NONE
Secondary Plays – , ,
Stackability – NONE
NY Yankees
- Yankees Offense
Team wOBA vs. RHP — 0.322 (13 of 30)
Team ISO vs. RHP — 0.176 (5 of 30)
Runs Per Game — 3.48 (26 of 30)
Projected Run Total — 4.34 (12 of 26)
The Yankees are small favorites tonight at home against the extreme fly-ball pitcher, Chris Young. Young has allowed 24 home runs in his last 24 starts and he has given up a .337 wOBA to left-handed hitters during that stretch. Judging by the splits alone, this is a great matchup for New York, as seven of their nine projected starters hit from the left side of the plate.
Projected Lineup
| # | Player | Bats | wOBA vs. RHP | ISO vs. RHP | wOBA L14 | FD Position | FD Salary | DK Position | DK Salary |
| 1 | | LEFT | 0.292 | 0.100 | 0.328 | OF | $2,900 | OF | $4,400 |
| 2 | | LEFT | 0.330 | 0.154 | 0.233 | OF | $3,000 | OF | $4,000 |
| 3 | | SWITCH | 0.378 | 0.301 | 0.260 | 1B | $2,800 | 1B | $3,900 |
| 4 | | LEFT | 0.330 | 0.202 | 0.262 | C | $3,100 | C | $3,600 |
| 5 | | SWITCH | 0.343 | 0.190 | 0.193 | OF | $2,400 | OF | $3,500 |
| 6 | | RIGHT | 0.292 | 0.127 | 0.377 | 2B | $2,900 | 2B | $3,300 |
| 7 | | SWITCH | 0.282 | 0.125 | 0.251 | OF | $2,400 | OF | $3,400 |
| 8 | | LEFT | 0.301 | 0.120 | 0.209 | SS | $2,200 | SS | $2,900 |
| 9 | | RIGHT | 0.381 | 0.130 | 0.223 | 2B | $2,000 | 3B/SS | $2,600 |
| | Team Averages | — | 0.325 | 0.161 | 0.260 | — | — | — | — |
Elite Plays –
Secondary Plays – , , ,
Stackability – GPP
Milwaukee at Miami – 7:10 PM
| Milwaukee | Miami |
 | |  | |
| RIGHT | RIGHT |
| Vegas Moneyline | Vegas Over/Under |
| MIA -230 | 7.5 |
| Stats | wOBA | HR All. | K% | BB% | Stats | wOBA | HR All. | K% | BB% |
| SP vs. Left | 0.386 | 11 | 10.6% | 6.7% | SP vs. Left | 0.365 | 5 | 22.5% | 9.6% |
| SP vs. Right | 0.369 | 8 | 14.5% | 9.3% | SP vs. Right | 0.220 | 1 | 38.2% | 5.5% |
Pitcher Grind Down
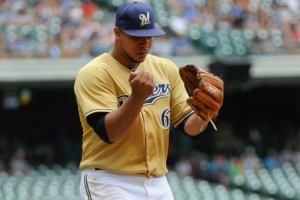
| Wily Peralta |
 | FanDuel | DraftKings |
| Salary: | $5,700 | Salary: | $5,300 |
| FPPG: | 15.5 | FPPG: | 4.3 |
| Pitcher Rating: | 30.4 | Pitcher Rank: | 25 |
| Statistics | Starts | SIERA | K% | SS% | BB% | GB% | FB% | HH% | O-K% |
| 2016 | 6 | 5.01 | 12.4% | 7.7% | 9.0% | 51.9% | 31.1% | 36.0% | 3 |
| 2015 | 20 | 4.75 | 12.6% | 6.9% | 7.7% | 51.6% | 28.4% | 32.6% | 6 |
Peralta has not fared well in his first six starts this season, posting a 5.01 SIERA with a walk rate (9%) that is nearly as high as his strikeout rate (12%). Anytime we have a pitcher whose K:BB ratio is less than two, that is a major red flag. Peralta comes into tonight’s start as the second largest underdog on the board. He draws a difficult matchup against the Marlins, who have the third lowest strikeout rate against right-handed pitching this season.
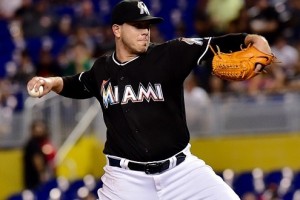
| Jose Fernandez |
 | FanDuel | DraftKings |
| Salary: | $10,800 | Salary: | $11,300 |
| FPPG: | 38.3 | FPPG: | 20.3 |
| Pitcher Rating: | 98.4 | Pitcher Rank: | 1 |
| Statistics | Starts | SIERA | K% | SS% | BB% | GB% | FB% | HH% | O-K% |
| 2016 | 6 | 3.14 | 33.1% | 13.4% | 11.3% | 39.5% | 27.6% | 26.0% | 27 |
| 2015 | 11 | 2.77 | 29.8% | 13.3% | 5.3% | 40.1% | 31.1% | 29.4% | 23 |
Fernandez hasn’t had the best command this season. In fact, his command has been downright awful. He has walked over 11% of the batters that he has faced, which has driven up his pitch count. He has yet to pitch into the seventh inning in any of his six starts. While that’s a small concern, his 33.1% strikeout rate more than makes up for his inability to pitch deep into games. He is the top rated pitcher tonight, as he takes on a strikeout happy Brewers’ offense in the pitcher-friendly Marlins Park.
Batter Grind Down
Milwaukee
- Brewers Offense
Team wOBA vs. RHP — 0.307 (19 of 30)
Team ISO vs. RHP — 0.140 (21 of 30)
Runs Per Game — 4.61 (7 of 30)
Projected Run Total — 3.00 (25 of 26)
The Brewers are a below-average offense against right-handed pitching and they come into tonight’s contest with the second lowest team total on the board. has allowed a .365 wOBA to left-handed hitters over the last two seasons, but the low total makes the Brewers an easy fade tonight. There are better matchups to exploit.
Projected Lineup
| # | Player | Bats | wOBA vs. RHP | ISO vs. RHP | wOBA L14 | FD Position | FD Salary | DK Position | DK Salary |
| 1 | | LEFT | 0.337 | 0.250 | 0.470 | OF | $2,800 | OF | $3,000 |
| 2 | | SWITCH | 0.315 | 0.082 | 0.365 | SS | $3,400 | SS | $3,100 |
| 3 | | RIGHT | 0.366 | 0.206 | 0.405 | OF | $4,200 | OF | $4,000 |
| 4 | | RIGHT | 0.350 | 0.155 | 0.455 | C | $3,300 | C | $3,300 |
| 5 | | RIGHT | 0.344 | 0.283 | 0.430 | 1B | $3,500 | 1B | $3,200 |
| 6 | | RIGHT | 0.291 | 0.140 | 0.397 | 3B | $2,500 | 2B/3B | $2,600 |
| 7 | | RIGHT | 0.244 | 0.058 | 0.357 | 3B | $2,100 | 2B/3B | $2,000 |
| 8 | | LEFT | 0.232 | 0.043 | 0.315 | OF | $2,200 | OF | $2,300 |
| 9 | | RIGHT | 0.051 | 0.000 | 0.000 | P | $5,700 | P | $5,300 |
| | Team Averages | — | 0.281 | 0.135 | 0.355 | — | — | — | — |
Elite Plays – NONE
Secondary Plays – NONE
Stackability – NONE
Miami
- Marlins Offense
Team wOBA vs. RHP — 0.297 (26 of 30)
Team ISO vs. RHP — 0.121 (29 of 30)
Runs Per Game — 4.20 (17 of 30)
Projected Run Total — 4.50 (8 of 26)
The Marlins may not have the highest team wOBA or team ISO against right-handed pitching, but they put the ball into play and they draw a favorable matchup against . Over the last two seasons, Peralta has allowed a .386 wOBA to left-handed hitters and a .369 wOBA to right-handed hitters. With the eighth highest team total on the board, Miami is a sneaky offense to target in both cash games and GPPs.
Projected Lineup
| # | Player | Bats | wOBA vs. RHP | ISO vs. RHP | wOBA L14 | FD Position | FD Salary | DK Position | DK Salary |
| 1 | | LEFT | 0.382 | 0.242 | 0.406 | 2B | $2,700 | 2B/3B | $3,400 |
| 2 | | RIGHT | 0.321 | 0.096 | 0.396 | 3B | $2,900 | 3B | $3,700 |
| 3 | | LEFT | 0.370 | 0.151 | 0.360 | OF | $3,800 | OF | $4,500 |
| 4 | | RIGHT | 0.381 | 0.301 | 0.569 | OF | $4,800 | OF | $5,200 |
| 5 | | LEFT | 0.358 | 0.245 | 0.415 | 1B | $3,000 | 1B | $3,400 |
| 6 | | RIGHT | 0.288 | 0.122 | 0.470 | OF | $3,600 | OF | $4,000 |
| 7 | | RIGHT | 0.295 | 0.132 | 0.490 | C | $2,800 | C | $3,300 |
| 8 | | RIGHT | 0.270 | 0.088 | 0.270 | SS | $2,200 | SS | $2,800 |
| 9 | | RIGHT | 0.251 | 0.125 | 0.000 | P | $10,800 | P | $11,300 |
| | Team Averages | — | 0.324 | 0.167 | 0.375 | — | — | — | — |
Elite Plays – ,
Secondary Plays – ,
Stackability – Cash & GPP
Oakland at Boston – 7:10 PM
| Oakland | Boston |
 | |  | |
| RIGHT | RIGHT |
| Vegas Moneyline | Vegas Over/Under |
| BOS -120 | 8.5 |
| Stats | wOBA | HR All. | K% | BB% | Stats | wOBA | HR All. | K% | BB% |
| SP vs. Left | 0.267 | 10 | 21.7% | 7.8% | SP vs. Left | 0.300 | 6 | 22.7% | 5.6% |
| SP vs. Right | 0.282 | 12 | 19.1% | 7.5% | SP vs. Right | 0.306 | 5 | 19.9% | 6.7% |
Pitcher Grind Down
| Sonny Gray |
 | FanDuel | DraftKings |
| Salary: | $9,600 | Salary: | $6,800 |
| FPPG: | 30.2 | FPPG: | 14.4 |
| Pitcher Rating: | 48.9 | Pitcher Rank: | 14 |
| Statistics | Starts | SIERA | K% | SS% | BB% | GB% | FB% | HH% | O-K% |
| 2016 | 6 | 4.07 | 20.9% | 8.2% | 10.5% | 56.9% | 27.5% | 29.8% | 10 |
| 2015 | 31 | 3.80 | 20.3% | 9.7% | 7.1% | 52.7% | 30.7% | 25.1% | 3 |
Gray may not be pitching as bad as his 4.84 ERA suggests, but he isn’t having the best season thus far. In his first six starts, he has a 4.07 SIERA with a strikeout rate of 20.9%. He is producing a much lower swinging strike rate (8.2%) and his walk rate is up. I expect him to turn it around eventually, but that’s not likely to happen tonight against the Red Sox. DraftKings is trying to lure us into playing him with a $6,800 price tag, but there is more risk than potential reward here.
| Clay Buchholz |
 | FanDuel | DraftKings |
| Salary: | $8,000 | Salary: | $7,100 |
| FPPG: | 20.8 | FPPG: | 9.6 |
| Pitcher Rating: | 67.9 | Pitcher Rank: | 7 |
| Statistics | Starts | SIERA | K% | SS% | BB% | GB% | FB% | HH% | O-K% |
| 2016 | 6 | 4.86 | 16.8% | 8.4% | 10.1% | 41.0% | 40.0% | 29.0% | 7 |
| 2015 | 18 | 3.35 | 22.8% | 10.6% | 4.9% | 48.3% | 30.5% | 23.7% | 4 |
Buchholz has not looked good in his first six starts of the season. He has a 4.86 SIERA with a walk rate over 10%. His swinging strike rate is way down, which has led to a much lower strikeout rate of 16.8%. Basically, he is a wildcard at this point. Until he can rediscover his form from a season ago, he can be avoided in cash games. I’m a little intrigued for GPPs, but his price is high enough that I’m not looking to roster Buchholz in any league format tonight.
Batter Grind Down
Oakland
- Athletics Offense
Team wOBA vs. RHP — 0.307 (23 of 30)
Team ISO vs. RHP — 0.146 (21 of 30)
Runs Per Game — 3.66 (22 of 30)
Projected Run Total — 4.13 (16 of 26)
The A’s see a nice ballpark boost tonight playing in Fenway Park. They draw a decent matchup against , who has struggled to start the season. Buchholz has held both left and right-handed hitters under a .310 wOBA over the last two seasons, but you can look to a few of the left-handed bats in this lineup.
Projected Lineup
| # | Player | Bats | wOBA vs. RHP | ISO vs. RHP | wOBA L14 | FD Position | FD Salary | DK Position | DK Salary |
| 1 | | SWITCH | 0.301 | 0.093 | 0.255 | OF | $3,000 | OF | $4,200 |
| 2 | | SWITCH | 0.288 | 0.116 | 0.357 | 2B | $2,600 | 2B | $3,200 |
| 3 | | LEFT | 0.365 | 0.191 | 0.383 | OF | $3,000 | OF | $3,900 |
| 4 | | RIGHT | 0.350 | 0.254 | 0.349 | OF | $3,100 | OF | $3,700 |
| 5 | | LEFT | 0.345 | 0.203 | 0.284 | C | $2,700 | C | $3,400 |
| 6 | | RIGHT | 0.361 | 0.231 | 0.177 | 3B | $2,300 | 3B | $3,500 |
| 7 | | RIGHT | 0.307 | 0.132 | 0.213 | 1B | $2,200 | 1B | $3,500 |
| 8 | | LEFT | 0.321 | 0.108 | 0.382 | 1B | $2,300 | 1B | $3,200 |
| 9 | | RIGHT | 0.290 | 0.148 | 0.378 | SS | $2,500 | SS | $3,400 |
| | Team Averages | — | 0.325 | 0.164 | 0.309 | — | — | — | — |
Elite Plays –
Secondary Plays – ,
Stackability – NONE
Boston
- Red Sox Offense
Team wOBA vs. RHP — 0.319 (4 of 30)
Team ISO vs. RHP — 0.150 (11 of 30)
Runs Per Game — 5.03 (4 of 30)
Projected Run Total — 4.37 (10 of 26)
The Red Sox are one of the best offenses in baseball against right-handed pitching. Over the last two seasons, they are ranked fourth in team wOBA and 11th in team ISO. Even though their matchup against is less than ideal, Boston has the tenth highest team total on the board at 4.37 runs. , , , and have all been swinging hot bats with a .375+ wOBA over the last 14 days.
Projected Lineup
| # | Player | Bats | wOBA vs. RHP | ISO vs. RHP | wOBA L14 | FD Position | FD Salary | DK Position | DK Salary |
| 1 | | RIGHT | 0.344 | 0.183 | 0.253 | OF | $4,000 | OF | $4,500 |
| 2 | | RIGHT | 0.356 | 0.155 | 0.377 | 2B | $3,200 | 2B | $4,000 |
| 3 | | RIGHT | 0.324 | 0.104 | 0.373 | SS | $3,900 | SS | $4,000 |
| 4 | | LEFT | 0.423 | 0.336 | 0.431 | 1B | $3,900 | 1B | $4,900 |
| 5 | | RIGHT | 0.317 | 0.155 | 0.391 | 1B | $3,600 | 1B | $4,100 |
| 6 | | LEFT | 0.357 | 0.194 | 0.348 | 3B | $3,000 | 3B | $3,400 |
| 7 | | LEFT | 0.312 | 0.102 | 0.285 | OF | $2,900 | OF | $3,100 |
| 8 | | LEFT | 0.348 | 0.258 | 0.470 | OF | $3,200 | OF | $3,400 |
| 9 | | RIGHT | 0.270 | 0.158 | 0.293 | C | $2,200 | C | $2,900 |
| | Team Averages | — | 0.339 | 0.183 | 0.358 | — | — | — | — |
Elite Plays –
Secondary Plays – , , ,
Stackability – GPP
Pittsburgh at Cincinnati – 7:10 PM
| Pittsburgh | Cincinnati |
 | |  | |
| LEFT | RIGHT |
| Vegas Moneyline | Vegas Over/Under |
| PIT -125 | 9.0 |
| Stats | wOBA | HR All. | K% | BB% | Stats | wOBA | HR All. | K% | BB% |
| SP vs. Left | 0.351 | 5 | 17.1% | 4.7% | SP vs. Left | 0.296 | 3 | 13.7% | 15.7% |
| SP vs. Right | 0.343 | 22 | 14.4% | 8.2% | SP vs. Right | 0.325 | 4 | 26.5% | 6.1% |
Pitcher Grind Down
| Jon Niese |
 | FanDuel | DraftKings |
| Salary: | $5,800 | Salary: | $5,000 |
| FPPG: | 20.7 | FPPG: | 8.3 |
| Pitcher Rating: | 47.9 | Pitcher Rank: | 15 |
| Statistics | Starts | SIERA | K% | SS% | BB% | GB% | FB% | HH% | O-K% |
| 2016 | 6 | 4.64 | 16.2% | 6.7% | 9.1% | 49.5% | 34.2% | 30.1% | 7 |
| 2015 | 29 | 4.27 | 14.7% | 5.8% | 7.1% | 54.5% | 24.7% | 29.7% | 14 |
Niese has been one of the top pitchers to pick on this season. While he does produce a lot of ground ball outs, that’s about the only thing that he has going for him. He has a 4.64 SIERA with a low strikeout rate and a hard hit contact rate of 30.1%. He may be a small favorite tonight against the Reds, but the total for the game is set at 9.0 runs. Both of these pitchers can be avoided in what is expected to be a high scoring game.
| Dan Straily |
 | FanDuel | DraftKings |
| Salary: | $6,500 | Salary: | $4,900 |
| FPPG: | 20.7 | FPPG: | 11.2 |
| Pitcher Rating: | 38.6 | Pitcher Rank: | 21 |
| Statistics | Starts | SIERA | K% | SS% | BB% | GB% | FB% | HH% | O-K% |
| 2016 | 4 | 4.45 | 21.0% | 12.1% | 11.3% | 35.4% | 41.8% | 32.1% | 4 |
| 2015 | 3 | 4.67 | 18.4% | 9.6% | 10.5% | 41.5% | 37.7% | 28.3% | 17 |
Straily may not have the best SIERA this season (4.45), but he has a swinging strike rate of 12.1%. He is walking a few too many batters, but you aren’t going to find many pitchers with his strikeout upside at this low of a price point. I’m not saying that you should be looking at Straily in cash games, but he is certainly worth a look in tournaments at a price of only $4,900 on DraftKings.
Batter Grind Down
Pittsburgh
- Pirates Offense
Team wOBA vs. RHP — 0.316 (9 of 30)
Team ISO vs. RHP — 0.140 (26 of 30)
Runs Per Game — 5.03 (4 of 30)
Projected Run Total — 4.65 (6 of 26)
The Pirates have the sixth highest team total on the board tonight. They see a small ballpark boost playing in the Great American Ballpark and they hit right-handed pitching well as a team. The sample size is small, but over the last two seasons (seven starts), Straily has allowed a .325 wOBA to right-handed hitters. We always like targeting hitters against fly-ball pitchers and tonight presents a nice opportunity with the Pirates.
Projected Lineup
| # | Player | Bats | wOBA vs. RHP | ISO vs. RHP | wOBA L14 | FD Position | FD Salary | DK Position | DK Salary |
| 1 | | LEFT | 0.361 | 0.178 | 0.261 | 1B | $3,000 | 1B | $3,800 |
| 2 | | RIGHT | 0.366 | 0.192 | 0.382 | OF | $4,000 | OF | $5,300 |
| 3 | | LEFT | 0.336 | 0.148 | 0.365 | OF | $3,200 | OF | $5,000 |
| 4 | | RIGHT | 0.358 | 0.161 | 0.394 | OF | $4,000 | OF | $5,300 |
| 5 | | RIGHT | 0.334 | 0.086 | 0.347 | C | $2,900 | C | $3,600 |
| 6 | Jung Ho Kang | RIGHT | 0.359 | 0.178 | 0.516 | 3B | $3,000 | 3B/SS | $4,000 |
| 7 | | RIGHT | 0.309 | 0.106 | 0.345 | 2B | $3,300 | 2B | $4,200 |
| 8 | | RIGHT | 0.264 | 0.068 | 0.312 | SS | $2,600 | SS | $3,400 |
| 9 | | LEFT | 0.205 | 0.022 | 0.354 | P | $5,800 | P | $5,000 |
| | Team Averages | — | 0.321 | 0.127 | 0.364 | — | — | — | — |
Elite Plays –
Secondary Plays – , , , Jung Ho Kang
Stackability – GPP
Cincinnati
- Reds Offense
Team wOBA vs. LHP — 0.310 (20 of 30)
Team ISO vs. LHP — 0.152 (11 of 30)
Runs Per Game — 4.13 (18 of 30)
Projected Run Total — 4.35 (11 of 26)
The Reds are coming off of a nice offensive series against the Brewers. They will look to carry some of that momentum into tonight’s game against .
Projected Lineup
| # | Player | Bats | wOBA vs. LHP | ISO vs. LHP | wOBA L14 | FD Position | FD Salary | DK Position | DK Salary |
| 1 | | RIGHT | 0.374 | 0.211 | 0.337 | SS | $3,600 | SS | $4,100 |
| 2 | | RIGHT | 0.384 | 0.216 | 0.250 | 3B | $2,900 | 3B | $4,600 |
| 3 | | LEFT | 0.405 | 0.178 | 0.394 | 1B | $3,800 | 1B | $4,500 |
| 4 | | RIGHT | 0.336 | 0.114 | 0.398 | 2B | $3,100 | 2B | $4,100 |
| 5 | | LEFT | 0.280 | 0.148 | 0.285 | OF | $3,600 | OF | $4,000 |
| 6 | | RIGHT | 0.265 | 0.088 | 0.329 | OF | $3,200 | OF | $3,500 |
| 7 | | SWITCH | 0.214 | 0.018 | 0.246 | C | $2,000 | C | $2,300 |
| 8 | | RIGHT | 0.000 | 0.000 | 0.000 | P | $6,500 | P | $4,900 |
| 9 | | SWITCH | 0.293 | 0.153 | 0.260 | OF | $2,600 | OF | $4,300 |
| | Team Averages | — | 0.283 | 0.125 | 0.278 | — | — | — | — |
Elite Plays – ,
Secondary Plays – , ,
Stackability – GPP
Jump to Page 1 2 3
