MLB Grind Down: Saturday, May 14 - Page Three

by
Ryan138 Last Updated
2016-05-14 15:39:23 Toronto at Texas – 8:05 PM
| Toronto | Texas |
 | |  | |
| RIGHT | RIGHT |
| Vegas Moneyline | Vegas Over/Under |
| TOR -125 | 9.5 |
| Stats | wOBA | HR All. | K% | BB% | Stats | wOBA | HR All. | K% | BB% |
| SP vs. Left | 0.279 | 17 | 17.9% | 8.1% | SP vs. Left | 0.329 | 17 | 13.9% | 5.6% |
| SP vs. Right | 0.269 | 10 | 20.5% | 7.6% | SP vs. Right | 0.311 | 18 | 19.8% | 4.7% |
Pitcher Grind Down
| Marco Estrada |
 | FanDuel | DraftKings |
| Salary: | $8,100 | Salary: | $8,100 |
| FPPG: | 33.8 | FPPG: | 19.4 |
| Pitcher Rating: | 36.5 | Pitcher Rank: | 27 |
| Statistics | Starts | SIERA | K% | BB% | SS% | GB% | FB% | HH% | HR/9 |
| L14 Days | 2 | 3.60 | 22.5% | 6.1% | 13.6% | 54.3% | 40.0% | 45.7% | 1.38 |
| 2016 | 6 | 3.96 | 23.7% | 9.2% | 10.2% | 42.6% | 44.6% | 33.3% | 0.72 |
| 2015 | 28 | 4.64 | 18.1% | 7.6% | 9.9% | 32.2% | 52.3% | 27.4% | 1.19 |
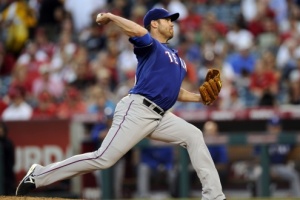
I am sure Estrada is happy that he gets to leave Rogers Centre only to pitch in another hitters park at Globe Life. With that said, Estrada has been solid this year as he has put up a 3.96 SIERA (2.39 ERA) to go along with a solid 23.7% strikeout rate. The park and matchup are not ideal, but Estrada can be used as a deep GPP play or SP2 today.
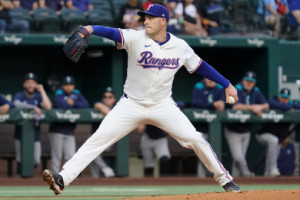
| Colby Lewis |
 | FanDuel | DraftKings |
| Salary: | $7,600 | Salary: | $7,200 |
| FPPG: | 29.6 | FPPG: | 15.2 |
| Pitcher Rating: | 37.8 | Pitcher Rank: | 26 |
| Statistics | Starts | SIERA | K% | BB% | SS% | GB% | FB% | HH% | HR/9 |
| L14 Days | 3 | 4.34 | 14.8% | 2.5% | 9.5% | 37.9% | 40.9% | 34.9% | 1.29 |
| 2016 | 7 | 4.49 | 17.4% | 6.5% | 8.7% | 36.2% | 44.9% | 36.0% | 1.80 |
| 2015 | 33 | 4.43 | 16.5% | 4.9% | 8.2% | 33.7% | 44.2% | 33.3% | 1.14 |
Lewis is everyone’s favorite target in DFS in terms of offenses against. That should be true again tonight, as Lewis has to face a high-powered offense. Lewis’ main problem has always been the home run ball, which has continued to be true as he comes into this game with a HR/9 of 1.80. He is an easy avoid against this Blue Jays offense.
Batter Grind Down
Toronto
Targeting the Blue Jays offense looks to be the better situation tonight than the Rangers as they feature a team total of 4.90, which is the sixth highest team total of the night slate. Lewis has allowed a wOBA of .355 to lefties this year and .316 to batters from the right side of the plate.
- Blue Jays Offense (2016)
Team wOBA vs. RHP — 0.309 (18 of 30)
Team ISO vs. RHP — 0.153 (16 of 30)
Team K% vs. RHP — 24.4% (25 of 30)
Runs Per Game — 4.03 (21 of 30)
Projected Run Total — 4.90 (8 of 30)
Projected Lineup
| # | Player | Bats | wOBA vs. RHP | ISO vs. RHP | wOBA L14 | FD Position | FD Salary | DK Position | DK Salary |
| 1 | | LEFT | 0.346 | 0.142 | 0.427 | OF | $3,300 | OF | $3,700 |
| 2 | | RIGHT | 0.384 | 0.253 | 0.367 | 3B | $4,300 | 3B | $5,000 |
| 3 | | RIGHT | 0.387 | 0.290 | 0.273 | OF | $4,100 | OF | $4,500 |
| 4 | | RIGHT | 0.378 | 0.265 | 0.321 | 1B | $3,800 | 1B | $4,800 |
| 5 | | SWITCH | 0.347 | 0.226 | 0.429 | 1B | $2,700 | 1B | $3,400 |
| 6 | | RIGHT | 0.317 | 0.164 | 0.230 | SS | $2,800 | SS | $3,800 |
| 7 | | RIGHT | 0.313 | 0.132 | 0.369 | OF | $3,200 | OF | $3,900 |
| 8 | | RIGHT | 0.299 | 0.179 | 0.185 | C | $2,200 | C | $3,200 |
| 9 | | LEFT | 0.287 | 0.100 | 0.205 | 2B | $2,100 | 2B | $2,500 |
| | Team Averages | — | 0.340 | 0.195 | 0.312 | — | — | — | — |
Elite Plays – , ,
Secondary Plays – , ,
Stackability – Cash & GPP
Texas
While we didn’t see the runs scored yesterday that we were expecting, it is not a bad idea to go right back to the well as this game features a high 9.5 overall total. The Rangers have a team total of 4.60, which is the tenth highest of the overall slate and eighth highest of the night.
- Rangers Offense (2016)
Team wOBA vs. RHP — 0.314 (15 of 30)
Team wOBA vs. RHP — 0.157 (14 of 30)
Team K% vs. RHP — 24.4% (4 of 30)
Runs Per Game — 4.74 (6 of 30)
Projected Run Total — 4.60 (10 of 30)
Projected Lineup
| # | Player | Bats | wOBA vs. RHP | wOBA vs. RHP | wOBA L14 | FD Position | FD Salary | DK Position | DK Salary |
| 1 | | LEFT | 0.341 | 0.229 | 0.455 | 2B | $4,300 | 2B | $4,500 |
| 2 | | RIGHT | 0.287 | 0.138 | 0.392 | OF | $3,700 | OF | $4,100 |
| 3 | | LEFT | 0.388 | 0.203 | 0.319 | OF | $3,200 | OF | $3,400 |
| 4 | | RIGHT | 0.308 | 0.140 | 0.318 | 3B | $3,400 | 3B | $3,900 |
| 5 | | LEFT | 0.364 | 0.150 | 0.256 | 1B | $2,800 | 1B | $3,700 |
| 6 | | LEFT | 0.365 | 0.223 | 0.335 | OF | $3,300 | 1B | $3,600 |
| 7 | | RIGHT | 0.277 | 0.077 | 0.230 | SS | $3,200 | SS | $3,400 |
| 8 | | RIGHT | 0.255 | 0.145 | 0.461 | OF | $2,200 | 1B/OF | $2,400 |
| 9 | | RIGHT | 0.273 | 0.091 | 0.420 | C | $2,100 | C | $3,800 |
| | Team Averages | — | 0.318 | 0.155 | 0.354 | — | — | — | — |
Elite Plays – ,
Secondary Plays – ,
Stackability – GPP
NY Mets at Colorado – 8:10 PM
| NY Mets | Colorado |
 | |  | |
| RIGHT | RIGHT |
| Vegas Moneyline | Vegas Over/Under |
| NYM -110 | 10.5 |
| Stats | wOBA | HR All. | K% | BB% | Stats | wOBA | HR All. | K% | BB% |
| SP vs. Left | 0.271 | 5 | 18.7% | 7.9% | SP vs. Left | 0.437 | 9 | 10.8% | 14.6% |
| SP vs. Right | 0.269 | 3 | 22.1% | 8.1% | SP vs. Right | 0.342 | 6 | 16.1% | 6.6% |
Pitcher Grind Down
| Logan Verrett |
 | FanDuel | DraftKings |
| Salary: | $5,600 | Salary: | $6,000 |
| FPPG: | 14.2 | FPPG: | 7.4 |
| Pitcher Rating: | 34.1 | Pitcher Rank: | 28 |
| Statistics | Starts | SIERA | K% | BB% | SS% | GB% | FB% | HH% | HR/9 |
| L14 Days | 0 | 3.65 | 18.2% | 4.6% | 6.2% | 41.2% | 35.3% | 41.2% | 3.60 |
| 2016 | 2 | 3.98 | 20.0% | 8.2% | 10.5% | 47.5% | 34.4% | 34.4% | 0.84 |
| 2015 | 4 | 3.90 | 20.5% | 7.9% | 11.8% | 44.6% | 39.2% | 26.9% | 1.13 |
Verrett has been a useful pitcher in the past for DFS purposes as he always comes very cheap, has pitched solid at times and does have a 20.0% strikeout rate. The problem is always how many innings he will pitch as he has not pitched more than two out of the bullpen since his last start on April 19th. All that can be thrown out the window as he makes the start in Coors and should be avoided.
| Eddie Butler |
 | FanDuel | DraftKings |
| Salary: | $5,400 | Salary: | $4,700 |
| FPPG: | 25.0 | FPPG: | 13.7 |
| Pitcher Rating: | 21.2 | Pitcher Rank: | 30 |
| Statistics | Starts | SIERA | K% | BB% | SS% | GB% | FB% | HH% | HR/9 |
| L14 Days | 2 | 4.00 | 20.0% | 6.7% | 9.9% | 46.9% | 37.5% | 46.9% | 1.54 |
| 2016 | 2 | 3.27 | 24.1% | 5.6% | 9.9% | 48.6% | 32.4% | 40.5% | 1.29 |
| 2015 | 16 | 5.38 | 11.9% | 11.4% | 6.9% | 50.0% | 27.9% | 26.8% | 1.47 |
Butler is someone we don’t have to spend too much time on when pitching in Coors. Although he does have a solid 24.1% strikeout rate this year, he had just a 11.9% K rate last year. Avoid him in a Coors game today against the Mets.
Batter Grind Down
NY Mets
The Mets have a slightly higher team total than the Rockies in this game at 5.31. Bulter has struggled from the left side of the plate (.309 wOBA) much more than the right side of the plate (.259 wOBA). The usual suspects are in play today for the Mets.
- Mets Offense (2016)
Team wOBA vs. RHP — 0.330 (7 of 30)
Team ISO vs. RHP — 0.205 (3 of 30)
Team K% vs. RHP — 21.7% (20 of 30)
Runs Per Game — 4.33 (14 of 30)
Projected Run Total — 5.31 (2 of 30)
Projected Lineup
| # | Player | Bats | wOBA vs. RHP | ISO vs. RHP | wOBA L14 | FD Position | FD Salary | DK Position | DK Salary |
| 1 | | LEFT | 0.372 | 0.220 | 0.231 | OF | $3,700 | OF | $5,400 |
| 2 | | RIGHT | 0.345 | 0.148 | 0.414 | 3B | $3,600 | 3B | $5,400 |
| 3 | | LEFT | 0.391 | 0.270 | 0.280 | OF | $4,000 | OF | $4,800 |
| 4 | | RIGHT | 0.385 | 0.276 | 0.406 | OF | $5,000 | OF | $5,600 |
| 5 | | LEFT | 0.357 | 0.238 | 0.359 | 1B | $3,800 | 1B | $5,300 |
| 6 | | SWITCH | 0.334 | 0.185 | 0.186 | 2B | $3,500 | 2B | $4,800 |
| 7 | | SWITCH | 0.326 | 0.166 | 0.326 | SS | $3,500 | SS | $4,300 |
| 8 | | RIGHT | 0.229 | 0.123 | 0.324 | C | $2,200 | C | $3,100 |
| 9 | | RIGHT | 0.180 | 0.143 | | P | $5,600 | P | $6,000 |
| | Team Averages | — | 0.324 | 0.197 | 0.316 | — | — | — | — |
Elite Plays – , , ,
Secondary Plays – , ,
Stackability – Cash & GPP
Colorado
The Rockies have the third highest total of the day at 5.19 runs against Verrett. They have enough capable batters from both sides of the plate to fill lineups in all formats with Colorado hitters.
- Rockies Offense (2016)
Team wOBA vs. RHP — 0.331 (6 of 30)
Team wOBA vs. RHP — 0.177 (8 of 30)
Team K% vs. RHP — 21.7% (6 of 30)
Runs Per Game — 5.18 (4 of 30)
Projected Run Total — 5.19 (3 of 30)
Projected Lineup
| # | Player | Bats | wOBA vs. RHP | wOBA vs. RHP | wOBA L14 | FD Position | FD Salary | DK Position | DK Salary |
| 1 | | LEFT | 0.351 | 0.174 | 0.385 | OF | $4,500 | OF | $5,100 |
| 2 | | RIGHT | 0.348 | 0.299 | 0.378 | SS | $4,600 | SS | $5,200 |
| 3 | | LEFT | 0.408 | 0.301 | 0.290 | OF | $4,000 | OF | $5,000 |
| 4 | | RIGHT | 0.391 | 0.312 | 0.471 | 3B | $5,200 | 3B | $5,500 |
| 5 | | LEFT | 0.338 | 0.167 | 0.374 | OF | $4,300 | OF | $4,700 |
| 6 | | RIGHT | 0.324 | 0.167 | 0.337 | 1B | $3,800 | 1B | $4,100 |
| 7 | | RIGHT | 0.328 | 0.104 | 0.290 | 2B | $3,600 | 2B | $4,100 |
| 8 | | LEFT | 0.241 | 0.064 | 0.285 | C | $3,300 | C | $2,800 |
| 9 | | RIGHT | 0.040 | 0.000 | 0.000 | P | $5,400 | P | $4,700 |
| | Team Averages | — | 0.308 | 0.176 | 0.312 | — | — | — | — |
Elite Plays – , ,
Secondary Plays – ,
Stackability – Cash & GPP
San Francisco at Arizona – 8:10 PM
| San Francisco | Arizona |
 | |  | |
| RIGHT | LEFT |
| Vegas Moneyline | Vegas Over/Under |
| ARI -130 | 9.5 |
| Stats | wOBA | HR All. | K% | BB% | Stats | wOBA | HR All. | K% | BB% |
| SP vs. Left | 0.330 | 8 | 18.3% | 6.9% | SP vs. Left | 0.241 | 2 | 30.6% | 7.2% |
| SP vs. Right | 0.342 | 11 | 17.3% | 5.6% | SP vs. Right | 0.348 | 15 | 16.8% | 4.9% |
Pitcher Grind Down
| Jake Peavy |
 | FanDuel | DraftKings |
| Salary: | $6,000 | Salary: | $5,600 |
| FPPG: | 15.9 | FPPG: | 5.6 |
| Pitcher Rating: | 39.2 | Pitcher Rank: | 25 |
| Statistics | Starts | SIERA | K% | BB% | SS% | GB% | FB% | HH% | HR/9 |
| L14 Days | 3 | 4.87 | 25.4% | 16.4% | 13.1% | 31.6% | 52.6% | 43.6% | 3.46 |
| 2016 | 7 | 4.41 | 18.9% | 7.9% | 12.4% | 38.5% | 43.6% | 36.1% | 1.85 |
| 2015 | 19 | 4.33 | 17.4% | 5.6% | 8.0% | 37.9% | 45.1% | 26.5% | 0.98 |
Peavy has had a real rough go at it to start of this season. He comes into this game with an extremely high 8.47 ERA, which he actually dropped after his last start. His SIERA of 4.42 shows some improvement should be in order soon, but Peavy is way to hard to trust at the moment and is not striking batters out at a rate high enough (18.9%) to offset his struggles. Avoid him in a hitter friendly Arizona park.
| Patrick Corbin |
 | FanDuel | DraftKings |
| Salary: | $7,300 | Salary: | $6,100 |
| FPPG: | 20.9 | FPPG: | 10.5 |
| Pitcher Rating: | 62.3 | Pitcher Rank: | 11 |
| Statistics | Starts | SIERA | K% | BB% | SS% | GB% | FB% | HH% | HR/9 |
| L14 Days | 2 | 3.41 | 18.0% | 4.0% | 12.8% | 58.3% | 22.2% | 39.5% | 0.73 |
| 2016 | 7 | 4.28 | 15.3% | 6.6% | 9.3% | 54.0% | 29.9% | 40.1% | 1.65 |
| 2015 | 16 | 3.44 | 21.9% | 4.8% | 10.8% | 46.9% | 29.5% | 31.5% | 0.95 |
Corbin is coming off his best start of the season as he went seven strong innings of zero earned run ball, with five strikeouts. He will look to improve on that outing as he comes into this matchup with a 4.30 SIERA, but a career low 15.3% strikeout rate. He has a tough matchup against the Giants today, but is cheap enough to warrant a tournament play or SP2.
Batter Grind Down
San Francisco
While Corbin could be given a though for tournaments, the Giants offense is also in play today. They have a solid team total of 4.57 today and if you are looking to target the batters, look for the righties as Corbin has some drastic splits this year (.220 wOBA to lefties/.364 wOBA to righties).
- Giants Offense (2016)
Team wOBA vs. LHP — 0.331 (10 of 30)
Team wOBA vs. LHP — 0.134 (21 of 30)
Team K% vs. LHP — 17.9% (2 of 30)
Runs Per Game — 4.64 (8 of 30)
Projected Run Total — 4.57 (11 of 30)
Projected Lineup
| # | Player | Bats | wOBA vs. LHP | wOBA vs. LHP | wOBA L14 | FD Position | FD Salary | DK Position | DK Salary |
| 1 | | LEFT | 0.235 | 0.054 | 0.315 | OF | $3,500 | OF | $3,700 |
| 2 | Matt Duffy | RIGHT | 0.353 | 0.143 | 0.306 | 3B | $3,000 | 3B | $4,000 |
| 3 | | RIGHT | 0.371 | 0.184 | 0.356 | C | $3,400 | C | $4,200 |
| 4 | | LEFT | 0.371 | 0.212 | 0.450 | 1B | $4,100 | 1B | $4,400 |
| 5 | | LEFT | 0.297 | 0.142 | 0.299 | SS | $3,200 | SS | $3,600 |
| 6 | | RIGHT | 0.293 | 0.160 | 0.355 | OF | $3,800 | OF | $4,300 |
| 7 | | RIGHT | 0.389 | 0.125 | 0.416 | 2B | $2,700 | 2B/SS | $3,400 |
| 8 | | LEFT | 0.336 | 0.133 | 0.198 | OF | $2,300 | OF | $3,200 |
| 9 | | RIGHT | 0.196 | 0.000 | 0.000 | P | $6,000 | P | $5,600 |
| | Team Averages | — | 0.316 | 0.128 | 0.299 | — | — | — | — |
Elite Plays – Matt Duffy, ,
Secondary Plays –
Stackability – GPP
Arizona
Arizona has a projected run total of 4.93 in this matchup. Peavy has really struggled this year as he has allowed a .500 wOBA to lefties and a .410 wOBA to righties. While everyone will be attacking the Coors game tonight, the Diamondbacks make for a great offense to target and should be slightly lower owned than the Coors bats.
- Diamondbacks Offense (2016)
Team wOBA vs. RHP — 0.330 (7 of 30)
Team wOBA vs. RHP — 0.179 (7 of 30)
Team K% vs. RHP — 17.9% (17 of 30)
Runs Per Game — 4.67 (7 of 30)
Projected Run Total — 4.93 (4 of 30)
Projected Lineup
| # | Player | Bats | wOBA vs. RHP | wOBA vs. RHP | wOBA L14 | FD Position | FD Salary | DK Position | DK Salary |
| 1 | | RIGHT | 0.287 | 0.099 | 0.390 | 2B | $3,600 | 2B | $4,400 |
| 2 | | RIGHT | 0.338 | 0.234 | 0.354 | OF | $2,700 | 3B/OF | $2,700 |
| 3 | | RIGHT | 0.405 | 0.248 | 0.341 | 1B | $4,000 | 1B | $4,900 |
| 4 | | LEFT | 0.336 | 0.152 | 0.299 | 3B | $3,100 | 3B | $3,800 |
| 5 | | RIGHT | 0.300 | 0.113 | 0.373 | OF | $3,600 | OF | $3,500 |
| 6 | | RIGHT | 0.317 | 0.195 | 0.375 | C | $3,200 | C | $3,700 |
| 7 | | RIGHT | 0.268 | 0.090 | 0.314 | OF | $2,100 | OF | $3,300 |
| 8 | | LEFT | 0.244 | 0.067 | 0.319 | P | $7,300 | P | $6,100 |
| 9 | | RIGHT | 0.247 | 0.119 | 0.185 | SS | $2,200 | SS | $2,400 |
| | Team Averages | — | 0.305 | 0.146 | 0.328 | — | — | — | — |
Elite Plays – , ,
Secondary Plays – , , Wellington Castillo
Stackability – Cash & GPP
LA Angels at Seattle – 9:10 PM
| LA Angels | Seattle |
 | |  | |
| RIGHT | RIGHT |
| Vegas Moneyline | Vegas Over/Under |
| SEA -160 | 7.5 |
| Stats | wOBA | HR All. | K% | BB% | Stats | wOBA | HR All. | K% | BB% |
| SP vs. Left | 0.364 | 6 | 14.8% | 11.1% | SP vs. Left | 0.309 | 9 | 20.9% | 4.9% |
| SP vs. Right | 0.285 | 2 | 26.7% | 5.0% | SP vs. Right | 0.293 | 13 | 21.1% | 4.8% |
Pitcher Grind Down
| Jhoulys Chacin |
 | FanDuel | DraftKings |
| Salary: | $6,100 | Salary: | $5,900 |
| FPPG: | 25.0 | FPPG: | 12.8 |
| Pitcher Rating: | 64.2 | Pitcher Rank: | 10 |
| Statistics | Starts | SIERA | K% | BB% | SS% | GB% | FB% | HH% | HR/9 |
| L14 Days | 2 | 5.11 | 16.7% | 12.5% | 6.0% | 42.4% | 27.3% | 33.3% | 3.72 |
| 2016 | 5 | 3.55 | 23.1% | 6.8% | 10.7% | 48.1% | 29.1% | 35.8% | 1.35 |
| 2015 | 4 | 4.28 | 18.9% | 9.0% | 8.9% | 47.4% | 33.3% | 38.8% | 1.35 |
Chacin was traded to a better team on paper, now they just need to start playing like it. Chacin is coming off his worst performance of the year, but was pitching decent prior. He currently sports a 3.57 SIERA to go along with a solid strikeout rate of 23.1%. The advanced stats show a pitcher that could put up some fantasy numbers today in a matchup with the Mariners who are ranked 11th and 12th in wOBA and ISO respectively.
| Hisashi Iwakuma |
 | FanDuel | DraftKings |
| Salary: | $8,000 | Salary: | $7,700 |
| FPPG: | 27.0 | FPPG: | 13.7 |
| Pitcher Rating: | 79.7 | Pitcher Rank: | 4 |
| Statistics | Starts | SIERA | K% | BB% | SS% | GB% | FB% | HH% | HR/9 |
| L14 Days | 2 | 3.61 | 22.5% | 8.2% | 13.4% | 51.5% | 21.2% | 23.5% | 0.00 |
| 2016 | 7 | 4.05 | 19.6% | 7.1% | 9.4% | 45.0% | 32.1% | 26.5% | 0.84 |
| 2015 | 20 | 3.36 | 21.5% | 4.1% | 10.6% | 50.4% | 31.1% | 26.9% | 1.25 |
Iwakuma has not been great this year, but has also not been terrible. He sports a 4.07 SIERA after his first seven starts as well as a 19.6% strikeout rate. He gets a solid matchup against this Angels offense who are ranked at the bottom of the league in ISO and wOBA against righties. While it is tough to trust a great performance out of Iwakuma, he is not a terrible play in any format tonight.
Batter Grind Down
LA Angels
While Iwakuma can be attacked from both sides of the plate (330/333 wOBA to LH and RH batters), the Angels have just a projected run total of 3.40, which is the third lowest of the entire day. Trout is always in play, but the rest of the offense can be avoided.
- Angels Offense (2016)
Team wOBA vs. RHP — 0.284 (27 of 30)
Team ISO vs. RHP — 0.108 (29 of 30)
Team K% vs. RHP — 15.9% (2 of 30)
Runs Per Game — 3.42 (27 of 30)
Projected Run Total — 3.40 (28 of 30)
Projected Lineup
| # | Player | Bats | wOBA vs. RHP | ISO vs. RHP | wOBA L14 | FD Position | FD Salary | DK Position | DK Salary |
| 1 | | RIGHT | 0.341 | 0.101 | 0.361 | 3B | $3,100 | 3B | $3,200 |
| 2 | | LEFT | 0.325 | 0.166 | 0.366 | OF | $3,200 | OF | $3,600 |
| 3 | | RIGHT | 0.410 | 0.291 | 0.381 | OF | $4,500 | OF | $4,600 |
| 4 | | RIGHT | 0.328 | 0.219 | 0.306 | 1B | $3,300 | 1B | $3,500 |
| 5 | | RIGHT | 0.330 | 0.179 | 0.469 | 1B | $2,900 | 1B | $3,200 |
| 6 | | SWITCH | 0.253 | 0.045 | 0.291 | OF | $2,300 | OF | $2,500 |
| 7 | | LEFT | 0.294 | 0.106 | 0.220 | 2B | $2,100 | 2B | $2,700 |
| 8 | | RIGHT | 0.187 | 0.023 | 0.000 | SS | $2,000 | 2B/3B | $2,000 |
| 9 | | RIGHT | 0.287 | 0.105 | 0.157 | C | $2,000 | C | $2,100 |
| | Team Averages | — | 0.306 | 0.137 | 0.283 | — | — | — | — |
Elite Plays –
Secondary Plays –
Stackability – None
Seattle
The Mariners have a projected run total of 4.10, which is in the middle of the pack today. and have hit righties very well this year and are in play against Chacin.
- Mariners Offense (2016)
Team wOBA vs. RHP — 0.324 (11 of 30)
Team wOBA vs. RHP — 0.166 (12 of 30)
Team K% vs. RHP — 15.9% (16 of 30)
Runs Per Game — 4.47 (11 of 30)
Projected Run Total — 4.10 (16 of 30)
Projected Lineup
| # | Player | Bats | wOBA vs. RHP | wOBA vs. RHP | wOBA L14 | FD Position | FD Salary | DK Position | DK Salary |
| 1 | | LEFT | 0.318 | 0.111 | 0.341 | OF | $3,200 | OF | $3,500 |
| 2 | | SWITCH | 0.332 | 0.096 | 0.344 | SS | $3,100 | SS | $3,800 |
| 3 | | LEFT | 0.372 | 0.210 | 0.454 | 2B | $4,100 | 2B | $5,100 |
| 4 | | RIGHT | 0.365 | 0.224 | 0.361 | OF | $3,600 | OF | $4,100 |
| 5 | | LEFT | 0.330 | 0.185 | 0.452 | 3B | $3,800 | 3B | $4,200 |
| 6 | | LEFT | 0.348 | 0.198 | 0.315 | OF | $2,900 | OF | $3,400 |
| 7 | | LEFT | 0.348 | 0.181 | 0.149 | 1B | $2,100 | 1B | $3,400 |
| 8 | | RIGHT | 0.251 | 0.133 | 0.254 | C | $2,300 | C | $2,700 |
| 9 | | LEFT | 0.277 | 0.133 | 0.234 | OF | $2,800 | OF | $3,000 |
| | Team Averages | — | 0.327 | 0.163 | 0.323 | — | — | — | — |
Elite Plays – ,
Secondary Plays – ,
Stackability –
St. Louis at LA Dodgers – 9:10 PM
| St. Louis | LA Dodgers |
 | |  | |
| RIGHT | LEFT |
| Vegas Moneyline | Vegas Over/Under |
| STL -110 | 7.5 |
| Stats | wOBA | HR All. | K% | BB% | Stats | wOBA | HR All. | K% | BB% |
| SP vs. Left | 0.327 | 13 | 21.0% | 10.4% | SP vs. Left | 0.333 | 9 | 14.8% | 4.2% |
| SP vs. Right | 0.260 | 4 | 26.3% | 6.1% | SP vs. Right | 0.301 | 20 | 22.5% | 8.8% |
Pitcher Grind Down
| Carlos Martinez |
 | FanDuel | DraftKings |
| Salary: | $9,100 | Salary: | $9,700 |
| FPPG: | 31.3 | FPPG: | 16.7 |
| Pitcher Rating: | 79.0 | Pitcher Rank: | 5 |
| Statistics | Starts | SIERA | K% | BB% | SS% | GB% | FB% | HH% | HR/9 |
| L14 Days | 2 | 3.37 | 23.8% | 7.1% | 8.6% | 55.6% | 25.9% | 37.9% | 1.80 |
| 2016 | 6 | 4.01 | 20.0% | 7.3% | 8.9% | 50.0% | 34.9% | 31.5% | 0.95 |
| 2015 | 29 | 3.44 | 24.4% | 8.3% | 10.5% | 54.5% | 25.5% | 27.6% | 0.65 |
CMart has been solid for the Cardinals this year. He has a SIERA of 4.02 after his first six starts this season to go along with a solid 20.0% strikeout rate. He has a decent matchup against the Dodgers who are ranked in the bottom third of the league in both wOBA and ISO against right-handed pitching. There are not many solid pitching options tonight after Fernandez, making Martinez in play in all formats.
| Scott Kazmir |
 | FanDuel | DraftKings |
| Salary: | $7,400 | Salary: | $7,500 |
| FPPG: | 25.0 | FPPG: | 12.0 |
| Pitcher Rating: | 68.0 | Pitcher Rank: | 7 |
| Statistics | Starts | SIERA | K% | BB% | SS% | GB% | FB% | HH% | HR/9 |
| L14 Days | 2 | 3.74 | 26.8% | 8.9% | 12.3% | 29.4% | 52.9% | 38.2% | 2.92 |
| 2016 | 7 | 3.95 | 21.7% | 7.2% | 9.8% | 39.8% | 40.7% | 25.4% | 2.17 |
| 2015 | 31 | 4.10 | 20.3% | 7.7% | 10.3% | 42.9% | 37.3% | 25.7% | 0.98 |
Kazmir has not had the start of the season he had hoped for when moving to the Dodgers this year. He has now allowed at least two home runs in four of his seven starts (2.17 HR/9), while allowing at least four earned runs in four starts as well. He does have a sub 4.00 SIERA (3.96), which shows improvements should be coming soon and does sport a 21.7% strikeout rate. The matchup tonight is tough against a Cardinals squad that is ranked 12th in the league in both team wOBA and ISO against lefties.
Batter Grind Down
St. Louis
The run total is just 3.81, making this one of the lower scoring games of the night.
Kazmir has allowed a wOBA of at least .334 to batters on both sides of the plate. There are a ton of great offenses to target tonight and while some of the Cards are in play, stacking them will be a low owned play tonight.
- Cardinals Offense (2016)
Team wOBA vs. LHP — 0.330 (12 of 30)
Team wOBA vs. LHP — 0.159 (12 of 30)
Team K% vs. LHP — 20.8% (11 of 30)
Runs Per Game — 5.53 (3 of 30)
Projected Run Total — 3.81 (22 of 30)
Projected Lineup
| # | Player | Bats | wOBA vs. LHP | wOBA vs. LHP | wOBA L14 | FD Position | FD Salary | DK Position | DK Salary |
| 1 | | LEFT | 0.332 | 0.195 | 0.409 | 3B | $3,900 | 3B | $4,000 |
| 2 | | RIGHT | 0.436 | 0.244 | 0.383 | OF | $3,600 | OF | $4,000 |
| 3 | | RIGHT | 0.340 | 0.135 | 0.391 | OF | $2,800 | OF | $3,700 |
| 4 | | RIGHT | 0.326 | 0.225 | 0.304 | OF | $2,900 | OF | $3,000 |
| 5 | | RIGHT | 0.264 | 0.033 | 0.385 | C | $3,100 | C | $3,100 |
| 6 | | LEFT | 0.185 | 0.028 | 0.440 | 1B | $2,400 | 1B | $2,900 |
| 7 | | RIGHT | 0.333 | 0.154 | 0.230 | SS | $2,000 | 2B/SS | $3,100 |
| 8 | | RIGHT | 0.410 | 0.226 | 0.317 | SS | $3,200 | SS | $3,100 |
| 9 | | RIGHT | 0.033 | 0.000 | 0.000 | P | $9,100 | P | $9,700 |
| | Team Averages | — | 0.295 | 0.138 | 0.318 | — | — | — | — |
Elite Plays –
Secondary Plays – Stepehn Piscotty, ,
Stackability – GPP
LA Dodgers
Martinez has struggled a bit against left-handed bats this year as he has allowed a wOBA of .316 to lefties. This Dodgers squad has just a 3.69 team run total, which puts them in the bottom of the offenses to target on tonight’s night slate.
- Dodgers Offense (2016)
Team wOBA vs. RHP — 0.297 (23 of 30)
Team wOBA vs. RHP — 0.127 (27 of 30)
Team K% vs. RHP — 20.8% (21 of 30)
Runs Per Game — 4.15 (17 of 30)
Projected Run Total — 3.69 (24 of 30)
Projected Lineup
| # | Player | Bats | wOBA vs. RHP | wOBA vs. RHP | wOBA L14 | FD Position | FD Salary | DK Position | DK Salary |
| 1 | | LEFT | 0.307 | 0.145 | 0.372 | 2B | $3,100 | 2B | $3,400 |
| 2 | | LEFT | 0.374 | 0.193 | 0.380 | SS | $3,800 | SS | $3,500 |
| 3 | | RIGHT | 0.366 | 0.185 | 0.313 | 3B | $3,000 | 3B | $2,900 |
| 4 | | LEFT | 0.356 | 0.211 | 0.262 | 1B | $2,600 | 1B | $3,300 |
| 5 | | SWITCH | 0.333 | 0.183 | 0.317 | C | $3,000 | C | $2,900 |
| 6 | | LEFT | 0.354 | 0.224 | 0.369 | OF | $2,900 | OF | $3,300 |
| 7 | | RIGHT | 0.303 | 0.150 | 0.184 | OF | $2,400 | OF | $3,100 |
| 8 | | RIGHT | 0.244 | 0.081 | 0.068 | OF | $2,000 | OF | $2,700 |
| 9 | | LEFT | 0.110 | 0.000 | 0.000 | P | $7,400 | P | $7,500 |
| | Team Averages | — | 0.305 | 0.152 | 0.252 | — | — | — | — |
Elite Plays – None
Secondary Plays – , ,
Stackability – None
Jump to Page 1 2 3
