MLB Grind Down: Thursday, June 16th
The RotoGrinders MLB Grind Down will give you an in-depth analysis into the upcoming MLB schedule. This article will break down the numbers for every single game and give you analysis on which trends you can exploit. While matchups are a major factor in daily fantasy baseball, there are plenty of other factors to consider such as injuries, weather, and salaries.
The analysis should point you in the right direction, but it is still up to you to decipher the information and make your own selections. No sport has more variance than baseball. The best choice is not always the right choice but following the trends will win you money over time.
Note: As always, if you want to try a new DFS site, be sure to click through a RotoGrinders link and use our DraftKings promo code and FanDuel promo code to receive the best perks in the industry.
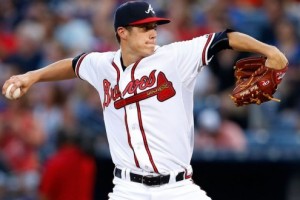
Cincinnati at Atlanta – 12:10 PM ET
| Cincinnati | Atlanta |
 | |  | |
| RIGHT | RIGHT |
| Vegas Moneyline | Vegas Over/Under |
| CIN -111 | 8.0 |
| Stats | wOBA | HR All. | K% | BB% | Stats | wOBA | HR All. | K% | BB% |
| SP vs. Left | 0.288 | 5 | 15.5% | 14.6% | SP vs. Left | 0.374 | 18 | 12.3% | 10.6% |
| SP vs. Right | 0.292 | 5 | 26.4% | 5.8% | SP vs. Right | 0.284 | 10 | 20.0% | 4.4% |
Pitcher Grind Down
| Dan Straily |
 | FanDuel | DraftKings |
| Salary: | $7,100 | Salary: | $9,200 |
| FPPG: | 27.5 | FPPG: | 14.7 |
| Pitcher Rating: | 62.3 | Pitcher Rank: | 12 |
| Statistics | Starts | PitchPS | SIERA | ERA | K% | BB% | SS% | GB% | FB% | HH% |
| L30 Days | 6 | 104.3 | 4.31 | 2.84 | 21.9% | 9.7% | 8.2% | 39.6% | 37.6% | 30.8% |
| 2016 | 11 | 112.4 | 4.51 | 3.15 | 21.1% | 10.5% | 10.0% | 37.8% | 39.8% | 30.1% |
| 2015 | 3 | 97.0 | 4.67 | 5.40 | 18.4% | 10.5% | 9.6% | 41.5% | 37.7% | 28.3% |
This series has been higher scoring than anyone could have imagined. Typically when two bad offenses square off in a pitcher’s ballpark, there aren’t a lot of runs to go around. That hasn’t been the case so far, as the two teams have combined for 32 runs in the first three games of the series. Straily will take the mound for Cincinnati today. In 11 starts this season, he has a 4.51 SIERA with a strikeout rate of 21.1%. On paper, this looks like a good matchup for Straily, but the Braves have a number of left-handed hitters in their lineup that could cause some problems.
| Matt Wisler |
 | FanDuel | DraftKings |
| Salary: | $7,500 | Salary: | $5,900 |
| FPPG: | 23.6 | FPPG: | 12.4 |
| Pitcher Rating: | 58.2 | Pitcher Rank: | 13 |
| Statistics | Starts | PitchPS | SIERA | ERA | K% | BB% | SS% | GB% | FB% | HH% |
| L30 Days | 6 | 91.2 | 4.17 | 5.66 | 20.1% | 6.0% | 8.2% | 35.8% | 42.2% | 40.9% |
| 2016 | 12 | 93.7 | 4.55 | 4.36 | 17.5% | 6.4% | 7.7% | 37.2% | 44.9% | 38.8% |
| 2015 | 19 | 93.3 | 4.98 | 4.71 | 15.1% | 8.4% | 8.1% | 33.6% | 43.2% | 28.2% |
Wisler hasn’t exactly dominated this season, posting a 4.55 SIERA with a strikeout rate of only 17.5%. He is a fly ball pitcher that gives up a lot of hard contact. Some of that is negated by the pitcher’s park that is Turner Field, but there is a reason why he has allowed 28 home runs in his last 29 starts. If you are looking for an SP2 on DraftKings, I prefer Wisler over Straily just because he is $2,300 cheaper. However, you don’t need to force either of these pitchers into your lineup.
Batter Grind Down
Cincinnati
The Reds run projection is right near the average of the 20 teams in action today. They draw a favorable matchup against , but they are facing him in a pitcher-friendly ballpark. As I mentioned above, Wisler is a fly-ball pitcher that has struggled to keep the ball in the park. He also has a major gap in his splits that we can exploit. Since the start of last season, he has allowed a .374 wOBA to left-handed hitters, while holding righties to a .284 wOBA.
- Reds Offense (2016)
Team wOBA vs. RHP — 0.300 (24 of 30)
Team ISO vs. RHP — 0.176 (8 of 30)
Team K% vs. RHP — 22.9% (22 of 30)
Runs Per Game — 4.38 (14 of 30)
Projected Run Total — 4.07 (10 of 20)
Projected Lineup
| # | Player | Bats | wOBA vs. RHP | ISO vs. RHP | wOBA L14 | FD Position | FD Salary | DK Position | DK Salary |
| 1 | | RIGHT | 0.322 | 0.197 | 0.324 | SS | $3,200 | SS | $3,600 |
| 2 | | LEFT | 0.404 | 0.236 | 0.462 | 1B | $3,600 | 1B | $4,700 |
| 3 | | RIGHT | 0.313 | 0.121 | 0.276 | 2B | $3,100 | 2B | $3,500 |
| 4 | | LEFT | 0.333 | 0.256 | 0.480 | OF | $4,300 | OF | $5,100 |
| 5 | | RIGHT | 0.374 | 0.348 | 0.317 | OF | $3,400 | OF | $5,000 |
| 6 | | RIGHT | 0.306 | 0.166 | 0.377 | 3B | $3,000 | 3B | $3,200 |
| 7 | | RIGHT | 0.253 | 0.049 | 0.294 | OF | $2,200 | OF | $3,100 |
| 8 | | SWITCH | 0.293 | 0.088 | 0.360 | C | $2,500 | C | $2,700 |
| 9 | | RIGHT | 0.046 | 0.000 | 0.000 | P | $7,100 | P | $9,200 |
| | Team Averages | — | 0.294 | 0.162 | 0.321 | — | — | — | — |
Elite Plays – ,
Secondary Plays – ,
Stackability – GPP
Atlanta
The Braves are small underdogs tonight, but their run projection is right behind the Reds in terms of the ranking. They may not hit right-handed pitching well as a team, but they draw a favorable matchup against , who has allowed a .323 wOBA to left-handed hitters in his career. , , and all bat at the top of the order and are all on my radar today.
- Braves Offense (2016)
Team wOBA vs. RHP — 0.281 (29 of 30)
Team ISO vs. RHP — 0.098 (30 of 30)
Team K% vs. RHP — 19.2% (11 of 30)
Runs Per Game — 3.17 (30 of 30)
Projected Run Total — 3.93 (11 of 20)
Projected Lineup
| # | Player | Bats | wOBA vs. RHP | ISO vs. RHP | wOBA L14 | FD Position | FD Salary | DK Position | DK Salary |
| 1 | | LEFT | 0.380 | 0.212 | 0.339 | OF | $2,600 | OF | $3,300 |
| 2 | | LEFT | 0.342 | 0.120 | 0.292 | OF | $2,800 | OF | $3,300 |
| 3 | | LEFT | 0.362 | 0.211 | 0.328 | 1B | $3,600 | 1B | $3,600 |
| 4 | | LEFT | 0.338 | 0.097 | 0.218 | OF | $2,500 | OF | $3,100 |
| 5 | | RIGHT | 0.297 | 0.136 | 0.270 | 3B | $2,800 | 3B | $3,000 |
| 6 | | LEFT | 0.316 | 0.125 | 0.168 | C | $2,600 | C | $2,500 |
| 7 | | LEFT | 0.302 | 0.092 | 0.525 | 2B | $2,500 | 2B/OF | $2,300 |
| 8 | | SWITCH | 0.275 | 0.067 | 0.402 | SS | $2,300 | SS | $2,200 |
| 9 | | RIGHT | 0.136 | 0.000 | 0.000 | P | $7,500 | P | $5,900 |
| | Team Averages | — | 0.305 | 0.118 | 0.282 | — | — | — | — |
Elite Plays – ,
Secondary Plays – ,
Stackability – GPP
Seattle at Tampa Bay – 1:10 PM ET
| Seattle | Tampa Bay |
 | |  | |
| LEFT | LEFT |
| Vegas Moneyline | Vegas Over/Under |
| TB -110 | 7.5 |
| Stats | wOBA | HR All. | K% | BB% | Stats | wOBA | HR All. | K% | BB% |
| SP vs. Left | 0.448 | 2 | 23.3% | 14.0% | SP vs. Left | 0.098 | 0 | 22.2% | 0.0% |
| SP vs. Right | 0.277 | 9 | 21.1% | 7.4% | SP vs. Right | 0.157 | 0 | 40.0% | 10.0% |
Pitcher Grind Down
| James Paxton |
 | FanDuel | DraftKings |
| Salary: | $8,500 | Salary: | $8,800 |
| FPPG: | 36.0 | FPPG: | 20.3 |
| Pitcher Rating: | 73.7 | Pitcher Rank: | 6 |
| Statistics | Starts | PitchPS | SIERA | ERA | K% | BB% | SS% | GB% | FB% | HH% |
| L30 Days | 3 | 103.7 | 2.47 | 2.25 | 32.9% | 5.5% | 13.2% | 50.0% | 22.7% | 33.3% |
| 2016 | 3 | 103.7 | 2.47 | 2.25 | 32.9% | 5.5% | 13.2% | 50.0% | 22.7% | 33.3% |
| 2015 | 13 | 85.5 | 4.44 | 3.90 | 18.9% | 9.8% | 7.2% | 48.3% | 34.4% | 29.7% |
Paxton is making his fourth start of the season. He has looked sharp in his first three, posting a 2.47 SIERA with a strikeout rate of 32.9%. It’s nice to see the 27-year old finally have some success at the major league level. He is certainly worth keeping an eye on moving forward, especially if he stays at this price point. Unfortunately, he draws a very difficult matchup tonight against the Rays, who are ranked third in team wOBA and first in team ISO against left-handed pitching this season. All of the righties in their lineup really make it tough on southpaws.
| Blake Snell |
 | FanDuel | DraftKings |
| Salary: | $8,000 | Salary: | $8,700 |
| FPPG: | 30.0 | FPPG: | 19.5 |
| Pitcher Rating: | 77.7 | Pitcher Rank: | 4 |
| Statistics | Starts | PitchPS | SIERA | ERA | K% | BB% | SS% | GB% | FB% | HH% |
| 2016 | 1 | 90.0 | 3.08 | 1.80 | 31.6% | 5.3% | 6.7% | 25.0% | 58.3% | 41.7% |
Snell will be called up to start today’s game and it sounds like the Rays could keep him around for a while. He is the club’s top pitching prospect, posting a 3.29 ERA with a strikeout rate of 33.3% in 12 Triple-A starts this season. The upside is immense for this young left-hander and while I typically like to give pitchers a few starts before targeting them in DFS, Snell is worth a look in all league formats today. Not only does he already have one major league start under his belt, but he is pitching at home in what is a pitcher-friendly environment.
Batter Grind Down
Seattle
The Mariners are a top five offense in terms of runs scored per game this season. They are slightly better against right-handed pitchers, but are still ranked 15th in team wOBA against southpaws. They draw a wildcard matchup today against , who is a top pitching prospect that is only making his second career start. The right-handed hitters in this lineup are certainly worth a look if you don’t trust the inexperienced Snell.
- Mariners Offense (2016)
Team wOBA vs. LHP — 0.316 (15 of 30)
Team ISO vs. LHP — 0.175 (7 of 30)
Team K% vs. LHP — 19.9% (11 of 30)
Runs Per Game — 5.00 (4 of 30)
Projected Run Total — 3.69 (16 of 20)
Projected Lineup
| # | Player | Bats | wOBA vs. LHP | ISO vs. LHP | wOBA L14 | FD Position | FD Salary | DK Position | DK Salary |
| 1 | | SWITCH | 0.311 | 0.138 | 0.284 | SS | $2,400 | SS | $3,200 |
| 2 | | RIGHT | 0.392 | 0.256 | 0.306 | OF | $2,600 | OF | $2,900 |
| 3 | | LEFT | 0.308 | 0.147 | 0.381 | 2B | $3,900 | 2B | $4,600 |
| 4 | | RIGHT | 0.443 | 0.324 | 0.405 | OF | $4,100 | OF | $4,900 |
| 5 | Dae-ho Lee | RIGHT | 0.400 | 0.316 | 0.440 | 1B | $2,700 | 1B | $3,400 |
| 6 | | LEFT | 0.334 | 0.210 | 0.392 | 3B | $3,700 | 3B | $4,000 |
| 7 | | RIGHT | 0.361 | 0.165 | 0.484 | C | $2,900 | C | $3,600 |
| 8 | | LEFT | 0.258 | 0.095 | 0.170 | OF | $3,200 | OF | $3,700 |
| 9 | | LEFT | 0.292 | 0.029 | 0.253 | OF | $3,100 | OF | $3,200 |
| | Team Averages | — | 0.344 | 0.187 | 0.346 | — | — | — | — |
Elite Plays –
Secondary Plays – , Dae-Ho Lee
Stackability – NONE
Tampa Bay
The Rays have one of the best offenses in baseball against left-handed pitching, but come into today’s game with the sixth lowest team total on the board. Their matchup against is less than ideal, although we have seen them fare well against good left-handed pitchers in the past. While I like the Rays’ offense overall, I have a hard time listing any of their hitters as elite plays.
- Rays Offense (2016)
Team wOBA vs. LHP — 0.347 (3 of 30)
Team ISO vs. LHP — 0.204 (1 of 30)
Team K% vs. LHP — 24.2% (24 of 30)
Runs Per Game — 4.18 (18 of 30)
Projected Run Total — 3.81 (15 of 20)
Projected Lineup
| # | Player | Bats | wOBA vs. LHP | ISO vs. LHP | wOBA L14 | FD Position | FD Salary | DK Position | DK Salary |
| 1 | | RIGHT | 0.412 | 0.299 | 0.164 | 2B | $3,000 | 2B | $4,400 |
| 2 | | RIGHT | 0.413 | 0.329 | 0.235 | OF | $2,300 | OF | $3,200 |
| 3 | | RIGHT | 0.392 | 0.224 | 0.537 | 3B | $3,800 | 3B | $5,200 |
| 4 | | RIGHT | 0.346 | 0.234 | 0.486 | OF | $3,200 | 1B/2B | $3,800 |
| 5 | | LEFT | 0.245 | 0.072 | 0.428 | 1B | $3,200 | 1B | $3,200 |
| 6 | | RIGHT | 0.328 | 0.195 | 0.295 | OF | $2,800 | OF | $3,700 |
| 7 | | RIGHT | 0.260 | 0.054 | 0.414 | OF | $2,700 | OF | $3,100 |
| 8 | | RIGHT | 0.296 | 0.217 | 0.362 | 2B | $2,500 | 2B/SS | $3,500 |
| 9 | | RIGHT | 0.340 | 0.264 | 0.434 | C | $2,900 | C | $2,600 |
| | Team Averages | — | 0.337 | 0.210 | 0.373 | — | — | — | — |
Elite Plays – NONE
Secondary Plays – , ,
Stackability – NONE
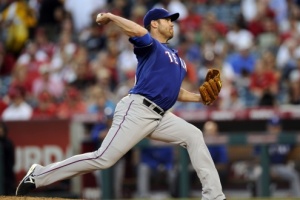
Texas at Oakland – 3:35 PM ET
| Texas | Oakland |
 | |  | |
| RIGHT | RIGHT |
| Vegas Moneyline | Vegas Over/Under |
| TEX -130 | 8.5 |
| Stats | wOBA | HR All. | K% | BB% | Stats | wOBA | HR All. | K% | BB% |
| SP vs. Left | 0.320 | 19 | 13.8% | 5.6% | SP vs. Left | 0.866 | 1 | 0.0% | 44.4% |
| SP vs. Right | 0.297 | 19 | 19.3% | 4.3% | SP vs. Right | 0.103 | 0 | 27.8% | 0.0% |
Pitcher Grind Down
| Colby Lewis |
 | FanDuel | DraftKings |
| Salary: | $7,900 | Salary: | $8,100 |
| FPPG: | 30.0 | FPPG: | 15.8 |
| Pitcher Rating: | 53.2 | Pitcher Rank: | 14 |
| Statistics | Starts | PitchPS | SIERA | ERA | K% | BB% | SS% | GB% | FB% | HH% |
| L30 Days | 6 | 93.8 | 4.54 | 2.77 | 14.7% | 3.3% | 6.2% | 38.7% | 41.2% | 39.3% |
| 2016 | 13 | 95.5 | 4.57 | 3.00 | 16.2% | 5.1% | 7.6% | 37.4% | 43.2% | 37.6% |
| 2015 | 33 | 96.4 | 4.43 | 4.66 | 16.5% | 4.9% | 8.2% | 33.7% | 44.2% | 33.3% |
Lewis continues to be a top candidate for negative regression. His ERA this season is a full run and a half lower than his SIERA. For a pitcher with a BABIP of .296 in his career, it’s hard to imagine his .249 BABIP this season being sustainable for much longer. Even though the A’s have struggled against right-handed pitching this season, they are one of the toughest teams to strikeout in baseball. Lewis is an easy fade for me in both cash games and GPPs.
| Daniel Mengden |
 | FanDuel | DraftKings |
| Salary: | $5,500 | Salary: | $6,700 |
| FPPG: | 26.0 | FPPG: | 12.8 |
| Pitcher Rating: | 38.2 | Pitcher Rank: | 19 |
| Statistics | Starts | PitchPS | SIERA | ERA | K% | BB% | SS% | GB% | FB% | HH% |
| L30 Days | 1 | 104.0 | 5.60 | 3.18 | 18.5% | 14.8% | 11.5% | 23.5% | 41.2% | 22.2% |
| 2016 | 1 | 104.0 | 5.57 | 3.18 | 18.5% | 14.8% | 11.5% | 23.5% | 41.2% | 22.2% |
Mengden is making his second career major league start. He gave up two runs in his first outing, while striking out five batters in under six innings of work. He has pitched very well in the minor leagues this season, but comes into tonight’s game as an underdog at home. This certainly isn’t a great matchup, as the Rangers are ranked above the major league average in team wOBA, team ISO, and team K% against right-handed pitching this season. I’ll continue to take a wait and see approach with Mengden.
Batter Grind Down
Texas
The Rangers come into today’s game with the third highest run projection on the board. That says more about the short slate than it does about their actual matchup. However, they do get to face an inexperienced right-hander in . All of the left-handed hitters in this lineup are in play.
- Rangers Offense (2016)
Team wOBA vs. RHP — 0.317 (10 of 30)
Team ISO vs. RHP — 0.168 (14 of 30)
Team K% vs. RHP — 18.3% (4 of 30)
Runs Per Game — 4.75 (8 of 30)
Projected Run Total — 4.43 (3 of 20)
Projected Lineup
| # | Player | Bats | wOBA vs. RHP | ISO vs. RHP | wOBA L14 | FD Position | FD Salary | DK Position | DK Salary |
| 1 | Shin-Soo Choo | LEFT | 0.395 | 0.212 | 0.545 | OF | $2,900 | OF | $3,100 |
| 2 | | RIGHT | 0.299 | 0.149 | 0.365 | OF | $3,900 | OF | $4,500 |
| 3 | | LEFT | 0.400 | 0.218 | 0.360 | OF | $3,100 | OF | $3,900 |
| 4 | | RIGHT | 0.310 | 0.148 | 0.329 | 3B | $3,600 | 3B | $3,400 |
| 5 | | SWITCH | 0.446 | 0.261 | 0.394 | 2B | $2,800 | 2B/3B | $3,500 |
| 6 | | LEFT | 0.352 | 0.149 | 0.294 | 1B | $3,000 | 1B | $3,100 |
| 7 | | LEFT | 0.325 | 0.215 | 0.331 | 2B | $3,100 | 2B | $3,800 |
| 8 | | RIGHT | 0.280 | 0.081 | 0.317 | SS | $3,300 | SS | $3,400 |
| 9 | | RIGHT | 0.258 | 0.085 | 0.202 | C | $2,500 | C | $2,000 |
| | Team Averages | — | 0.341 | 0.169 | 0.349 | — | — | — | — |
Elite Plays –
Secondary Plays – Shin-Soo Choo, ,
Stackability – Cash & GPP
Oakland
The A’s are statistically one of the worst offenses in baseball against right-handed pitching, but a favorable matchup is always the great equalizer. As I mentioned above, it’s going to be hard to to sustain his level of success. He hasn’t been particularly effective against hitters from either side of the plate in his career and I always like targeting hitters against fly-ball pitchers that have a low strikeout rate.
- Athletics Offense (2016)
Team wOBA vs. RHP — 0.299 (27 of 30)
Team ISO vs. RHP — 0.137 (24 of 30)
Team K% vs. RHP — 18.7% (5 of 30)
Runs Per Game — 4.02 (23 of 30)
Projected Run Total — 4.07 (9 of 20)
Projected Lineup
| # | Player | Bats | wOBA vs. RHP | ISO vs. RHP | wOBA L14 | FD Position | FD Salary | DK Position | DK Salary |
| 1 | | SWITCH | 0.252 | 0.117 | 0.155 | OF | $3,100 | OF | $3,100 |
| 2 | | SWITCH | 0.298 | 0.118 | 0.337 | 2B | $3,000 | 2B | $3,000 |
| 3 | | LEFT | 0.347 | 0.196 | 0.407 | C | $3,500 | C | $3,300 |
| 4 | | RIGHT | 0.366 | 0.230 | 0.496 | 3B | $3,600 | 3B | $4,200 |
| 5 | | RIGHT | 0.348 | 0.256 | 0.325 | OF | $3,700 | OF | $4,000 |
| 6 | | LEFT | 0.322 | 0.103 | 0.400 | 1B | $2,700 | 1B | $2,700 |
| 7 | | RIGHT | 0.301 | 0.132 | 0.502 | 1B | $2,900 | 1B | $2,800 |
| 8 | | RIGHT | 0.289 | 0.147 | 0.364 | SS | $3,000 | SS | $3,000 |
| 9 | | SWITCH | 0.293 | 0.085 | 0.226 | OF | $2,700 | OF | $3,000 |
| | Team Averages | — | 0.313 | 0.154 | 0.357 | — | — | — | — |
Elite Plays – ,
Secondary Plays – , ,
Stackability – Cash & GPP
Toronto at Philadelphia – 7:05 PM ET
| Toronto | Philadelphia |
 | |  | |
| LEFT | RIGHT |
| Vegas Moneyline | Vegas Over/Under |
| TOR -130 | 8.0 |
| Stats | wOBA | HR All. | K% | BB% | Stats | wOBA | HR All. | K% | BB% |
| SP vs. Left | 0.291 | 3 | 23.9% | 6.5% | SP vs. Left | 0.308 | 8 | 18.2% | 7.5% |
| SP vs. Right | 0.311 | 25 | 18.1% | 6.6% | SP vs. Right | 0.261 | 10 | 28.5% | 3.8% |
Pitcher Grind Down
| J.A. Happ |
 | FanDuel | DraftKings |
| Salary: | $8,000 | Salary: | $7,300 |
| FPPG: | 29.9 | FPPG: | 14.7 |
| Pitcher Rating: | 76.3 | Pitcher Rank: | 5 |
| Statistics | Starts | PitchPS | SIERA | ERA | K% | BB% | SS% | GB% | FB% | HH% |
| L30 Days | 6 | 87.5 | 4.65 | 6.03 | 16.2% | 7.8% | 8.4% | 47.7% | 35.5% | 38.0% |
| 2016 | 13 | 92.8 | 4.64 | 3.70 | 15.9% | 7.2% | 8.7% | 45.0% | 34.1% | 32.8% |
| 2015 | 31 | 91.6 | 3.82 | 3.61 | 21.1% | 6.3% | 8.1% | 41.6% | 34.1% | 31.2% |
Happ is another regression candidate, although we have already started to see some of that come into play. Over the last month, he has an ERA over 6.00. He isn’t a high strikeout pitcher at this stage in his career, but he does get a massive matchup boost tonight. On the season, Philadelphia is ranked 24th or worse in team wOBA, team ISO, and team K% against southpaws. You will never feel great about rostering Happ, but this is one of the few nights where you can feel somewhat confident.
| Aaron Nola |
 | FanDuel | DraftKings |
| Salary: | $9,100 | Salary: | $9,600 |
| FPPG: | 37.5 | FPPG: | 21.0 |
| Pitcher Rating: | 68.8 | Pitcher Rank: | 9 |
| Statistics | Starts | PitchPS | SIERA | ERA | K% | BB% | SS% | GB% | FB% | HH% |
| L30 Days | 6 | 95.8 | 3.04 | 2.78 | 25.0% | 5.1% | 11.1% | 56.3% | 23.3% | 23.4% |
| 2016 | 13 | 94.7 | 2.91 | 2.98 | 26.5% | 4.8% | 10.3% | 55.0% | 25.0% | 23.0% |
| 2015 | 13 | 85.9 | 3.66 | 3.59 | 21.4% | 6.0% | 8.6% | 47.6% | 32.4% | 28.8% |
Nola is having a breakout season, posting a 2.91 SIERA with a strikeout rate of 26.5% and a walk rate of 4.8%. He has struggled a bit with his consistency, but we are willing to overlook that with such a high strikeout rate. While I do like his strikeout upside for GPPs, I have a hard time taking pitchers against Toronto in cash games. They are a team that can put runs up quickly, especially in a home run-friendly ballpark.
Batter Grind Down
Toronto
The Blue Jays come into the game with the sixth highest team total on the board. They are ranked inside the top ten in team wOBA and team ISO against right-handed pitching this season and they are facing a young pitcher in a somewhat hitter-friendly ballpark. I probably won’t be overweight on the Blue Jays’ hitters tonight, but I’ll certainly have some exposure given the short slate and the limited options.
- Blue Jays Offense (2016)
Team wOBA vs. RHP — 0.318 (9 of 30)
Team ISO vs. RHP — 0.175 (9 of 30)
Team K% vs. RHP — 22.5% (20 of 30)
Runs Per Game — 4.32 (15 of 30)
Projected Run Total — 4.18 (6 of 20)
Projected Lineup
| # | Player | Bats | wOBA vs. RHP | ISO vs. RHP | wOBA L14 | FD Position | FD Salary | DK Position | DK Salary |
| 1 | | RIGHT | 0.387 | 0.286 | 0.328 | OF | $4,200 | OF | $3,900 |
| 2 | | RIGHT | 0.382 | 0.258 | 0.371 | 3B | $4,300 | 3B | $5,000 |
| 3 | | RIGHT | 0.372 | 0.264 | 0.451 | 1B | $4,200 | 1B | $4,700 |
| 4 | | LEFT | 0.345 | 0.172 | 0.487 | OF | $3,600 | OF | $4,000 |
| 5 | | RIGHT | 0.303 | 0.174 | 0.383 | C | $3,100 | C | $3,000 |
| 6 | | RIGHT | 0.306 | 0.127 | 0.355 | OF | $3,100 | OF | $3,700 |
| 7 | | RIGHT | 0.332 | 0.158 | 0.201 | 2B | $2,800 | 2B | $3,500 |
| 8 | | LEFT | 0.294 | 0.119 | 0.314 | 2B | $2,100 | 2B/SS | $2,400 |
| 9 | | LEFT | 0.158 | 0.000 | | P | $8,000 | P | $7,300 |
| | Team Averages | — | 0.320 | 0.173 | 0.361 | — | — | — | — |
Elite Plays –
Secondary Plays – , , ,
Stackability – GPP
Philadelphia
The Phillies have been one of the worst offenses in baseball all season. While we have seen mediocre pitchers have success in this matchup, we have also seen the Phillies put up some runs in favorable spots. They draw a decent matchup tonight against , who is a low strikeout pitcher that has allowed 25 home runs to right-handed hitters over the last two seasons.
- Phillies Offense (2016)
Team wOBA vs. LHP — 0.266 (29 of 30)
Team ISO vs. LHP — 0.103 (29 of 30)
Team K% vs. LHP — 24.2% (24 of 30)
Runs Per Game — 3.27 (29 of 30)
Projected Run Total — 3.82 (14 of 20)
Projected Lineup
| # | Player | Bats | wOBA vs. LHP | ISO vs. LHP | wOBA L14 | FD Position | FD Salary | DK Position | DK Salary |
| 1 | | LEFT | 0.320 | 0.078 | 0.356 | OF | $3,600 | OF | $3,800 |
| 2 | | SWITCH | 0.251 | 0.033 | 0.134 | SS | $2,400 | SS | $2,700 |
| 3 | | RIGHT | 0.338 | 0.246 | 0.325 | 3B | $3,200 | 3B | $3,800 |
| 4 | | RIGHT | 0.511 | 0.316 | 0.387 | 1B | $2,900 | 1B | $3,500 |
| 5 | | RIGHT | 0.347 | 0.193 | 0.343 | C | $2,600 | C | $3,600 |
| 6 | | SWITCH | 0.309 | 0.065 | 0.273 | 2B | $2,600 | 2B | $3,200 |
| 7 | | RIGHT | 0.254 | 0.081 | 0.254 | OF | $2,000 | OF | $3,100 |
| 8 | | SWITCH | 0.274 | 0.082 | 0.210 | 2B | $2,400 | 2B | $2,600 |
| 9 | | RIGHT | 0.086 | 0.000 | 0.000 | P | $9,100 | P | $9,600 |
| | Team Averages | — | 0.299 | 0.122 | 0.254 | — | — | — | — |
Elite Plays –
Secondary Plays – ,
Stackability – NONE
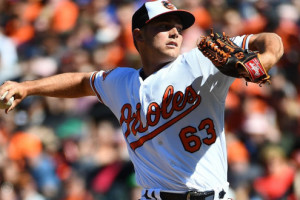
Baltimore at Boston – 7:10 PM ET
| Baltimore | Boston |
 | |  | |
| RIGHT | LEFT |
| Vegas Moneyline | Vegas Over/Under |
| BOS -135 | 9.5 |
| Stats | wOBA | HR All. | K% | BB% | Stats | wOBA | HR All. | K% | BB% |
| SP vs. Left | 0.308 | 3 | 8.9% | 7.5% | SP vs. Left | 0.339 | 7 | 19.0% | 4.4% |
| SP vs. Right | 0.329 | 5 | 12.8% | 5.3% | SP vs. Right | 0.306 | 11 | 17.4% | 8.4% |
Pitcher Grind Down
| Tyler Wilson |
 | FanDuel | DraftKings |
| Salary: | $7,000 | Salary: | $4,000 |
| FPPG: | 16.5 | FPPG: | 7.8 |
| Pitcher Rating: | 25.8 | Pitcher Rank: | 20 |
| Statistics | Starts | PitchPS | SIERA | ERA | K% | BB% | SS% | GB% | FB% | HH% |
| L30 Days | 5 | 88.0 | 5.06 | 6.67 | 11.7% | 6.3% | 6.6% | 48.0% | 37.3% | 34.3% |
| 2016 | 9 | 101.4 | 4.90 | 4.73 | 11.9% | 5.9% | 6.1% | 47.5% | 34.3% | 30.9% |
| 2015 | 5 | 104.0 | 5.08 | 3.50 | 8.7% | 7.4% | 5.2% | 52.0% | 30.1% | 31.5% |
Wilson was originally slated to pitch last night, but will instead start tonight’s game. He’ll likely be in for the same fate regardless, as he has to face the best offense in baseball. The Red Sox currently lead the majors in runs scored per game and Wilson has to face them in the hitter-friendly Fenway Park. There is more risk than potential reward for Wilson tonight and he can be avoided in all league formats.
| Eduardo Rodriguez |
 | FanDuel | DraftKings |
| Salary: | $7,000 | Salary: | $6,500 |
| FPPG: | 16.3 | FPPG: | 6.3 |
| Pitcher Rating: | 51.3 | Pitcher Rank: | 15 |
| Statistics | Starts | PitchPS | SIERA | ERA | K% | BB% | SS% | GB% | FB% | HH% |
| L30 Days | 3 | 93.7 | 6.24 | 6.06 | 10.0% | 10.0% | 6.1% | 33.9% | 53.6% | 30.4% |
| 2016 | 3 | 93.7 | 6.24 | 6.06 | 10.0% | 10.0% | 6.1% | 33.9% | 53.6% | 30.4% |
| 2015 | 21 | 95.7 | 4.16 | 3.85 | 18.8% | 7.1% | 7.8% | 43.0% | 33.4% | 31.4% |
Rodriguez has really struggled in his first three starts of the season, posting a 6.24 SIERA with a strikeout rate of only 10%. It’s always a major red flag for a pitcher when his walk rate is as high as his strikeout rate. Even though the Red Sox are favorites tonight, Rodriguez may not pitch deep enough into the game to even be eligible for the win. Both of these pitchers should be avoided in what is expected to be a high scoring game.
Batter Grind Down
Baltimore
The Orioles may be underdogs tonight, but they still have the second highest implied run total of the 20 teams in action. They draw a terrific matchup against , who has not looked good in his first three starts of the season. We typically like right-handed hitters against southpaws, but Rodriguez has struggled with left-handed hitters as well.
- Orioles Offense (2016)
Team wOBA vs. LHP — 0.305 (24 of 30)
Team ISO vs. LHP — 0.179 (5 of 30)
Team K% vs. LHP — 21.5% (17 of 30)
Runs Per Game — 4.82 (6 of 30)
Projected Run Total — 4.54 (2 of 20)
Projected Lineup
| # | Player | Bats | wOBA vs. LHP | ISO vs. LHP | wOBA L14 | FD Position | FD Salary | DK Position | DK Salary |
| 1 | | RIGHT | 0.279 | 0.145 | 0.382 | OF | $3,300 | OF | $4,300 |
| 2 | | RIGHT | 0.368 | 0.218 | 0.327 | OF | $2,700 | OF | $3,300 |
| 3 | | RIGHT | 0.351 | 0.194 | 0.374 | SS | $4,100 | 3B/SS | $4,800 |
| 4 | | LEFT | 0.345 | 0.215 | 0.448 | 1B | $3,800 | 1B | $4,500 |
| 5 | | RIGHT | 0.356 | 0.278 | 0.399 | OF | $3,600 | OF | $5,000 |
| 6 | | SWITCH | 0.293 | 0.147 | 0.283 | C | $2,800 | C | $3,500 |
| 7 | | RIGHT | 0.261 | 0.102 | 0.320 | 2B | $3,500 | 2B | $2,900 |
| 8 | | RIGHT | 0.335 | 0.143 | 0.279 | OF | $2,600 | OF | $3,100 |
| 9 | | LEFT | 0.273 | 0.111 | 0.358 | 3B | $2,200 | 3B | $2,100 |
| | Team Averages | — | 0.318 | 0.173 | 0.352 | — | — | — | — |
Elite Plays – , ,
Secondary Plays – , ,
Stackability – Cash & GPP
Boston
Without a game in Coors Field tonight, the Red Sox have the highest team total on the board. They are projected to score just under five runs, which seems a bit low given their favorable matchup against . Hitters from both sides of the plate are in play here and we can load up on the Red Sox in both cash games and tournaments.
- Red Sox Offense (2016)
Team wOBA vs. RHP — 0.360 (1 of 30)
Team ISO vs. RHP — 0.192 (3 of 30)
Team K% vs. RHP — 18.2% (3 of 30)
Runs Per Game — 5.95 (1 of 30)
Projected Run Total — 4.96 (1 of 20)
Projected Lineup
| # | Player | Bats | wOBA vs. RHP | ISO vs. RHP | wOBA L14 | FD Position | FD Salary | DK Position | DK Salary |
| 1 | | RIGHT | 0.360 | 0.207 | 0.481 | OF | $4,500 | OF | $5,400 |
| 2 | | RIGHT | 0.357 | 0.156 | 0.367 | 2B | $3,800 | 2B | $4,900 |
| 3 | | RIGHT | 0.344 | 0.120 | 0.407 | SS | $3,900 | SS | $5,500 |
| 4 | | LEFT | 0.435 | 0.345 | 0.451 | 1B | $4,100 | 1B | $5,600 |
| 5 | | RIGHT | 0.305 | 0.133 | 0.201 | 1B | $3,400 | 1B | $4,000 |
| 6 | | LEFT | 0.377 | 0.277 | 0.315 | OF | $3,500 | OF | $5,300 |
| 7 | Chris Young | RIGHT | 0.440 | 0.000 | 0.531 | OF | $3,100 | OF | $4,700 |
| 8 | | LEFT | 0.342 | 0.189 | 0.176 | 3B | $2,900 | 1B/3B | $3,900 |
| 9 | | RIGHT | 0.240 | 0.087 | 0.195 | C | $2,000 | C | $2,900 |
| | Team Averages | — | 0.356 | 0.168 | 0.347 | — | — | — | — |
Elite Plays – , ,
Secondary Plays – , ,
Stackability – Cash & GPP
Are you an incentives member? Come check out the MLB Expert Chat from 5:30 – 6:00 PM ET.
Jump to Page 1 2
