MLB Grind Down: Wednesday, June 15th - Page Three
Houston at St. Louis – 7:15 PM ET
| Houston | St. Louis |
 | |  | |
| RIGHT | RIGHT |
| Vegas Moneyline | Vegas Over/Under |
| STL -120 | 8.5 |
| Stats | wOBA | HR All. | K% | BB% | Stats | wOBA | HR All. | K% | BB% |
| SP vs. Left | 0.315 | 15 | 19.5% | 6.9% | SP vs. Left | 0.299 | 2 | 17.5% | 4.6% |
| SP vs. Right | 0.327 | 14 | 21.1% | 5.3% | SP vs. Right | 0.318 | 6 | 16.4% | 5.6% |
Pitcher Grind Down
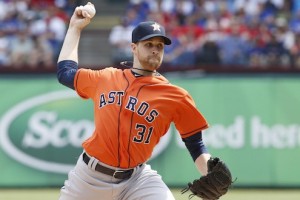
| Collin McHugh |
 | FanDuel | DraftKings |
| Salary: | $7,200 | Salary: | $6,400 |
| FPPG: | 26.9 | FPPG: | 13.1 |
| Pitcher Rating: | 52.1 | Pitcher Rank: | 21 |
| Statistics | Starts | PitchPS | SIERA | ERA | K% | BB% | SS% | GB% | FB% | HH% |
| L30 Days | 6 | 100.8 | 3.51 | 4.95 | 24.8% | 6.4% | 13.4% | 47.7% | 36.4% | 30.6% |
| 2016 | 13 | 96.5 | 3.88 | 5.22 | 21.4% | 5.8% | 10.9% | 43.4% | 38.1% | 26.0% |
| 2015 | 32 | 101.3 | 3.91 | 3.89 | 19.9% | 6.2% | 10.3% | 45.4% | 34.6% | 25.1% |
McHugh has a better SIERA than ERA, which does suggest some positive regression moving forward. On the season, he owns a 3.88 SIERA with a strikeout rate of 21.8%. While I will keep him on my radar moving forward, I will be avoiding him tonight against the Cardinals, who are one of the best offenses in baseball against right-handed pitching.
| Adam Wainwright |
 | FanDuel | DraftKings |
| Salary: | $8,100 | Salary: | $8,300 |
| FPPG: | 23.1 | FPPG: | 10.7 |
| Pitcher Rating: | 73.3 | Pitcher Rank: | 9 |
| Statistics | Starts | PitchPS | SIERA | ERA | K% | BB% | SS% | GB% | FB% | HH% |
| L30 Days | 5 | 98.0 | 3.55 | 3.03 | 22.1% | 4.6% | 7.4% | 47.3% | 30.8% | 29.0% |
| 2016 | 13 | 92.5 | 4.40 | 5.21 | 16.5% | 5.7% | 7.3% | 42.5% | 32.0% | 31.4% |
| 2015 | 4 | 95.8 | 3.45 | 1.61 | 18.0% | 3.6% | 7.8% | 51.2% | 22.6% | 21.8% |
Wainwright looked great, yes great, in his last start. He had everything working and he was making batters miss on a regular basis. He finished that start against the Reds with nine strikeouts, while only giving up two hits. He’s not getting any love from Vegas yet, but I am all over Wainwright tonight at this price. The Astros haven’t been great against right-handed pitching this season and they have one of the highest strikeout rates in baseball. To sweeten the pot, Wainwright gets to face them at home in the pitcher-friendly Busch Stadium. This is the time to jump on Waino before he becomes an extremely popular play.
Batter Grind Down
Houston
Given the fact that I am high on tonight, that means that I am obviously not a big fan of the Astros’ offense. While they may have a mediocre run projection, I’m not too interested in targeting their hitters in a pitcher-friendly National League ballpark. I’m pulling the complete fade on the Astros tonight.
- Astros Offense (2016)
Team wOBA vs. RHP — 0.312 (18 of 30)
Team ISO vs. RHP — 0.168 (14 of 30)
Team K% vs. RHP — 25.0% (28 of 30)
Runs Per Game — 4.18 (17 of 30)
Projected Run Total — 4.13 (15 of 30)
Projected Lineup
| # | Player | Bats | wOBA vs. RHP | ISO vs. RHP | wOBA L14 | FD Position | FD Salary | DK Position | DK Salary |
| 1 | | RIGHT | 0.342 | 0.177 | 0.334 | OF | $4,000 | OF | $4,300 |
| 2 | | RIGHT | 0.343 | 0.155 | 0.437 | 2B | $3,800 | 2B | $5,400 |
| 3 | | RIGHT | 0.353 | 0.204 | 0.384 | SS | $3,900 | SS | $4,200 |
| 4 | | LEFT | 0.329 | 0.222 | 0.259 | OF | $3,000 | OF | $3,500 |
| 5 | | RIGHT | 0.313 | 0.217 | 0.258 | C | $3,000 | C | $3,800 |
| 6 | | RIGHT | 0.293 | 0.146 | 0.322 | OF | $2,800 | OF | $3,600 |
| 7 | | LEFT | 0.345 | 0.220 | 0.361 | 3B | $3,000 | 3B | $3,300 |
| 8 | | RIGHT | 0.312 | 0.153 | 0.143 | 1B | $2,400 | 1B | $3,300 |
| 9 | | RIGHT | 0.098 | 0.000 | | P | $7,200 | P | $6,400 |
| | Team Averages | — | 0.303 | 0.166 | 0.312 | — | — | — | — |
Elite Plays – NONE
Secondary Plays – NONE
Stackability – NONE
St. Louis
The Cardinals are ranked second in team wOBA and first in team ISO against right-handed pitching this season. They come into tonight’s game with the ninth highest team total on the board. They draw a decent matchup against , who has allowed a .315 wOBA to left-handed hitters and a .327 wOBA to right-handed hitters over the last two seasons.
- Cardinals Offense (2016)
Team wOBA vs. RHP — 0.352 (2 of 30)
Team ISO vs. RHP — 0.204 (1 of 30)
Team K% vs. RHP — 19.5% (12 of 30)
Runs Per Game — 5.56 (2 of 30)
Projected Run Total — 4.37 (9 of 30)
Projected Lineup
| # | Player | Bats | wOBA vs. RHP | ISO vs. RHP | wOBA L14 | FD Position | FD Salary | DK Position | DK Salary |
| 1 | | LEFT | 0.404 | 0.266 | 0.542 | 2B | $4,300 | 3B | $5,100 |
| 2 | | RIGHT | 0.386 | 0.228 | 0.302 | SS | $3,900 | SS | $3,800 |
| 3 | | RIGHT | 0.357 | 0.172 | 0.369 | OF | $3,400 | OF | $3,800 |
| 4 | | RIGHT | 0.344 | 0.166 | 0.319 | OF | $3,800 | OF | $4,300 |
| 5 | | LEFT | 0.340 | 0.198 | 0.394 | 1B | $3,400 | 1B | $3,400 |
| 6 | | RIGHT | 0.332 | 0.117 | 0.407 | 3B | $2,700 | SS | $3,400 |
| 7 | | LEFT | 0.338 | 0.253 | 0.634 | 1B | $3,700 | 1B/OF | $4,100 |
| 8 | | RIGHT | 0.354 | 0.257 | 0.228 | OF | $3,100 | OF | $3,200 |
| 9 | | RIGHT | 0.302 | 0.333 | 0.312 | P | $8,100 | P | $8,300 |
| | Team Averages | — | 0.351 | 0.221 | 0.390 | — | — | — | — |
Elite Plays – ,
Secondary Plays – , ,
Stackability – GPP
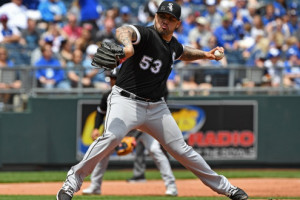
Detroit at Chicago White Sox – 8:10 PM ET
| Detroit | Chicago White Sox |
 | |  | |
| RIGHT | LEFT |
| Vegas Moneyline | Vegas Over/Under |
| CWS -180 | 9.0 |
| Stats | wOBA | HR All. | K% | BB% | Stats | wOBA | HR All. | K% | BB% |
| SP vs. Left | 0.373 | 10 | 11.4% | 10.8% | SP vs. Left | 0.276 | 2 | 32.1% | 5.2% |
| SP vs. Right | 0.326 | 11 | 12.4% | 3.7% | SP vs. Right | 0.279 | 31 | 29.2% | 5.0% |
Pitcher Grind Down
| Mike Pelfrey |
 | FanDuel | DraftKings |
| Salary: | $6,000 | Salary: | $4,700 |
| FPPG: | 17.3 | FPPG: | 6.9 |
| Pitcher Rating: | 28.8 | Pitcher Rank: | 30 |
| Statistics | Starts | PitchPS | SIERA | ERA | K% | BB% | SS% | GB% | FB% | HH% |
| L30 Days | 5 | 98.4 | 5.25 | 3.34 | 10.9% | 8.5% | 6.7% | 50.5% | 29.7% | 20.4% |
| 2016 | 12 | 96.0 | 5.26 | 4.68 | 11.5% | 9.5% | 7.9% | 50.7% | 27.9% | 29.7% |
| 2015 | 30 | 88.8 | 4.59 | 4.26 | 12.0% | 6.3% | 5.6% | 50.8% | 26.4% | 26.1% |
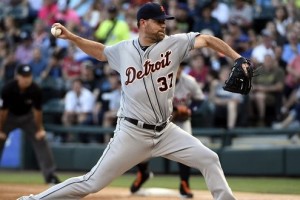
Pelfrey is not a great pitcher. Pelfrey, if you are reading this, it’s nothing personal. On the season, he owns a 5.26 SIERA with a walk rate that is nearly as high as his strikeout rate. He draws an tough matchup tonight against the White Sox in U.S. Cellular Field. There is no reason for Pelfrey to be on your radar tonight.
| Chris Sale |
 | FanDuel | DraftKings |
| Salary: | $11,000 | Salary: | $11,500 |
| FPPG: | 43.4 | FPPG: | 24.0 |
| Pitcher Rating: | 83.3 | Pitcher Rank: | 7 |
| Statistics | Starts | PitchPS | SIERA | ERA | K% | BB% | SS% | GB% | FB% | HH% |
| L30 Days | 6 | 106.2 | 3.76 | 4.20 | 22.8% | 5.3% | 9.0% | 31.7% | 38.2% | 29.3% |
| 2016 | 13 | 107.2 | 3.59 | 2.87 | 23.9% | 5.3% | 9.4% | 38.6% | 39.0% | 27.4% |
| 2015 | 31 | 107.2 | 2.52 | 3.41 | 32.1% | 4.9% | 14.6% | 42.6% | 35.3% | 25.1% |
Sale’s strikeout rate has been down a bit this season, but he still owns a 3.59 SIERA with a strikeout rate of 23.9%. The issue with Sale tonight is his matchup against the Tigers. They are one of the best teams in baseball against left-handed pitching and the one weakness for Sale has been against right-handed hitters. The Tigers lineup could feature nine right-handed batters in it tonight. At a similar price, I prefer in all league formats.
Batter Grind Down
Detroit
The Tigers aren’t my favorite offense to target tonight, but you can certainly use a few of their hitters as one-offs in tournaments. is one of the toughest pitchers in baseball, but he has allowed 31 home runs to right-handed hitters over the last two seasons.
- Tigers Offense (2016)
Team wOBA vs. LHP — 0.319 (12 of 30)
Team ISO vs. LHP — 0.153 (16 of 30)
Team K% vs. LHP — 21.2% (16 of 30)
Runs Per Game — 4.67 (10 of 30)
Projected Run Total — 4.04 (18 of 30)
Projected Lineup
| # | Player | Bats | wOBA vs. LHP | ISO vs. LHP | wOBA L14 | FD Position | FD Salary | DK Position | DK Salary |
| 1 | | RIGHT | 0.373 | 0.168 | 0.426 | 2B | $4,200 | 2B | $5,100 |
| 2 | | RIGHT | 0.353 | 0.140 | 0.321 | OF | $2,800 | OF | $3,200 |
| 3 | | RIGHT | 0.364 | 0.175 | 0.312 | 1B | $3,600 | 1B | $3,900 |
| 4 | | SWITCH | 0.371 | 0.129 | 0.356 | C | $2,800 | 1B | $3,700 |
| 5 | | RIGHT | 0.370 | 0.233 | 0.294 | 3B | $2,800 | 3B | $4,000 |
| 6 | | RIGHT | 0.379 | 0.262 | 0.429 | OF | $3,500 | OF | $4,200 |
| 7 | | RIGHT | 0.266 | 0.116 | 0.341 | OF | $2,600 | OF | $2,800 |
| 8 | | RIGHT | 0.379 | 0.245 | 0.393 | C | $2,000 | C | $2,900 |
| 9 | | RIGHT | 0.344 | 0.100 | 0.397 | SS | $2,400 | SS | $3,000 |
| | Team Averages | — | 0.355 | 0.174 | 0.363 | — | — | — | — |
Elite Plays – NONE
Secondary Plays – , ,
Stackability – NONE
Chicago White Sox
The White Sox are one of the top offenses to target tonight. They have the fourth highest team total on the board, as they square off against at home. Not only does Pelfrey struggle to strike batters out, but he has allowed a .373 wOBA to left-handed hitters and a .326 wOBA to right-handed hitters over the last two seasons.
- White Sox Offense (2016)
Team wOBA vs. RHP — 0.300 (24 of 30)
Team ISO vs. RHP — 0.137 (24 of 30)
Team K% vs. RHP — 20.8% (16 of 30)
Runs Per Game — 4.06 (22 of 30)
Projected Run Total — 4.96 (4 of 30)
Projected Lineup
| # | Player | Bats | wOBA vs. RHP | ISO vs. RHP | wOBA L14 | FD Position | FD Salary | DK Position | DK Salary |
| 1 | | RIGHT | 0.532 | 0.250 | 0.200 | SS | $2,200 | SS | $2,000 |
| 2 | | LEFT | 0.351 | 0.164 | 0.289 | OF | $3,300 | OF | $4,600 |
| 3 | | SWITCH | 0.324 | 0.127 | 0.403 | OF | $3,100 | OF | $3,600 |
| 4 | | RIGHT | 0.363 | 0.214 | 0.391 | 1B | $3,600 | 1B | $4,800 |
| 5 | | RIGHT | 0.334 | 0.223 | 0.290 | 3B | $3,200 | 3B | $4,200 |
| 6 | | RIGHT | 0.292 | 0.138 | 0.248 | 2B | $3,000 | 2B | $3,200 |
| 7 | | RIGHT | 0.293 | 0.115 | 0.215 | OF | $2,500 | OF | $3,300 |
| 8 | | SWITCH | 0.263 | 0.099 | 0.227 | C | $2,600 | C | $2,900 |
| 9 | | LEFT | 0.281 | 0.067 | 0.228 | OF | $2,100 | OF | $3,000 |
| | Team Averages | — | 0.337 | 0.155 | 0.277 | — | — | — | — |
Elite Plays – , ,
Secondary Plays – , ,
Stackability – Cash & GPP
Cleveland at Kansas City – 8:15 PM ET
| Cleveland | Kansas City |
 | |  | |
| RIGHT | RIGHT |
| Vegas Moneyline | Vegas Over/Under |
| CLE -140 | 7.5 |
| Stats | wOBA | HR All. | K% | BB% | Stats | wOBA | HR All. | K% | BB% |
| SP vs. Left | 0.314 | 15 | 24.7% | 6.5% | SP vs. Left | 0.350 | 25 | 24.3% | 8.6% |
| SP vs. Right | 0.237 | 14 | 29.1% | 3.8% | SP vs. Right | 0.330 | 20 | 23.1% | 6.7% |
Pitcher Grind Down
| Corey Kluber |
 | FanDuel | DraftKings |
| Salary: | $10,000 | Salary: | $13,100 |
| FPPG: | 37.8 | FPPG: | 21.4 |
| Pitcher Rating: | 84.0 | Pitcher Rank: | 6 |
| Statistics | Starts | PitchPS | SIERA | ERA | K% | BB% | SS% | GB% | FB% | HH% |
| L30 Days | 6 | 103.7 | 3.40 | 3.14 | 24.9% | 5.3% | 10.6% | 46.1% | 34.8% | 25.6% |
| 2016 | 13 | 98.2 | 3.36 | 3.65 | 24.8% | 5.4% | 11.8% | 49.0% | 33.5% | 28.0% |
| 2015 | 32 | 102.3 | 2.98 | 3.49 | 27.7% | 5.1% | 12.9% | 42.4% | 35.9% | 27.0% |
Kluber would typically be one of the most popular pitching targets in a smaller ten-game slate, but it’s hard to justify taking him over . Kluber’s numbers on the season are certainly impressive, as he has a 3.36 SIERA with a strikeout rate of 24.8%. He draws a decent matchup against the Royals, who have really struggled offensively this season. I love Kluber as a GPP play, but will be leaning toward Syndergaard in cash games.
| Ian Kennedy |
 | FanDuel | DraftKings |
| Salary: | $7,400 | Salary: | $7,300 |
| FPPG: | 30.3 | FPPG: | 15.6 |
| Pitcher Rating: | 71.3 | Pitcher Rank: | 12 |
| Statistics | Starts | PitchPS | SIERA | ERA | K% | BB% | SS% | GB% | FB% | HH% |
| L30 Days | 5 | 98.6 | 4.20 | 5.40 | 20.7% | 7.4% | 9.9% | 38.6% | 38.6% | 40.0% |
| 2016 | 12 | 101.1 | 4.22 | 4.06 | 22.1% | 8.4% | 10.1% | 35.2% | 45.2% | 35.2% |
| 2015 | 30 | 97.0 | 3.61 | 4.28 | 24.4% | 7.3% | 10.3% | 38.5% | 38.7% | 35.2% |
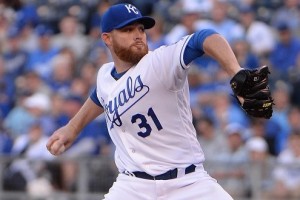
Kennedy is always an interesting tournament play when he is pitching at home. His biggest weakness over the last few seasons has been the long ball, which is largely negated by the spacious Kauffman Stadium. Kennedy hasn’t been in the best of form recently, but he still sports a strikeout rate well above 20%. At his price point, Kennedy is one of my favorite GPP plays tonight.
Batter Grind Down
Cleveland
The Indians may be small favorites tonight, but they come into the game with the 11th lowest team total on the board. They draw a decent matchup against , who has allowed 45 home runs over his last 42 starts. Kennedy has also given up a .350 wOBA to left-handed hitters.
- Indians Offense (2016)
Team wOBA vs. RHP — 0.316 (12 of 30)
Team ISO vs. RHP — 0.170 (11 of 30)
Team K% vs. RHP — 21.2% (17 of 30)
Runs Per Game — 4.68 (9 of 30)
Projected Run Total — 3.98 (20 of 30)
Projected Lineup
| # | Player | Bats | wOBA vs. RHP | ISO vs. RHP | wOBA L14 | FD Position | FD Salary | DK Position | DK Salary |
| 1 | | SWITCH | 0.338 | 0.214 | 0.335 | 1B | $3,800 | 1B | $4,000 |
| 2 | | LEFT | 0.374 | 0.167 | 0.356 | 2B | $3,500 | 2B | $3,900 |
| 3 | | SWITCH | 0.341 | 0.149 | 0.354 | SS | $3,600 | SS | $4,300 |
| 4 | | RIGHT | 0.295 | 0.178 | 0.341 | 1B | $3,400 | 1B | $3,400 |
| 5 | | SWITCH | 0.314 | 0.136 | 0.299 | P | $4,000 | 3B/OF | $3,200 |
| 6 | | LEFT | 0.295 | 0.132 | 0.352 | OF | $3,000 | OF | $2,800 |
| 7 | | RIGHT | 0.276 | 0.185 | 0.220 | C | $2,600 | C | $2,800 |
| 8 | | LEFT | 0.392 | 0.221 | 0.461 | OF | $2,600 | OF | $3,000 |
| 9 | | RIGHT | 0.311 | 0.146 | 0.292 | OF | $3,600 | OF | $3,300 |
| | Team Averages | — | 0.326 | 0.170 | 0.334 | — | — | — | — |
Elite Plays –
Secondary Plays –
Stackability – NONE
Kansas City
The Royals’ offense has been an easy fade for most of the season. They currently average the fourth fewest runs per game and they come into tonight’s contest with the fifth lowest team total on the board. They should be avoided tonight against .
- Royals Offense (2016)
Team wOBA vs. RHP — 0.311 (19 of 30)
Team ISO vs. RHP — 0.131 (29 of 30)
Team K% vs. RHP — 19.9% (13 of 30)
Runs Per Game — 3.78 (27 of 30)
Projected Run Total — 3.52 (26 of 30)
Projected Lineup
| # | Player | Bats | wOBA vs. RHP | ISO vs. RHP | wOBA L14 | FD Position | FD Salary | DK Position | DK Salary |
| 1 | | RIGHT | 0.312 | 0.085 | 0.361 | OF | $3,400 | 2B/OF | $2,700 |
| 2 | | RIGHT | 0.263 | 0.059 | 0.141 | SS | $2,600 | SS | $2,000 |
| 3 | | LEFT | 0.391 | 0.196 | 0.364 | 1B | $3,600 | 1B | $3,300 |
| 4 | | RIGHT | 0.325 | 0.128 | 0.273 | OF | $3,000 | OF | $2,600 |
| 5 | | RIGHT | 0.333 | 0.193 | 0.389 | C | $2,900 | C | $2,900 |
| 6 | | SWITCH | 0.338 | 0.213 | 0.326 | 1B | $2,700 | 1B | $2,400 |
| 7 | | LEFT | 0.336 | 0.030 | 0.488 | OF | $2,200 | OF | $2,600 |
| 8 | | RIGHT | 0.309 | 0.136 | 0.390 | 3B | $2,500 | 3B | $2,200 |
| 9 | | LEFT | 0.301 | 0.117 | 0.265 | OF | $2,200 | OF | $2,700 |
| | Team Averages | — | 0.323 | 0.129 | 0.333 | — | — | — | — |
Elite Plays – NONE
Secondary Plays – NONE
Stackability – NONE
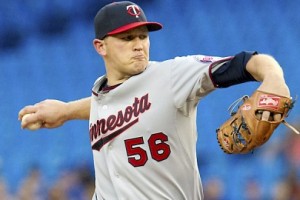
Minnesota at LA Angels – 10:05 PM ET
| Minnesota | LA Angels |
 | |  | |
| RIGHT | LEFT |
| Vegas Moneyline | Vegas Over/Under |
| LAA -125 | 8.5 |
| Stats | wOBA | HR All. | K% | BB% | Stats | wOBA | HR All. | K% | BB% |
| SP vs. Left | 0.330 | 4 | 24.9% | 6.8% | SP vs. Left | 0.288 | 5 | 19.1% | 8.6% |
| SP vs. Right | 0.337 | 8 | 17.7% | 6.3% | SP vs. Right | 0.334 | 38 | 21.1% | 9.5% |
Pitcher Grind Down
| Tyler Duffey |
 | FanDuel | DraftKings |
| Salary: | $5,800 | Salary: | $6,000 |
| FPPG: | 25.4 | FPPG: | 12.2 |
| Pitcher Rating: | 55.5 | Pitcher Rank: | 18 |
| Statistics | Starts | PitchPS | SIERA | ERA | K% | BB% | SS% | GB% | FB% | HH% |
| L30 Days | 6 | 100.8 | 3.72 | 6.69 | 18.8% | 4.4% | 7.3% | 50.0% | 25.0% | 33.6% |
| 2016 | 9 | 98.0 | 3.70 | 5.33 | 20.2% | 4.7% | 8.2% | 48.0% | 27.5% | 32.4% |
| 2015 | 10 | 90.8 | 3.83 | 3.10 | 21.9% | 8.3% | 9.8% | 49.7% | 30.9% | 26.6% |
Duffey’s ERA is a lot higher than his SIERA, which does suggest some positive regression moving forward. Overall, his numbers aren’t awful, as he has a 3.70 SIERA with a strikeout rate just over 20%. He draws a fairly difficult matchup tonight against the Angels, who have the lowest strikeout rate of any team in baseball against right-handed pitching this season. Duffey is cheap, but this isn’t the best time to take a chance on him.
| Hector Santiago |
 | FanDuel | DraftKings |
| Salary: | $6,900 | Salary: | $5,200 |
| FPPG: | 21.9 | FPPG: | 10.5 |
| Pitcher Rating: | 67.2 | Pitcher Rank: | 14 |
| Statistics | Starts | PitchPS | SIERA | ERA | K% | BB% | SS% | GB% | FB% | HH% |
| L30 Days | 6 | 80.3 | 4.68 | 8.28 | 20.9% | 11.3% | 10.0% | 38.0% | 40.8% | 37.3% |
| 2016 | 13 | 91.9 | 4.59 | 5.64 | 19.9% | 9.6% | 10.0% | 39.4% | 43.4% | 34.5% |
| 2015 | 32 | 98.8 | 4.50 | 3.59 | 20.9% | 9.2% | 8.5% | 29.9% | 53.6% | 33.6% |
Santiago has really struggled over the last month of play. During that stretch, he had an ERA of 8.28 with a walk rate of 11.3%. The Twins are a team that strikes out at a high rate, but I want to see some form from Santiago before I consider using him in DFS. I much prefer spending a bit more and going up to .
Batter Grind Down
Minnesota
The Twins are ranked 23rd in team wOBA against left-handed pitching, but this matchup actually suits their lineup well. Over the last two seasons, has allowed a .334 wOBA and 38 home runs to right-handed hitters. The Twins will likely have seven or eight righties in the lineup tonight.
- Twins Offense (2016)
Team wOBA vs. LHP — 0.307 (23 of 30)
Team ISO vs. LHP — 0.163 (14 of 30)
Team K% vs. LHP — 23.9% (23 of 30)
Runs Per Game — 3.90 (26 of 30)
Projected Run Total — 4.10 (17 of 30)
Projected Lineup
| # | Player | Bats | wOBA vs. LHP | ISO vs. LHP | wOBA L14 | FD Position | FD Salary | DK Position | DK Salary |
| 1 | | RIGHT | 0.348 | 0.280 | 0.355 | SS | $3,600 | 3B/SS | $4,500 |
| 2 | | LEFT | 0.310 | 0.124 | 0.313 | 1B | $3,400 | 1B | $4,000 |
| 3 | | SWITCH | 0.367 | 0.189 | 0.477 | OF | $3,700 | OF | $3,500 |
| 4 | | RIGHT | 0.333 | 0.180 | 0.280 | 3B | $2,800 | 3B | $3,600 |
| 5 | | RIGHT | 0.347 | 0.214 | 0.397 | 2B | $3,500 | 2B | $4,100 |
| 6 | Byung-Ho Park | RIGHT | 0.333 | 0.268 | 0.298 | 1B | $2,800 | 1B | $3,600 |
| 7 | | LEFT | 0.161 | 0.045 | 0.250 | OF | $2,400 | OF | $3,100 |
| 8 | | RIGHT | 0.274 | 0.082 | 0.356 | C | $2,500 | C | $2,800 |
| 9 | | RIGHT | 0.161 | 0.075 | 0.297 | OF | $2,800 | OF | $2,400 |
| | Team Averages | — | 0.293 | 0.162 | 0.336 | — | — | — | — |
Elite Plays –
Secondary Plays – , , , Byung-Ho Park
Stackability – GPP
LA Angels
The Angels have the eighth highest team total on the board tonight. While their offense has been better over the last few weeks, that total seems a bit high. They draw a mediocre matchup against , whose advanced pitching statistics look a lot better than his ERA. Outside of , the Angels are secondary options at their respective positions.
- Angels Offense (2016)
Team wOBA vs. RHP — 0.311 (19 of 30)
Team ISO vs. RHP — 0.135 (27 of 30)
Team K% vs. RHP — 16.2% (1 of 30)
Runs Per Game — 4.23 (16 of 30)
Projected Run Total — 4.40 (8 of 30)
Projected Lineup
| # | Player | Bats | wOBA vs. RHP | ISO vs. RHP | wOBA L14 | FD Position | FD Salary | DK Position | DK Salary |
| 1 | | RIGHT | 0.341 | 0.094 | 0.307 | 3B | $2,800 | 3B | $3,500 |
| 2 | | LEFT | 0.334 | 0.167 | 0.372 | OF | $3,200 | OF | $4,100 |
| 3 | | RIGHT | 0.412 | 0.285 | 0.389 | OF | $4,100 | OF | $4,700 |
| 4 | | RIGHT | 0.329 | 0.209 | 0.286 | 1B | $3,300 | 1B | $3,500 |
| 5 | | RIGHT | 0.326 | 0.181 | 0.398 | 1B | $2,800 | 1B | $3,400 |
| 6 | | LEFT | 0.300 | 0.109 | 0.259 | 2B | $2,900 | 2B | $3,000 |
| 7 | | RIGHT | 0.337 | 0.243 | 0.451 | 3B | $2,500 | 1B/3B | $2,400 |
| 8 | | RIGHT | 0.284 | 0.124 | 0.181 | C | $2,100 | C | $2,200 |
| 9 | | RIGHT | 0.321 | 0.138 | 0.401 | SS | $2,500 | SS | $3,200 |
| | Team Averages | — | 0.332 | 0.172 | 0.338 | — | — | — | — |
Elite Plays –
Secondary Plays – ,
Stackability – NONE
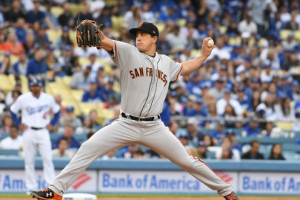
Texas at Oakland – 10:05 PM ET
| Texas | Oakland |
 | |  | |
| LEFT | RIGHT |
| Vegas Moneyline | Vegas Over/Under |
| OAK -135 | 7.5 |
| Stats | wOBA | HR All. | K% | BB% | Stats | wOBA | HR All. | K% | BB% |
| SP vs. Left | 0.281 | 2 | 20.6% | 7.2% | SP vs. Left | 0.275 | 10 | 20.9% | 8.1% |
| SP vs. Right | 0.348 | 18 | 13.5% | 7.1% | SP vs. Right | 0.292 | 16 | 18.8% | 7.4% |
Pitcher Grind Down
| Derek Holland |
 | FanDuel | DraftKings |
| Salary: | $7,100 | Salary: | $6,300 |
| FPPG: | 21.4 | FPPG: | 9.7 |
| Pitcher Rating: | 49.2 | Pitcher Rank: | 25 |
| Statistics | Starts | PitchPS | SIERA | ERA | K% | BB% | SS% | GB% | FB% | HH% |
| L30 Days | 5 | 93.6 | 5.09 | 3.52 | 13.2% | 6.6% | 5.6% | 42.7% | 45.8% | 21.9% |
| 2016 | 12 | 91.9 | 5.22 | 4.87 | 13.1% | 7.3% | 6.4% | 37.3% | 43.8% | 29.0% |
| 2015 | 10 | 90.9 | 4.43 | 4.91 | 16.7% | 6.9% | 6.9% | 41.9% | 35.2% | 34.6% |
Holland continues to struggle this season. Through his first 12 starts, he has a 5.22 SIERA with a strikeout rate of only 13.1%. To make matters worse, he has to face an A’s offense that has been on fire against left-handed pitching over the last week of play. Holland should be avoided in both cash games and GPPs.
| Sonny Gray |
 | FanDuel | DraftKings |
| Salary: | $8,200 | Salary: | $7,100 |
| FPPG: | 23.6 | FPPG: | 11.0 |
| Pitcher Rating: | 71.5 | Pitcher Rank: | 11 |
| Statistics | Starts | PitchPS | SIERA | ERA | K% | BB% | SS% | GB% | FB% | HH% |
| L30 Days | 4 | 89.5 | 4.56 | 4.15 | 16.5% | 8.3% | 8.9% | 48.6% | 29.2% | 31.9% |
| 2016 | 11 | 90.4 | 4.42 | 5.34 | 18.5% | 9.6% | 8.4% | 53.4% | 28.3% | 32.6% |
| 2015 | 31 | 99.3 | 3.80 | 2.73 | 20.3% | 7.1% | 9.7% | 52.7% | 30.7% | 25.1% |
Gray started to flash some form there for a while, but has just been able to show that consistency that we have seen from him in prior years. In 11 starts this season, he has a 4.42 SIERA with a strikeout rate of 18.5%. Even though he is pitching at home, the Rangers are an above-average offense with one of the lowest strikeout rates in baseball. I will continue to avoid Gray until he can turn things around.
Batter Grind Down
Texas
The Rangers have the sixth lowest team total on the board tonight. This is one of those situations where you can probably avoid both the pitcher () and the offense that he is facing. You can look at a few of these left-handed hitters, but I see them more as secondary plays.
- Rangers Offense (2016)
Team wOBA vs. RHP — 0.317 (10 of 30)
Team ISO vs. RHP — 0.168 (14 of 30)
Team K% vs. RHP — 18.3% (4 of 30)
Runs Per Game — 4.75 (8 of 30)
Projected Run Total — 3.54 (25 of 30)
Projected Lineup
| # | Player | Bats | wOBA vs. RHP | ISO vs. RHP | wOBA L14 | FD Position | FD Salary | DK Position | DK Salary |
| 1 | Shin-Soo Choo | LEFT | 0.395 | 0.212 | 0.545 | OF | $2,800 | OF | $4,100 |
| 2 | | RIGHT | 0.299 | 0.149 | 0.365 | OF | $3,800 | OF | $4,300 |
| 3 | | LEFT | 0.400 | 0.218 | 0.360 | OF | $3,000 | OF | $4,000 |
| 4 | | LEFT | 0.325 | 0.215 | 0.331 | 2B | $3,000 | 2B | $3,900 |
| 5 | | SWITCH | 0.446 | 0.261 | 0.394 | 2B | $2,900 | 2B/3B | $3,100 |
| 6 | | LEFT | 0.352 | 0.149 | 0.294 | 1B | $2,900 | 1B | $3,200 |
| 7 | | RIGHT | 0.280 | 0.081 | 0.317 | SS | $3,100 | SS | $3,500 |
| 8 | | LEFT | 0.351 | 0.222 | 0.404 | OF | $3,500 | 1B | $3,700 |
| 9 | | RIGHT | 0.258 | 0.085 | 0.202 | C | $2,000 | C | $2,800 |
| | Team Averages | — | 0.345 | 0.177 | 0.357 | — | — | — | — |
Elite Plays – NONE
Secondary Plays – Shin-Soo Choo, ,
Stackability – NONE
Oakland
The A’s have a surprisingly low team total, but don’t let that fool you. Their matchup against is a great one, even if they have to face him in a pitcher-friendly ballpark. Over the last two seasons, Holland has allowed a .348 wOBA and 18 home runs to right-handed hitters.
- Athletics Offense (2016)
Team wOBA vs. LHP — 0.313 (19 of 30)
Team ISO vs. LHP — 0.170 (10 of 30)
Team K% vs. LHP — 19.4% (6 of 30)
Runs Per Game — 4.02 (23 of 30)
Projected Run Total — 3.96 (22 of 30)
Projected Lineup
| # | Player | Bats | wOBA vs. LHP | ISO vs. LHP | wOBA L14 | FD Position | FD Salary | DK Position | DK Salary |
| 1 | | SWITCH | 0.258 | 0.095 | 0.155 | OF | $3,100 | OF | $2,700 |
| 2 | | SWITCH | 0.340 | 0.167 | 0.337 | 2B | $3,000 | 2B | $3,600 |
| 3 | | RIGHT | 0.400 | 0.229 | 0.496 | 3B | $3,600 | 3B | $4,100 |
| 4 | | RIGHT | 0.322 | 0.253 | 0.325 | OF | $3,600 | OF | $3,700 |
| 5 | | RIGHT | 0.316 | 0.158 | 0.502 | 1B | $3,000 | 1B | $3,300 |
| 6 | | RIGHT | 0.329 | 0.170 | 0.335 | C | $3,000 | C | $3,100 |
| 7 | | RIGHT | 0.377 | 0.201 | 0.364 | SS | $3,000 | SS | $4,100 |
| 8 | | RIGHT | 0.371 | 0.242 | 0.488 | OF | $2,500 | OF | $2,900 |
| 9 | | LEFT | 0.272 | 0.043 | 0.400 | 1B | $2,500 | 1B | $2,700 |
| | Team Averages | — | 0.332 | 0.173 | 0.378 | — | — | — | — |
Elite Plays – , ,
Secondary Plays – ,
Stackability – GPP
Jump to Page 1 2 3
