MLB Grind Down: Sunday, June 26th
The RotoGrinders MLB Grind Down will give you an in-depth analysis into the upcoming MLB schedule. This article will break down the numbers for every single game and give you analysis on which trends you can exploit. While matchups are a major factor in daily fantasy baseball, there are plenty of other factors to consider such as injuries, weather, and salaries.
The analysis should point you in the right direction, but it is still up to you to decipher the information and make your own selections. No sport has more variance than baseball. The best choice is not always the right choice but following the trends will win you money over time.
Note: As always, if you want to try a new DFS site, be sure to click through a RotoGrinders link and use our DraftKings promo code and FanDuel promo code to receive the best perks in the industry.
Minnesota at NY Yankees – 1:05 PM ET
| Minnesota | NY Yankees |
 | |  | |
| RIGHT | RIGHT |
| Vegas Moneyline | Vegas Over/Under |
| NYY -220 | 9.5 |
| Stats | wOBA | HR All. | K% | BB% | Stats | wOBA | HR All. | K% | BB% |
| SP vs. Left | 0.322 | 4 | 23.5% | 6.4% | SP vs. Left | 0.356 | 10 | 18.4% | 8.7% |
| SP vs. Right | 0.355 | 11 | 16.7% | 6.8% | SP vs. Right | 0.296 | 13 | 19.1% | 5.4% |
Pitcher Grind Down
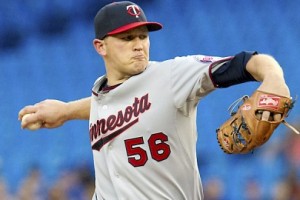
| Tyler Duffey |
 | FanDuel | DraftKings |
| Salary: | $5,200 | Salary: | $4,000 |
| FPPG: | 20.6 | FPPG: | 9.2 |
| Pitcher Rating: | 41.3 | Pitcher Rank: | 25 |
| Statistics | Starts | PitchPS | SIERA | ERA | K% | BB% | SS% | GB% | FB% | HH% |
| L30 Days | 6 | 90.7 | 4.28 | 9.10 | 16.6% | 5.5% | 7.5% | 44.6% | 26.8% | 36.3% |
| 2016 | 11 | 94.0 | 4.12 | 6.18 | 18.0% | 5.1% | 7.9% | 45.6% | 30.1% | 33.2% |
| 2015 | 10 | 90.8 | 3.83 | 3.10 | 21.9% | 8.3% | 9.8% | 49.7% | 30.9% | 26.6% |
: It has been a rough road for Duffey, who is getting hit hard pretty routinely, and the numbers show it. He does not walk a ton of guys, but also has a less than ideal strikeout rate, making him someone we can fade today without issue.
| Nathan Eovaldi |
 | FanDuel | DraftKings |
| Salary: | $7,600 | Salary: | $5,200 |
| FPPG: | 27.8 | FPPG: | 13.5 |
| Pitcher Rating: | 68.8 | Pitcher Rank: | 6 |
| Statistics | Starts | PitchPS | SIERA | ERA | K% | BB% | SS% | GB% | FB% | HH% |
| L30 Days | 6 | 94.8 | 4.50 | 5.91 | 17.1% | 7.5% | 8.6% | 46.8% | 31.2% | 36.4% |
| 2016 | 14 | 96.7 | 3.87 | 5.02 | 20.3% | 6.1% | 8.8% | 51.2% | 30.2% | 33.2% |
| 2015 | 27 | 97.7 | 3.99 | 4.20 | 18.0% | 7.3% | 8.7% | 52.2% | 26.0% | 28.0% |
: If it were not for the fact that he is facing the Twins, Eovaldi would not be someone we are considering today as a secondary option. Even though there are some top-tier pitchers going today, we do not exactly have the greatest pitchers pool when it comes to second and third pitchers on multiple-pitcher sites. Eovaldi should be able to handle this right-handed heavy lineup, and while the upside is not tremendous, his price makes up for that some.
Batter Grind Down
Minnesota
Twins: They rank in the bottom third of most offensive categories and are a team that by now you should know we can target with pitching. Eovaldi does have a weakness with left-handed hitters so and should be on your radar but outside of that I do not want much exposure here.
- Twins Offense (2016)
Team wOBA vs. RHP — 0.306 (22 of 30)
Team ISO vs. RHP — 0.148 (21 of 30)
Team K% vs. RHP — 22.4% (21 of 30)
Runs Per Game — 4.06 (23 of 30)
Projected Run Total — 4.06 (22 of 30)
Projected Lineup
| # | Player | Bats | wOBA vs. RHP | ISO vs. RHP | wOBA L14 | FD Position | FD Salary | DK Position | DK Salary |
| 1 | | RIGHT | 0.339 | 0.117 | 0.259 | SS | $3,300 | 3B/SS | $4,800 |
| 2 | | SWITCH | 0.355 | 0.211 | 0.348 | OF | $2,900 | OF | $3,600 |
| 3 | | LEFT | 0.324 | 0.117 | 0.268 | 1B | $2,800 | 1B | $3,700 |
| 4 | | RIGHT | 0.314 | 0.188 | 0.415 | 2B | $3,400 | 2B | $4,700 |
| 5 | | RIGHT | 0.305 | 0.175 | 0.275 | 3B | $2,600 | 3B | $3,700 |
| 6 | Byung-Ho Park | RIGHT | 0.308 | 0.232 | 0.161 | 1B | $2,800 | 1B | $3,300 |
| 7 | | LEFT | 0.344 | 0.211 | 0.377 | OF | $3,100 | OF | $3,200 |
| 8 | | RIGHT | 0.270 | 0.081 | 0.484 | C | $2,500 | C | $3,100 |
| 9 | | RIGHT | 0.289 | 0.156 | 0.205 | OF | $2,900 | OF | $3,800 |
| | Team Averages | — | 0.316 | 0.165 | 0.310 | — | — | — | — |
Elite Plays – None
Secondary Plays – ,
Stackability – None
NY Yankees
Yankees: Duffey has allowed a high wOBA to both left and right-handed hitters, but we should expect to see the lefty-heavy lineup that will get to him here today. Although they are not exactly tearing the cover off the ball, this Yankees squad is one that should put up some runs today and continues to be the most consistent fantasy player on the team.
- Yankees Offense (2016)
Team wOBA vs. RHP — 0.307 (21 of 30)
Team ISO vs. RHP — 0.151 (18 of 30)
Team K% vs. RHP — 18.9% (6 of 30)
Runs Per Game — 4.17 (19 of 30)
Projected Run Total — 5.44 (3 of 30)
Projected Lineup
| # | Player | Bats | wOBA vs. RHP | ISO vs. RHP | wOBA L14 | FD Position | FD Salary | DK Position | DK Salary |
| 1 | | LEFT | 0.312 | 0.110 | 0.238 | OF | $3,400 | OF | $4,200 |
| 2 | | LEFT | 0.337 | 0.147 | 0.336 | OF | $3,600 | OF | $4,100 |
| 3 | | SWITCH | 0.359 | 0.219 | 0.401 | OF | $3,800 | OF | $5,200 |
| 4 | | RIGHT | 0.329 | 0.206 | 0.226 | 3B | $3,400 | 1B/3B | $4,000 |
| 5 | | SWITCH | 0.347 | 0.270 | | 1B | $2,400 | 1B | $3,100 |
| 6 | | LEFT | 0.326 | 0.208 | 0.342 | C | $3,100 | C | $4,200 |
| 7 | | RIGHT | 0.290 | 0.133 | 0.267 | 2B | $2,900 | 2B | $3,700 |
| 8 | | SWITCH | 0.305 | 0.109 | 0.402 | 3B | $2,900 | 3B | $3,400 |
| 9 | | LEFT | 0.306 | 0.127 | 0.450 | SS | $2,900 | SS | $4,300 |
| | Team Averages | — | 0.323 | 0.170 | 0.333 | — | — | — | — |
Elite Plays –
Secondary Plays – , ,
Stackability – None
Cleveland at Detroit – 1:08 PM ET
| Cleveland | Detroit |
 | |  | |
| RIGHT | RIGHT |
| Vegas Moneyline | Vegas Over/Under |
| DET -135 | 8.5 |
| Stats | wOBA | HR All. | K% | BB% | Stats | wOBA | HR All. | K% | BB% |
| SP vs. Left | 0.244 | 11 | 17.1% | 1.9% | SP vs. Left | 0.267 | 11 | 23.3% | 6.6% |
| SP vs. Right | 0.337 | 17 | 20.4% | 3.1% | SP vs. Right | 0.295 | 14 | 22.7% | 5.8% |
Pitcher Grind Down
| Josh Tomlin |
 | FanDuel | DraftKings |
| Salary: | $8,500 | Salary: | $8,900 |
| FPPG: | 31.5 | FPPG: | 15.9 |
| Pitcher Rating: | 49.5 | Pitcher Rank: | 18 |
| Statistics | Starts | PitchPS | SIERA | ERA | K% | BB% | SS% | GB% | FB% | HH% |
| L30 Days | 6 | 95.3 | 4.26 | 3.05 | 14.5% | 1.3% | 6.6% | 43.5% | 35.1% | 33.1% |
| 2016 | 13 | 91.2 | 4.23 | 3.32 | 16.0% | 2.1% | 6.8% | 41.5% | 38.1% | 36.1% |
| 2015 | 10 | 94.9 | 3.46 | 3.02 | 22.7% | 3.2% | 9.4% | 37.5% | 46.2% | 33.2% |
: While Tomlin is a pretty solid real-life pitcher, I do not think it translates all that well to fantasy necessarily. We have seen him pitch very well in June and this will be the third time facing a Tigers squad that he has handled pretty well. This is a pitcher you can use as a fringe secondary option or tournament play, but not in cash games.
| Justin Verlander |
 | FanDuel | DraftKings |
| Salary: | $9,300 | Salary: | $10,700 |
| FPPG: | 37.6 | FPPG: | 20.6 |
| Pitcher Rating: | 77.4 | Pitcher Rank: | 5 |
| Statistics | Starts | PitchPS | SIERA | ERA | K% | BB% | SS% | GB% | FB% | HH% |
| L30 Days | 6 | 107.2 | 3.40 | 2.72 | 25.5% | 3.6% | 11.5% | 33.9% | 46.4% | 26.1% |
| 2016 | 15 | 107.3 | 3.67 | 3.78 | 25.4% | 6.5% | 11.4% | 35.1% | 46.8% | 27.5% |
| 2015 | 20 | 107.5 | 3.95 | 3.37 | 21.1% | 6.0% | 10.0% | 34.6% | 45.5% | 23.0% |
: Verlander has been great ever since his last outing with Cleveland in which he gave up seven runs in just five innings. On one hand it would be easy to say he has turned the corner, but when a team rocks a pitcher like that you have to at least pay attention to it. The strikeout rate and hard hit percentages are exactly where we want them, but you will have to pay for Verlander, and as such, I expect him to hold a lower ownership making him a fantastic tournament starter.
Batter Grind Down
Cleveland
Indians: The Indians continue to be a team that fly under the radar by most in terms of fantasy production. With Verlander on the hill for Detroit, I would be surprised to see any of these guys with a high percentage of ownership, and that makes them dangerous in tournaments. Loading up might not be the best strategy, but some exposure is probably warranted the way they have played.
- Indians Offense (2016)
Team wOBA vs. RHP — 0.325 (9 of 30)
Team ISO vs. RHP — 0.182 (8 of 30)
Team K% vs. RHP — 20.8% (15 of 30)
Runs Per Game — 4.77 (8 of 30)
Projected Run Total — 4.04 (24 of 30)
Projected Lineup
| # | Player | Bats | wOBA vs. RHP | ISO vs. RHP | wOBA L14 | FD Position | FD Salary | DK Position | DK Salary |
| 1 | | SWITCH | 0.344 | 0.223 | 0.410 | 1B | $4,000 | 1B | $3,700 |
| 2 | | LEFT | 0.376 | 0.176 | 0.351 | 2B | $3,800 | 2B | $3,800 |
| 3 | | SWITCH | 0.347 | 0.152 | 0.389 | SS | $3,900 | SS | $3,600 |
| 4 | | RIGHT | 0.292 | 0.175 | 0.271 | 1B | $3,100 | 1B | $2,700 |
| 5 | | SWITCH | 0.317 | 0.142 | 0.284 | P | $4,000 | 3B/OF | $3,100 |
| 6 | | RIGHT | 0.303 | 0.147 | 0.400 | 3B | $2,800 | 3B | $2,400 |
| 7 | | LEFT | 0.299 | 0.128 | 0.290 | OF | $3,300 | OF | $2,500 |
| 8 | | RIGHT | 0.265 | 0.175 | 0.244 | C | $2,600 | C | $2,500 |
| 9 | | LEFT | 0.386 | 0.221 | 0.432 | OF | $3,100 | OF | $2,800 |
| | Team Averages | — | 0.325 | 0.171 | 0.341 | — | — | — | — |
Elite Plays – None
Secondary Plays – , ,
Stackability – None
Detroit
Tigers: This game is very interesting in that both of these pitchers are capable of shutting down these lineups, but the exact opposite is true as well. The Tigers have been pretty good on offense, ranking in the top third of the league in both wOBA and ISO with Miggy leading the way in the three hole.
- Tigers Offense (2016)
Team wOBA vs. RHP — 0.335 (6 of 30)
Team ISO vs. RHP — 0.176 (10 of 30)
Team K% vs. RHP — 22.7% (22 of 30)
Runs Per Game — 4.78 (7 of 30)
Projected Run Total — 4.46 (11 of 30)
Projected Lineup
| # | Player | Bats | wOBA vs. RHP | ISO vs. RHP | wOBA L14 | FD Position | FD Salary | DK Position | DK Salary |
| 1 | | RIGHT | 0.338 | 0.151 | 0.320 | 2B | $3,600 | 2B | $4,200 |
| 2 | | RIGHT | 0.305 | 0.082 | 0.231 | OF | $3,100 | OF | $3,800 |
| 3 | | RIGHT | 0.420 | 0.227 | 0.425 | 1B | $3,900 | 1B | $4,100 |
| 4 | | SWITCH | 0.297 | 0.145 | 0.318 | C | $3,100 | 1B | $3,300 |
| 5 | | RIGHT | 0.313 | 0.167 | 0.306 | 3B | $3,400 | 3B | $3,500 |
| 6 | | RIGHT | 0.338 | 0.201 | 0.381 | OF | $3,000 | OF | $4,100 |
| 7 | | LEFT | 0.365 | 0.257 | 0.516 | OF | $2,700 | OF | $2,400 |
| 8 | | SWITCH | 0.317 | 0.210 | 0.261 | C | $2,100 | C | $3,100 |
| 9 | | RIGHT | 0.292 | 0.059 | 0.380 | SS | $2,600 | SS | $2,900 |
| | Team Averages | — | 0.332 | 0.167 | 0.349 | — | — | — | — |
Elite Plays –
Secondary Plays – , ,
Stackability – None
Chicago Cubs at Miami – 1:10 PM ET
| Chicago Cubs | Miami |
 | |  | |
| RIGHT | RIGHT |
| Vegas Moneyline | Vegas Over/Under |
| MIA -155 | 6.5 |
| Stats | wOBA | HR All. | K% | BB% | Stats | wOBA | HR All. | K% | BB% |
| SP vs. Left | 0.311 | 10 | 22.4% | 9.3% | SP vs. Left | 0.320 | 6 | 27.4% | 8.9% |
| SP vs. Right | 0.287 | 21 | 23.6% | 3.9% | SP vs. Right | 0.206 | 3 | 39.6% | 4.8% |
Pitcher Grind Down
| Jason Hammel |
 | FanDuel | DraftKings |
| Salary: | $8,400 | Salary: | $7,600 |
| FPPG: | 28.8 | FPPG: | 15.2 |
| Pitcher Rating: | 66.7 | Pitcher Rank: | 9 |
| Statistics | Starts | PitchPS | SIERA | ERA | K% | BB% | SS% | GB% | FB% | HH% |
| L30 Days | 6 | 81.5 | 4.33 | 2.86 | 17.9% | 5.2% | 10.0% | 41.4% | 40.4% | 33.7% |
| 2016 | 14 | 87.6 | 4.21 | 2.55 | 20.6% | 7.7% | 10.0% | 44.4% | 36.3% | 29.3% |
| 2015 | 31 | 88.7 | 3.45 | 3.74 | 24.2% | 5.6% | 10.9% | 38.3% | 37.2% | 32.9% |
: Cubs pitching, for the most part this season, has been absolutely fantastic and it gets lost behind the fact that the offense is so good most of the time. Hammel is a guy I like a lot as a secondary option on DK specifically because of his price and the win being something we worry less about. He is coming off of a poor outing against the Cardinals, but look for a solid bounce back against a Miami squad that we can target with solid pitching.
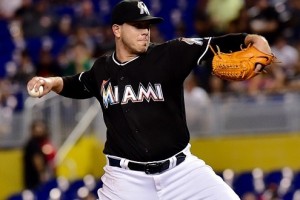
| Jose Fernandez |
 | FanDuel | DraftKings |
| Salary: | $10,900 | Salary: | $13,100 |
| FPPG: | 48.4 | FPPG: | 27.4 |
| Pitcher Rating: | 96.5 | Pitcher Rank: | 2 |
| Statistics | Starts | PitchPS | SIERA | ERA | K% | BB% | SS% | GB% | FB% | HH% |
| L30 Days | 5 | 96.6 | 1.90 | 1.32 | 38.2% | 2.4% | 14.5% | 45.7% | 34.3% | 33.3% |
| 2016 | 14 | 100.0 | 2.58 | 2.36 | 36.8% | 7.9% | 14.5% | 41.7% | 31.7% | 33.5% |
| 2015 | 11 | 90.2 | 2.77 | 2.92 | 29.8% | 5.3% | 13.3% | 40.1% | 31.1% | 29.4% |
: It will be very interesting to see how people treat Fernandez today with Kershaw also on the board and a Cubs team in town that can hit just about anyone. When a guy flashes a 36.8% strikeout rate you have to pay attention, and in my mind, if he is going to be skipped over for Kershaw then we need to grab a healthy amount of exposure to Jose, who has plenty of upside and is pitching deeper into games now.
Batter Grind Down
Chicago Cubs
Cubs: For as good as this offense is they do strike out a lot and that worries me a bit. With Fernandez on the hill, this is not a place I am looking to load up on bats and you want to choose them sparingly. The one good thing about facing an elite pitcher is you are able to roster them at some of their cheapest prices in quite some time.
- Cubs Offense (2016)
Team wOBA vs. RHP — 0.332 (7 of 30)
Team ISO vs. RHP — 0.171 (11 of 30)
Team K% vs. RHP — 22.0% (18 of 30)
Runs Per Game — 5.30 (2 of 30)
Projected Run Total — 2.93 (28 of 30)
Projected Lineup
| # | Player | Bats | wOBA vs. RHP | ISO vs. RHP | wOBA L14 | FD Position | FD Salary | DK Position | DK Salary |
| 1 | | LEFT | 0.337 | 0.146 | 0.330 | OF | $2,200 | OF | $2,500 |
| 2 | | RIGHT | 0.374 | 0.216 | 0.342 | 3B | $2,500 | 3B/OF | $3,500 |
| 3 | | LEFT | 0.397 | 0.268 | 0.508 | 1B | $2,800 | 1B | $3,900 |
| 4 | | SWITCH | 0.348 | 0.171 | 0.288 | 2B | $2,400 | 2B | $3,000 |
| 5 | | RIGHT | 0.804 | 1.000 | 0.650 | C | $2,100 | C | $3,600 |
| 6 | | LEFT | 0.324 | 0.189 | 0.344 | OF | $2,400 | 2B/OF | $2,100 |
| 7 | | RIGHT | 0.326 | 0.151 | 0.395 | SS | $2,200 | SS | $2,600 |
| 8 | | RIGHT | 0.271 | 0.132 | 0.319 | SS | $2,200 | 3B/SS | $2,600 |
| 9 | | RIGHT | 0.185 | 0.038 | 0.146 | P | $8,400 | P | $7,600 |
| | Team Averages | — | 0.374 | 0.257 | 0.369 | — | — | — | — |
Elite Plays – None
Secondary Plays – , ,
Stackability – None
Miami
Marlins: Miami is the reverse of Chicago in that they cannot hit as well but do not strikeout a ton. This is a less than stellar lineup that really should be avoided on most full slates such as this but you still have some options in guys like Bour and Yelich who are a bit under rated.
- Marlins Offense (2016)
Team wOBA vs. RHP — 0.318 (12 of 30)
Team ISO vs. RHP — 0.135 (26 of 30)
Team K% vs. RHP — 18.9% (6 of 30)
Runs Per Game — 4.10 (21 of 30)
Projected Run Total — 3.57 (27 of 30)
Projected Lineup
| # | Player | Bats | wOBA vs. RHP | ISO vs. RHP | wOBA L14 | FD Position | FD Salary | DK Position | DK Salary |
| 1 | | LEFT | 0.266 | 0.036 | 0.449 | OF | $2,800 | OF | $3,600 |
| 2 | | RIGHT | 0.311 | 0.096 | 0.401 | 3B | $2,900 | 3B | $3,400 |
| 3 | | LEFT | 0.367 | 0.153 | 0.343 | OF | $3,500 | OF | $4,000 |
| 4 | | RIGHT | 0.311 | 0.147 | 0.467 | OF | $3,500 | OF | $4,800 |
| 5 | | RIGHT | 0.344 | 0.249 | 0.297 | OF | $3,500 | OF | $3,700 |
| 6 | | LEFT | 0.363 | 0.254 | 0.535 | 1B | $3,400 | 1B | $4,000 |
| 7 | | RIGHT | 0.311 | 0.129 | 0.379 | C | $3,000 | C | $3,500 |
| 8 | | RIGHT | 0.273 | 0.083 | 0.267 | SS | $2,300 | SS | $2,700 |
| 9 | | RIGHT | 0.185 | 0.038 | 0.146 | P | $8,400 | P | $7,600 |
| | Team Averages | — | 0.303 | 0.132 | 0.365 | — | — | — | — |
Elite Plays – None
Secondary Plays – , , ,
Stackability – None
San Diego at Cincinnati – 1:10 PM ET
| San Diego | Cincinnati |
 | |  | |
| RIGHT | RIGHT |
| Vegas Moneyline | Vegas Over/Under |
| CIN -135 | 10.0 |
| Stats | wOBA | HR All. | K% | BB% | Stats | wOBA | HR All. | K% | BB% |
| SP vs. Left | 0.398 | 6 | 12.9% | 7.8% | SP vs. Left | 0.347 | 14 | 18.6% | 9.4% |
| SP vs. Right | 0.438 | 3 | 22.6% | 11.3% | SP vs. Right | 0.302 | 5 | 19.1% | 4.8% |
Pitcher Grind Down
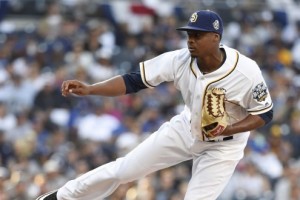
| Luis Perdomo |
 | FanDuel | DraftKings |
| Salary: | $6,700 | Salary: | $4,000 |
| FPPG: | 7.7 | FPPG: | 2.2 |
| Pitcher Rating: | 48.5 | Pitcher Rank: | 20 |
| Statistics | Starts | PitchPS | SIERA | ERA | K% | BB% | SS% | GB% | FB% | HH% |
| L30 Days | 3 | 162.0 | 3.25 | 8.89 | 22.1% | 7.1% | 12.8% | 61.4% | 20.5% | 30.7% |
| 2016 | 4 | 222.3 | 4.08 | 9.00 | 17.9% | 9.6% | 10.6% | 56.2% | 21.3% | 32.9% |
: If you just look at his ERA, then he is a guy who you would want to completely avoid today. The thing is, he has given up some timely home runs and actually offers a decent strikeout rate. I would not go near him in cash, but at this price you can pair him with one of the top tier arms and still get plenty of bats, making him a tournament worthy play. Just understand the risk that comes with it too.
| Anthony DeSclafani |
 | FanDuel | DraftKings |
| Salary: | $6,500 | Salary: | $8,100 |
| FPPG: | 25.7 | FPPG: | 11.7 |
| Pitcher Rating: | 49.4 | Pitcher Rank: | 19 |
| Statistics | Starts | PitchPS | SIERA | ERA | K% | BB% | SS% | GB% | FB% | HH% |
| L30 Days | 3 | 94.7 | 5.18 | 2.30 | 14.3% | 10.0% | 9.5% | 44.0% | 28.0% | 26.9% |
| 2016 | 3 | 94.7 | 5.17 | 2.30 | 14.3% | 10.0% | 9.5% | 44.0% | 28.0% | 26.9% |
| 2015 | 31 | 94.0 | 4.08 | 4.05 | 19.2% | 7.0% | 9.5% | 45.1% | 33.6% | 31.4% |
: Everyone knows that you can attack the Padres with right handed pitching but there is no way I am doing it with DeSclafani in Great American Ballpark at his price point. The walks are happening too often and the strikeouts are not taking him off the board for me even in a high risk gpp lineup.
Batter Grind Down
San Diego
Padres: Even with the recent signs of life in the San Diego offense, they still rank near the bottom of the league against righties, so we probably do not want to get too crazy here. continues to hit the ball hard and is priced to the point where most do not want to go. I believe they will put up some runs, but at the same time do not trust that many bats.
- Padres Offense (2016)
Team wOBA vs. RHP — 0.279 (30 of 30)
Team ISO vs. RHP — 0.133 (27 of 30)
Team K% vs. RHP — 24.0% (26 of 30)
Runs Per Game — 4.15 (20 of 30)
Projected Run Total — 4.79 (8 of 30)
Projected Lineup
| # | Player | Bats | wOBA vs. RHP | ISO vs. RHP | wOBA L14 | FD Position | FD Salary | DK Position | DK Salary |
| 1 | | LEFT | 0.292 | 0.117 | 0.303 | OF | $2,700 | OF | $3,200 |
| 2 | | RIGHT | 0.339 | 0.215 | 0.393 | 1B | $4,400 | 1B | $5,300 |
| 3 | | RIGHT | 0.305 | 0.168 | 0.431 | OF | $3,800 | OF | $4,200 |
| 4 | | SWITCH | 0.327 | 0.158 | 0.185 | 3B | $2,700 | 2B/3B | $3,400 |
| 5 | | RIGHT | 0.299 | 0.140 | 0.375 | OF | $3,300 | OF | $4,900 |
| 6 | | RIGHT | 0.286 | 0.156 | 0.307 | C | $3,500 | C | $3,600 |
| 7 | | RIGHT | 0.265 | 0.102 | 0.242 | SS | $2,700 | SS | $2,600 |
| 8 | | LEFT | 0.284 | 0.125 | 0.269 | 3B | $2,200 | 2B/3B | $2,000 |
| 9 | | RIGHT | 0.176 | 0.000 | 0.585 | P | $6,700 | P | $4,000 |
| | Team Averages | — | 0.286 | 0.131 | 0.343 | — | — | — | — |
Elite Plays –
Secondary Plays – , ,
Stackability – None
Cincinnati
Reds: The Reds are sneaky in that they do not consistently hit and then all the sudden lay a big number on a team with the power early in the lineup. I like Perdomo a lot at his price point,but he is a bit susceptible to the long ball, making guys like , , and attractive here.
- Reds Offense (2016)
Team wOBA vs. RHP — 0.297 (26 of 30)
Team ISO vs. RHP — 0.169 (12 of 30)
Team K% vs. RHP — 22.8% (24 of 30)
Runs Per Game — 4.35 (15 of 30)
Projected Run Total — 5.21 (4 of 30)
Projected Lineup
| # | Player | Bats | wOBA vs. RHP | ISO vs. RHP | wOBA L14 | FD Position | FD Salary | DK Position | DK Salary |
| 1 | | RIGHT | 0.323 | 0.191 | 0.295 | SS | $3,800 | SS | $5,000 |
| 2 | | LEFT | 0.407 | 0.227 | 0.388 | 1B | $3,400 | 1B | $4,900 |
| 3 | | RIGHT | 0.309 | 0.115 | 0.234 | 2B | $3,000 | 2B | $3,800 |
| 4 | | LEFT | 0.337 | 0.261 | 0.399 | OF | $3,900 | OF | $5,400 |
| 5 | | RIGHT | 0.370 | 0.357 | 0.316 | OF | $3,600 | OF | $5,600 |
| 6 | | RIGHT | 0.301 | 0.161 | 0.292 | 3B | $3,100 | 3B | $4,400 |
| 7 | | SWITCH | 0.253 | 0.061 | 0.125 | OF | $2,800 | OF | $4,400 |
| 8 | | SWITCH | 0.285 | 0.083 | 0.214 | C | $2,200 | C | $2,800 |
| 9 | | RIGHT | 0.156 | 0.020 | 0.000 | P | $6,500 | P | $8,100 |
| | Team Averages | — | 0.305 | 0.164 | 0.251 | — | — | — | — |
Elite Plays –
Secondary Plays – , ,
Stackability – None
Jump to Page 1 2 3
