MLB Grind Down: Tuesday, April 26th
The RotoGrinders MLB Grind Down will give you an in-depth analysis into the upcoming MLB schedule. This article will break down the numbers for every single game and give you analysis on which trends you can exploit. While matchups are a major factor in daily fantasy baseball, there are plenty of other factors to consider such as injuries, weather, and salaries.
The analysis should point you in the right direction, but it is still up to you to decipher the information and make your own selections. No sport has more variance than baseball. The best choice is not always the right choice but following the trends will win you money over time.
Note: As always, if you want to try a new DFS site, be sure to click through a RotoGrinders link and use our DraftKings promo code and FanDuel promo code to receive the best perks in the industry.
Philadelphia at Washington – 7:05 PM
| Philadelphia | Washington |
 | |  | |
| RIGHT | RIGHT |
| Vegas Moneyline | Vegas Over/Under |
| WAS -200 | 7.0 |
| Stats | wOBA | HR All. | K% | BB% | Stats | wOBA | HR All. | K% | BB% |
| SP vs. Left | 0.276 | 4 | 25.2% | 8.6% | SP vs. Left | 0.288 | 14 | 25.7% | 6.0% |
| SP vs. Right | 0.309 | 3 | 32.4% | 7.0% | SP vs. Right | 0.240 | 17 | 34.6% | 2.2% |
Pitcher Grind Down
| Vince Velasquez |
 | FanDuel: | DraftKings: |
| Salary:$7,800 | Salary:$9,400 |
| FPPG:54.3 | FPPG:33.8 |
| Pitcher Rating:67.7 | Pitcher Rank:11 |
| Statistics | Starts | SIERA | K% | BB% | GB% | O-wOBA | O-K% |
| 2016 | 3 | 1.83 | 39.2% | 4.1% | 34.1% | 17 | 16 |
| 2015 | 7 | 3.74 | 25.1% | 9.1% | 31.3% | 18 | 28 |
After striking out 25 batters without giving up a single run in his first start, Velasquez came crashing back down to Earth against the Mets. He allowed five runs in just over four innings of work. He is still a raw talent, but we have seen the type of upside that he possesses. Even in 2015, he had a strikeout rate over 25%. While he comes into tonight’s game as a huge underdog, he still makes an excellent tournament play thanks to his strikeout potential.
| Max Scherzer |
 | FanDuel: | DraftKings: |
| Salary:$10,500 | Salary:$12,900 |
| FPPG:33.0 | FPPG:16.9 |
| Pitcher Rating:94.8 | Pitcher Rank:2 |
| Statistics | Starts | SIERA | K% | BB% | GB% | O-wOBA | O-K% |
| 2016 | 4 | 3.90 | 22.3% | 7.8% | 41.8% | 22 | 20 |
| 2015 | 33 | 2.63 | 30.7% | 3.8% | 35.8% | 29 | 21 |
Scherzer continues to give up the long ball, which continue to kill his fantasy outings. In his last 37 starts, he has allowed 31 home runs. While his HR/FB rate is well above his career average, it’s still a concern moving forward. The good news is that he is still striking out hitters at an elite rate. He should be able to limit the damage against him tonight in a favorable matchup against the Phillies. Over the last two seasons, Philadelphia is ranked in the bottom ten in both team wOBA and strikeout rate against right-handed pitching. Scherzer grades out as the second best pitcher in the slate behind .
Batter Grind Down
Philadelphia
- Phillies Offense
Team wOBA vs. RHP — 0.297 (28 of 30)
Team ISO vs. RHP — 0.137 (27 of 30)
Runs Per Game — 3.26 (28 of 30)
Projected Run Total — 2.92 (28 of 30)
The Phillies have not hit right-handed pitching well, ranking 28th in team wOBA and 27th in team ISO over the last two seasons. They are only averaging 3.26 runs per game and they come into tonight’s contest with the third lowest team total on the board. They can easily be avoided tonight against in Nationals Park.
Projected Lineup
| # | Player | Bats | wOBA vs. RHP | ISO vs. RHP | FD Position | FD Salary | DK Position | DK Salary |
| 1 | | LEFT | 0.343 | 0.132 | OF | $3,400 | OF | $3,300 |
| 2 | | RIGHT | 0.299 | 0.081 | 2B | $2,200 | 2B | $2,300 |
| 3 | | RIGHT | 0.366 | 0.208 | 3B | $3,500 | 3B | $3,400 |
| 4 | | LEFT | 0.332 | 0.236 | 1B | $2,300 | 1B | $3,200 |
| 5 | | RIGHT | 0.239 | 0.059 | C | $2,500 | C | $2,000 |
| 6 | | SWITCH | 0.296 | 0.114 | SS | $2,700 | SS | $3,000 |
| 7 | | LEFT | 0.244 | 0.119 | OF | $2,100 | OF | $2,000 |
| 8 | | RIGHT | 0.000 | 0.000 | P | $7,800 | P | $9,400 |
| 9 | | RIGHT | 0.263 | 0.129 | OF | $2,100 | OF | $2,300 |
| | Team Averages | — | 0.265 | 0.120 | — | $3,178 | — | $3,433 |
Elite Plays – NONE
Secondary Plays – NONE
Stackability – NONE
Washington
- Nationals Offense
Team wOBA vs. RHP — 0.310 (18 of 30)
Team ISO vs. RHP — 0.150 (13 of 30)
Runs Per Game — 4.39 (10 of 30)
Projected Run Total — 4.08 (13 of 30)
The Nationals’ offense has been above-average so far, but that is largely thanks to one player – . He is on pace to have a historical season and he now has a .478 wOBA and a .373 ISO against right-handed pitching over the last two seasons. is an impressive young pitcher, but Harper remains an elite play in all league formats.
Projected Lineup
| # | Player | Bats | wOBA vs. RHP | ISO vs. RHP | FD Position | FD Salary | DK Position | DK Salary |
| 1 | | RIGHT | 0.265 | 0.122 | OF | $2,300 | OF | $2,900 |
| 2 | | RIGHT | 0.303 | 0.094 | 3B | $2,700 | 3B | $3,400 |
| 3 | | LEFT | 0.478 | 0.373 | OF | $5,700 | OF | $5,400 |
| 4 | | RIGHT | 0.290 | 0.151 | 1B | $2,700 | 1B | $3,100 |
| 5 | | LEFT | 0.354 | 0.197 | 2B | $3,500 | 2B | $4,100 |
| 6 | | RIGHT | 0.296 | 0.142 | OF | $3,100 | OF | $3,400 |
| 7 | | RIGHT | 0.275 | 0.132 | C | $2,800 | C | $3,400 |
| 8 | | SWITCH | 0.297 | 0.159 | SS | $2,200 | SS | $2,400 |
| 9 | | RIGHT | 0.180 | 0.019 | P | $10,500 | P | $12,900 |
| | Team Averages | — | 0.304 | 0.154 | — | $3,125 | — | $3,513 |
Elite Plays –
Secondary Plays – NONE
Stackability – NONE
Chicago White Sox at Toronto – 7:07 PM
| Chicago White Sox | Toronto |
 | |  | |
| LEFT | RIGHT |
| Vegas Moneyline | Vegas Over/Under |
| CWS -115 | 8.0 |
| Stats | wOBA | HR All. | K% | BB% | Stats | wOBA | HR All. | K% | BB% |
| SP vs. Left | 0.272 | 0 | 33.5% | 5.6% | SP vs. Left | 0.295 | 11 | 12.6% | 8.4% |
| SP vs. Right | 0.275 | 25 | 30.7% | 4.5% | SP vs. Right | 0.327 | 15 | 16.7% | 6.3% |
Pitcher Grind Down
| Chris Sale |
 | FanDuel: | DraftKings: |
| Salary:$10,900 | Salary:$12,000 |
| FPPG:49.5 | FPPG:29.0 |
| Pitcher Rating:87.9 | Pitcher Rank:3 |
| Statistics | Starts | SIERA | K% | BB% | GB% | O-wOBA | O-K% |
| 2016 | 4 | 3.06 | 23.9% | 2.8% | 50.0% | 16 | 25 |
| 2015 | 31 | 2.52 | 32.1% | 4.9% | 42.6% | 1 | 3 |
Sale’s strikeout rate has been down a bit this season, but we can chalk that up to a small sample size. In 2015, he posted a ridiculous strikeout rate of 32.1%. While he is generally one of the top pitching options on the slate, he draws an awful matchup against the Blue Jays in Toronto. This is one of the only opportunities that we can target him at such a low ownership, but it’s hard to take him over or , even in tournaments.
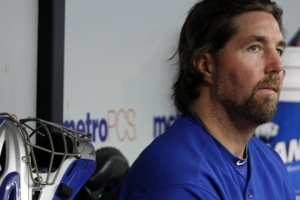
| R.A. Dickey |
 | FanDuel: | DraftKings: |
| Salary:$7,500 | Salary:$7,000 |
| FPPG:22.3 | FPPG:9.9 |
| Pitcher Rating:35.1 | Pitcher Rank:24 |
| Statistics | Starts | SIERA | K% | BB% | GB% | O-wOBA | O-K% |
| 2016 | 4 | 4.33 | 20.0% | 10.5% | 45.5% | 28 | 6 |
| 2015 | 33 | 4.76 | 14.3% | 6.9% | 41.9% | 25 | 16 |
Dickey has been one of my favorite pitchers to pick on over the last two seasons. His strikeout rate continues to go down and his command continues to get worse. In his four starts this season, he has walked over 10% of the batters that he has faced. At this point in his career, Dickey can be avoided for DFS purposes, especially when he is pitching at home in the hitter-friendly Rogers Centre.
Batter Grind Down
Chicago White Sox
- White Sox Offense
Team wOBA vs. RHP — 0.305 (24 of 30)
Team ISO vs. RHP — 0.137 (28 of 30)
Runs Per Game — 3.40 (26 of 30)
Projected Run Total — 4.09 (12 of 30)
The White Sox continue to struggle offensively, ranking 26th in runs scored per game this season. While they only have the 12th highest team total on the board, I love the matchup against in the Rogers Centre. When Dickey is on the mound, I always like to look at BvP thanks to his unique pitching style (knuckleball). , , and all have a good track record against him.
Projected Lineup
| # | Player | Bats | wOBA vs. RHP | ISO vs. RHP | FD Position | FD Salary | DK Position | DK Salary |
| 1 | | LEFT | 0.359 | 0.164 | OF | $2,800 | OF | $3,900 |
| 2 | | SWITCH | 0.263 | 0.127 | SS | $2,600 | SS | $3,300 |
| 3 | | RIGHT | 0.371 | 0.233 | 1B | $3,000 | 1B | $4,000 |
| 4 | | RIGHT | 0.331 | 0.216 | 3B | $3,800 | 3B | $3,900 |
| 5 | | SWITCH | 0.331 | 0.131 | OF | $3,300 | OF | $3,200 |
| 6 | | RIGHT | 0.291 | 0.129 | 2B | $2,700 | 2B | $3,400 |
| 7 | | RIGHT | 0.282 | 0.112 | OF | $2,400 | OF | $3,200 |
| 8 | | SWITCH | 0.259 | 0.084 | C | $2,100 | C | $2,600 |
| 9 | | RIGHT | 0.281 | 0.093 | OF | $2,100 | OF | $3,000 |
| | Team Averages | — | 0.308 | 0.143 | — | $2,756 | — | $3,389 |
Elite Plays – ,
Secondary Plays – ,
Stackability – GPP
Toronto
- Blue Jays Offense
Team wOBA vs. LHP — 0.354 (1 of 30)
Team ISO vs. LHP — 0.186 (1 of 30)
Runs Per Game — 4.29 (14 of 30)
Projected Run Total — 3.91 (19 of 30)
The Blue Jays’ offense has gotten off to a slow start this season, but they are still ranked first in team wOBA and team ISO against left-handed pitching since the start of last season. While I don’t want to target against the Blue Jays, I also want to avoid the Blue Jays against Sale. This is a situation where it’s best to avoid both the pitcher and the offense that he is facing.
Projected Lineup
| # | Player | Bats | wOBA vs. LHP | ISO vs. LHP | FD Position | FD Salary | DK Position | DK Salary |
| 1 | | RIGHT | 0.294 | 0.080 | OF | $2,900 | OF | $2,700 |
| 2 | | RIGHT | 0.454 | 0.369 | 3B | $4,900 | 3B | $4,600 |
| 3 | | RIGHT | 0.374 | 0.231 | OF | $4,500 | OF | $4,100 |
| 4 | | RIGHT | 0.365 | 0.207 | 1B | $3,700 | 1B | $3,300 |
| 5 | | RIGHT | 0.362 | 0.173 | SS | $3,700 | SS | $3,400 |
| 6 | | SWITCH | 0.322 | 0.261 | 1B | $2,200 | 1B | $2,600 |
| 7 | | LEFT | 0.382 | 0.184 | OF | $3,100 | OF | $2,400 |
| 8 | | RIGHT | 0.372 | 0.235 | SS | $2,400 | 2B | $2,000 |
| 9 | | LEFT | 0.304 | 0.222 | C | $2,000 | C | $2,300 |
| | Team Averages | — | 0.359 | 0.218 | — | $3,267 | — | $3,044 |
Elite Plays – NONE
Secondary Plays –
Stackability – NONE
Oakland at Detroit – 7:08 PM
| Oakland | Detroit |
 | |  | |
| LEFT | RIGHT |
| Vegas Moneyline | Vegas Over/Under |
| OAK -120 | 9.0 |
| Stats | wOBA | HR All. | K% | BB% | Stats | wOBA | HR All. | K% | BB% |
| SP vs. Left | 0.244 | 0 | 33.3% | 4.8% | SP vs. Left | 0.382 | 7 | 11.8% | 12.4% |
| SP vs. Right | 0.263 | 3 | 34.0% | 8.0% | SP vs. Right | 0.314 | 6 | 12.1% | 2.5% |
Pitcher Grind Down
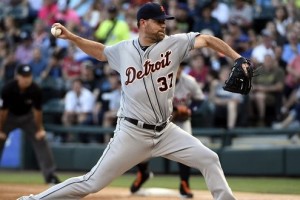
| Rich Hill |
 | FanDuel: | DraftKings: |
| Salary:$7,700 | Salary:$7,700 |
| FPPG:36.8 | FPPG:18.7 |
| Pitcher Rating:68.5 | Pitcher Rank:9 |
| Statistics | Starts | SIERA | K% | BB% | GB% | O-wOBA | O-K% |
| 2016 | 4 | 2.85 | 33.7% | 10.5% | 54.5% | 11 | 2 |
| 2015 | 4 | 2.29 | 34.0% | 4.7% | 48.4% | 2 | 20 |
Hill continues to impress with each and every start. His comeback is truly remarkable and from a fan’s perspective, I hope it continues. In his four starts this season, he has a 2.85 SIERA with a strikeout rate of 33.7%. He is listed as a small favorite tonight against the Tigers, but the over/under is set at 9.0 runs. In a difficult matchup against the Tigers, Hill should only be targeted as a GPP play. The upside is there, but so is the risk.
| Mike Pelfrey |
 | FanDuel: | DraftKings: |
| Salary:$5,800 | Salary:$5,100 |
| FPPG:16.7 | FPPG:5.9 |
| Pitcher Rating:25.4 | Pitcher Rank:30 |
| Statistics | Starts | SIERA | K% | BB% | GB% | O-wOBA | O-K% |
| 2016 | 3 | 6.24 | 11.3% | 16.9% | 52.0% | 25 | 10 |
| 2015 | 30 | 4.59 | 12.0% | 6.3% | 50.8% | 21 | 4 |
Pelfrey has been awful in his first three starts this season, posting a 6.24 SIERA with a walk rate (16.9%) that is higher than his strikeout rate (11.3%). While the A’s are not a great offensive team, they should be able to knock him around a bit tonight. Pelfrey should not be on your radar, as he is an underdog at home in a game that features one of the highest over/unders on the board.
Batter Grind Down
Oakland
- Athletics Offense
Team wOBA vs. RHP — 0.307 (22 of 30)
Team ISO vs. RHP — 0.146 (21 of 30)
Runs Per Game — 3.45 (25 of 30)
Projected Run Total — 4.62 (3 of 30)
The A’s are ranked 21st or worse in team wOBA vs. RHP, team ISO vs. RHP, and runs per game. It’s safe to say that their offense has not been producing so far. I bring that up because it makes the fact that they have the third highest team total tonight even more impressive. They make an intriguing stack for both cash games and tournaments and their is a ton of value to be had in this lineup. The average hitter’s salary is $2,633 on FanDuel and $3,467 on DraftKings.
Projected Lineup
| # | Player | Bats | wOBA vs. RHP | ISO vs. RHP | FD Position | FD Salary | DK Position | DK Salary |
| 1 | | SWITCH | 0.305 | 0.104 | OF | $2,900 | OF | $4,200 |
| 2 | | LEFT | 0.354 | 0.221 | 3B | $2,600 | 2B/3B | $3,300 |
| 3 | | LEFT | 0.360 | 0.203 | OF | $3,400 | OF | $4,000 |
| 4 | | SWITCH | 0.280 | 0.124 | 2B | $2,300 | 2B | $3,200 |
| 5 | | LEFT | 0.351 | 0.207 | C | $2,700 | C | $3,400 |
| 6 | | SWITCH | 0.238 | 0.082 | OF | $2,700 | OF | $3,200 |
| 7 | | RIGHT | 0.352 | 0.244 | OF | $2,700 | OF | $3,400 |
| 8 | | LEFT | 0.315 | 0.099 | 1B | $2,000 | 1B | $3,200 |
| 9 | | RIGHT | 0.283 | 0.137 | SS | $2,400 | SS | $3,300 |
| | Team Averages | — | 0.315 | 0.158 | — | $2,633 | — | $3,467 |
Elite Plays – , , ,
Secondary Plays – ,
Stackability – Cash & GPP
Detroit
- Tigers Offense
Team wOBA vs. LHP — 0.347 (2 of 30)
Team ISO vs. LHP — 0.177 (3 of 30)
Runs Per Game — 4.39 (10 of 30)
Projected Run Total — 4.38 (8 of 30)
The Tigers have been one of the best hitting teams in baseball against left-handed pitching over the last few seasons. They have a number of right-handed bats that feast on southpaws. has been sharp this season, but the Tigers still have the eighth highest team total on the board tonight. , , and are all in play thanks to their cheap price tags.
Projected Lineup
| # | Player | Bats | wOBA vs. LHP | ISO vs. LHP | FD Position | FD Salary | DK Position | DK Salary |
| 1 | | RIGHT | 0.368 | 0.167 | 2B | $3,800 | 2B | $4,600 |
| 2 | | RIGHT | 0.256 | 0.099 | OF | $2,800 | OF | $3,300 |
| 3 | | RIGHT | 0.408 | 0.198 | 1B | $3,400 | 1B | $4,500 |
| 4 | | SWITCH | 0.382 | 0.146 | C | $2,600 | 1B | $3,800 |
| 5 | | RIGHT | 0.395 | 0.276 | OF | $3,200 | OF | $3,800 |
| 6 | | RIGHT | 0.402 | 0.240 | 3B | $2,600 | 3B | $4,000 |
| 7 | | SWITCH | 0.390 | 0.320 | C | $2,900 | C | $3,800 |
| 8 | | LEFT | 0.252 | 0.071 | OF | $2,200 | OF | $2,600 |
| 9 | | RIGHT | 0.386 | 0.098 | SS | $2,200 | SS | $3,100 |
| | Team Averages | — | 0.360 | 0.179 | — | $2,856 | — | $3,722 |
Elite Plays – NONE
Secondary Plays – , ,
Stackability – NONE
Baltimore at Tampa Bay – 7:10 PM
| Baltimore | Tampa Bay |
 | |  | |
| RIGHT | RIGHT |
| Vegas Moneyline | Vegas Over/Under |
| TB -128 | 7.5 |
| Stats | wOBA | HR All. | K% | BB% | Stats | wOBA | HR All. | K% | BB% |
| SP vs. Left | 0.318 | 14 | 23.0% | 9.1% | SP vs. Left | 0.267 | 5 | 25.4% | 4.5% |
| SP vs. Right | 0.329 | 8 | 20.4% | 8.5% | SP vs. Right | 0.334 | 15 | 17.6% | 8.4% |
Pitcher Grind Down
| Ubaldo Jimenez |
 | FanDuel: | DraftKings: |
| Salary:$7,400 | Salary:$8,500 |
| FPPG:34.0 | FPPG:17.4 |
| Pitcher Rating:60.1 | Pitcher Rank:14 |
| Statistics | Starts | SIERA | K% | BB% | GB% | O-wOBA | O-K% |
| 2016 | 3 | 3.45 | 27.0% | 10.8% | 53.3% | 22 | 30 |
| 2015 | 32 | 3.93 | 21.2% | 8.6% | 49.1% | 21 | 23 |
Jimenez has pitched well so far this season, posting a 3.45 SIERA with a strikeout rate of 27%. While I want to believe in him, I need to see better command before trusting him in cash games. He walked 8.6% of the batters that he faced in 2015 and that number is up to 10.8% this season. He does draw a favorable matchup against the Rays though, who are ranked dead last in strikeout rate against right-handed pitching this season. Avoid him in cash games, but use Jimenez as a deep GPP flier tonight.
| Jake Odorizzi |
 | FanDuel: | DraftKings: |
| Salary:$7,500 | Salary:$8,300 |
| FPPG:26.8 | FPPG:14.9 |
| Pitcher Rating:68.1 | Pitcher Rank:10 |
| Statistics | Starts | SIERA | K% | BB% | GB% | O-wOBA | O-K% |
| 2016 | 4 | 3.35 | 24.2% | 4.2% | 36.8% | 3 | 22 |
| 2015 | 28 | 3.90 | 21.4% | 6.6% | 37.3% | 3 | 25 |
Odorizzi is off to a nice start this season, posting a 3.35 SIERA with a strikeout rate of 24.2%. He is always in play when he is pitching at home in Tropicana Field. His career ERA is two runs lower at home than it is on the road and his strikeout rate jumps up 3.5%. While the Orioles do have a lot of power in their lineup, they strikeout at one of the highest clips of any team in the majors. Dollar for dollar, Odorizzi is one of the top pitching options on the board tonight.
Batter Grind Down
Baltimore
- Orioles Offense
Team wOBA vs. RHP — 0.325 (3 of 30)
Team ISO vs. RHP — 0.186 (3 of 30)
Runs Per Game — 4.50 (9 of 30)
Projected Run Total — 3.58 (23 of 30)
The Orioles may be ranked third in both team wOBA and team ISO against right-handed pitching, but I’m not interested in their hitters tonight. They draw a very tough matchup against , who has held hitters to a .266 wOBA at home in his career. With the eighth lowest team total on the board, the Orioles can be avoided in all league formats.
Projected Lineup
| # | Player | Bats | wOBA vs. RHP | ISO vs. RHP | FD Position | FD Salary | DK Position | DK Salary |
| 1 | | RIGHT | 0.286 | 0.088 | OF | $2,700 | OF | $3,000 |
| 2 | | RIGHT | 0.400 | 0.252 | 3B | $4,700 | 3B/SS | $4,600 |
| 3 | | RIGHT | 0.336 | 0.204 | OF | $2,800 | OF | $3,400 |
| 4 | | LEFT | 0.414 | 0.353 | 1B | $4,300 | 1B | $4,000 |
| 5 | | RIGHT | 0.320 | 0.152 | OF | $3,900 | OF | $4,000 |
| 6 | | SWITCH | 0.319 | 0.147 | C | $2,500 | C | $2,700 |
| 7 | | RIGHT | 0.270 | 0.122 | SS | $2,800 | SS | $2,800 |
| 8 | | LEFT | 0.326 | 0.221 | 1B | $2,800 | 1B | $2,800 |
| 9 | | RIGHT | 0.357 | 0.250 | 2B | $2,400 | 2B | $2,900 |
| | Team Averages | — | 0.336 | 0.199 | — | $3,211 | — | $3,356 |
Elite Plays – NONE
Secondary Plays – NONE
Stackability – NONE
Tampa Bay
- Rays Offense
Team wOBA vs. RHP — 0.307 (21 of 30)
Team ISO vs. RHP — 0.145 (19 of 30)
Runs Per Game — 3.53 (24 of 30)
Projected Run Total — 3.92 (18 of 30)
The Rays draw a mediocre matchup tonight against , who comes into this game in good form. Jimenez has been hittable in the past though, allowing a .318+ wOBA to both left and right-handed hitters over the last two seasons. There are two Rays’ hitters on my radar from the Rays tonight, but they are best suited as GPP plays.
Projected Lineup
| # | Player | Bats | wOBA vs. RHP | ISO vs. RHP | FD Position | FD Salary | DK Position | DK Salary |
| 1 | | RIGHT | 0.329 | 0.114 | 2B | $3,700 | 2B | $3,700 |
| 2 | | LEFT | 0.303 | 0.181 | 1B | $2,000 | 1B | $2,900 |
| 3 | | RIGHT | 0.302 | 0.150 | 3B | $3,100 | 3B | $3,600 |
| 4 | | LEFT | 0.414 | 0.316 | OF | $3,200 | OF | $3,200 |
| 5 | | RIGHT | 0.293 | 0.084 | OF | $2,600 | OF | $3,400 |
| 6 | | LEFT | 0.327 | 0.171 | SS | $2,000 | SS | $2,900 |
| 7 | | RIGHT | 0.324 | 0.192 | OF | $3,100 | OF | $3,500 |
| 8 | | LEFT | 0.331 | 0.183 | OF | $2,700 | OF | $3,300 |
| 9 | | RIGHT | 0.337 | 0.304 | C | $2,000 | C | $2,700 |
| | Team Averages | — | 0.329 | 0.188 | — | $2,711 | — | $3,244 |
Elite Plays – NONE
Secondary Plays – ,
Stackability – NONE
Boston at Atlanta – 7:10 PM
| Boston | Atlanta |
 | |  | |
| LEFT | RIGHT |
| Vegas Moneyline | Vegas Over/Under |
| BOS -180 | 7.0 |
| Stats | wOBA | HR All. | K% | BB% | Stats | wOBA | HR All. | K% | BB% |
| SP vs. Left | 0.279 | 4 | 21.2% | 3.4% | SP vs. Left | 0.404 | 12 | 10.4% | 11.8% |
| SP vs. Right | 0.278 | 16 | 27.6% | 6.0% | SP vs. Right | 0.269 | 7 | 21.1% | 3.9% |
Pitcher Grind Down
| David Price |
 | FanDuel: | DraftKings: |
| Salary:$9,400 | Salary:$11,400 |
| FPPG:33.5 | FPPG:16.7 |
| Pitcher Rating:86.7 | Pitcher Rank:4 |
| Statistics | Starts | SIERA | K% | BB% | GB% | O-wOBA | O-K% |
| 2016 | 4 | 2.58 | 33.0% | 6.2% | 34.5% | 29 | 19 |
| 2015 | 32 | 3.27 | 25.3% | 5.3% | 40.4% | 29 | 11 |
Price has allowed 17 runs this season in his first four starts with the Red Sox. Boston fans are already clamoring that he was a waste of money, but give it some time. As I mentioned yesterday with , the sample size is too small to make any judgments. Plus, if you look at Price’s advanced statistics, he has actually pitched much better than his ERA would indicate. I fully expect Price to bounce back tonight against the Braves and his $9,400 price tag on FanDuel is awfully appealing.
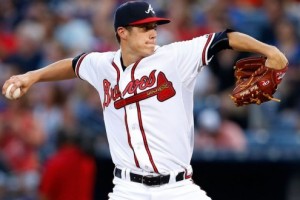
| Matt Wisler |
 | FanDuel: | DraftKings: |
| Salary:$5,900 | Salary:$6,000 |
| FPPG:22.0 | FPPG:12.9 |
| Pitcher Rating:35.4 | Pitcher Rank:23 |
| Statistics | Starts | SIERA | K% | BB% | GB% | O-wOBA | O-K% |
| 2016 | 3 | 3.91 | 19.5% | 4.9% | 45.0% | 5 | 13 |
| 2015 | 19 | 4.98 | 15.1% | 8.4% | 33.6% | 8 | 3 |
Wisler pitched well against the Dodgers in his last start, but still doesn’t fit the mold of what we are looking for from a pitcher. His strikeout rate is well below 20% and he plays on a team that doesn’t provide run support. He is a huge underdog tonight against the Red Sox, who are one of the best offenses in baseball against right-handed pitching.
Batter Grind Down
Boston
- Red Sox Offense
Team wOBA vs. RHP — 0.319 (7 of 30)
Team ISO vs. RHP — 0.150 (13 of 30)
Runs Per Game — 4.79 (8 of 30)
Projected Run Total — 3.96 (17 of 30)
The Red Sox may be playing in a National League ballpark, but they are still an interesting team to target tonight. They draw a slightly favorable matchup against , who has allowed a .404 wOBA and 12 home runs to left-handed hitters in his last 22 starts. is expected to sit out again tonight, as there is no designated hitter in the National League.
Projected Lineup
| # | Player | Bats | wOBA vs. RHP | ISO vs. RHP | FD Position | FD Salary | DK Position | DK Salary |
| 1 | | RIGHT | 0.348 | 0.194 | OF | $4,600 | OF | $4,900 |
| 2 | | RIGHT | 0.349 | 0.136 | 2B | $3,400 | 2B | $3,700 |
| 3 | | RIGHT | 0.323 | 0.107 | SS | $3,700 | SS | $3,600 |
| 4 | | RIGHT | 0.311 | 0.158 | 1B | $2,800 | 1B | $4,000 |
| 5 | | LEFT | 0.347 | 0.175 | 3B | $2,900 | 3B | $3,400 |
| 6 | | LEFT | 0.317 | 0.109 | OF | $2,900 | OF | $3,400 |
| 7 | | RIGHT | 0.245 | 0.063 | C | $2,000 | C | $2,700 |
| 8 | | LEFT | 0.320 | 0.225 | OF | $2,300 | OF | $3,100 |
| 9 | | LEFT | 0.000 | 0.000 | P | $9,400 | P | $11,400 |
| | Team Averages | — | 0.284 | 0.130 | — | $3,075 | — | $3,600 |
Elite Plays –
Secondary Plays – ,
Stackability – NONE
Atlanta
- Braves Offense
Team wOBA vs. LHP — 0.284 (30 of 30)
Team ISO vs. LHP — 0.107 (30 of 30)
Runs Per Game — 3.21 (29 of 30)
Projected Run Total — 3.04 (26 of 30)
The Braves’ offense has some ugly trends converging for tonight’s game. They are the worst offense in baseball against left-handed pitching, they are ranked 29th in runs scored per game, and they have the fifth lowest team total on the board. Even though has struggled in his first four starts of the season, the Braves’ offense can be avoided in all league formats.
Projected Lineup
| # | Player | Bats | wOBA vs. LHP | ISO vs. LHP | FD Position | FD Salary | DK Position | DK Salary |
| 1 | | LEFT | 0.284 | 0.059 | OF | $3,100 | OF | $2,900 |
| 2 | | RIGHT | 0.321 | 0.161 | 2B | $2,000 | 2B/SS | $2,100 |
| 3 | | LEFT | 0.305 | 0.087 | 1B | $2,700 | 1B | $3,200 |
| 4 | | RIGHT | 0.377 | 0.241 | 3B | $2,300 | 3B | $3,100 |
| 5 | | RIGHT | 0.326 | 0.088 | C | $2,300 | C | $2,200 |
| 6 | | RIGHT | 0.291 | 0.107 | OF | $2,000 | OF | $2,000 |
| 7 | | SWITCH | 0.237 | 0.046 | SS | $2,000 | SS | $2,200 |
| 8 | | RIGHT | 0.255 | 0.101 | OF | $2,100 | OF | $2,000 |
| 9 | | RIGHT | 0.074 | 0.000 | P | $5,900 | P | $6,000 |
| | Team Averages | — | 0.274 | 0.099 | — | $2,313 | — | $2,463 |
Elite Plays – NONE
Secondary Plays – NONE
Stackability – NONE
Jump to Page 1 2 3
