MLB Grind Down: Wednesday, July 5th

Jump to Page 1 2 3
The RotoGrinders MLB Grind Down will give you an in-depth analysis into the upcoming MLB schedule. This article will break down the numbers for every single game and give you analysis on which trends you can exploit. While matchups are a major factor in daily fantasy baseball, there are plenty of other factors to consider such as injuries, weather, and salaries.
The analysis should point you in the right direction, but it is still up to you to decipher the information and make your own selections. No sport has more variance than baseball. The best choice is not always the right choice but following the trends will win you money over time.
Note: As always, if you want to try a new DFS site, be sure to click through a RotoGrinders link and use our DraftKings promo code, FanDuel promo code, and FantasyDraft promo code to receive the best perks in the industry.
Stackability Rating System:
GREEN – A viable full stack in cash games and GPPs.
YELLOW – A viable mini-stack in cash games and full stack in GPPs.
ORANGE – A viable stack in large field GPPs.
RED – Not a recommended stack for cash games or GPPs.
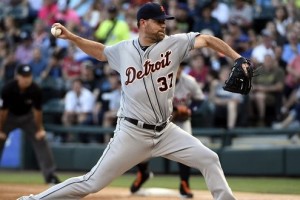
Toronto at NY Yankees – 1:05 PM ET
| Toronto | NY Yankees | ||||||||||||||
 | Marco Estrada |  | Michael Pineda | ||||||||||||
| RIGHT | RIGHT | ||||||||||||||
| Vegas Moneyline | Vegas Over/Under | ||||||||||||||
| NYY-180 | 9.0 | ||||||||||||||
| Stats | wOBA | xwOBA | HC% | BB% | K% | GB% | Stats | wOBA | xwOBA | HC% | BB% | K% | GB% | ||
|---|---|---|---|---|---|---|---|---|---|---|---|---|---|---|---|
| SP vs. Left (2016-17) | 0.283 | 0.277 | 27.9% | 8.3% | 24.3% | 35.3% | SP vs. Left (2016-17) | 0.330 | 0.304 | 34.1% | 8.0% | 27.5% | 46.9% | ||
| SP vs. Right (2016-17) | 0.319 | 0.323 | 33.7% | 9.2% | 23.1% | 31.0% | SP vs. Right (2016-17) | 0.323 | 0.298 | 30.3% | 5.0% | 24.8% | 48.6% | ||
Pitcher Grind Down
| Marco Estrada | |||||||||
 | FanDuel | DraftKings | FantasyDraft | ||||||
| Salary: | $7,700 | Salary: | $6,700 | Salary: | |||||
| Salary Rank: | 13 of 30 | Salary Rank: | 13 of 30 | Salary Rank: | of 30 | ||||
| Stats | Starts | SIERA | ERA | K% | BB% | GB% | HC% | SC% | |
|---|---|---|---|---|---|---|---|---|---|
| 2016 | 29 | 4.35 | 3.48 | 22.8% | 9.0% | 33.5% | 31.3% | 21.1% | |
| 2017 | 17 | 4.14 | 4.86 | 25.1% | 8.4% | 32.5% | 30.0% | 18.4% | |
Most three game slates are fun for DFS purposes, but have little appeal to the casual fan. The three early games on the schedule today should draw some interest for all fans. We start with an American League East battle between the Blue Jays and Yankees. Estrada has a decent track record against New York, but he comes into the game in awful form. In his last three starts alone, he has walked a combined 15 batters. When you walk that many hitters, it doesn’t really matter who you are facing, the free passes are going to come back and haunt you. The form is a big concern here, as is a matchup against the Yankees, who are ranked second in team wOBA against right-handed pitching.
Quick Breakdown:Bad form and a bad matchup makes Estrada an easy fade in all formats.
| Michael Pineda | |||||||||
 | FanDuel | DraftKings | FantasyDraft | ||||||
| Salary: | $8,700 | Salary: | $10,200 | Salary: | |||||
| Salary Rank: | 5 of 30 | Salary Rank: | 3 of 30 | Salary Rank: | of 30 | ||||
| Stats | Starts | SIERA | ERA | K% | BB% | GB% | HC% | SC% | |
|---|---|---|---|---|---|---|---|---|---|
| 2016 | 32 | 3.40 | 4.82 | 27.4% | 7.0% | 45.8% | 32.7% | 17.2% | |
| 2017 | 16 | 3.64 | 4.05 | 23.2% | 5.1% | 51.6% | 30.5% | 20.1% | |
Pineda may be the most frustrating pitcher in all of DFS. He has all of the tools needed to be an above-average pitcher, but he can never seem to string it all together. Whether it’s a bad pitch here or there or a break that doesn’t go his way, it always seems to be something. With that said, he has an above-average strikeout rate, an above-average ground ball rate, and he gets to face a right-handed heavy Blue Jays’ lineup. Pineda is a sizable favorite here and has held the current roster of the Blue Jays’ to a .307 wOBA in 155 plate appearances.
Quick Breakdown:Given the upside and lack of pitching options in the early slate, Pineda is viable in all formats.
Batter Grind Down
Toronto
This game features a fairly high over/under of 9.5 runs, but on paper, Michael Pineda isn’t a pitcher that we want to pick on. He owns a 23% strikeout rate and a 52% ground ball rate, which is a lethal combination for the opposing offense. Not only that, but Pineda has held both left and right-handed hitters under a .305 xwOBA in the last two seasons. I wouldn’t rule out a few of the Blue Jays’ hitters as tournament fliers, but I’m higher on Pineda than I am on Toronto’s offense.
Projected Lineup (Splits vs. RH Pitching)
| # | Player | Bats | wOBA | xwOBA | ISO | HC% | BB% | K% | GB% | FD Pos. | FD Sal. | DK Pos. | DK Sal. | FDRFT Pos. | FDRFT Sal. |
|---|---|---|---|---|---|---|---|---|---|---|---|---|---|---|---|
| 1 | Jose Bautista | RIGHT | 0.358 | 0.362 | 0.214 | 38.0% | 15.8% | 21.6% | 36.1% | OF | $3,800 | OF | $4,000 | N/A | N/A |
| 2 | Russell Martin | RIGHT | 0.331 | 0.327 | 0.167 | 30.4% | 12.8% | 25.9% | 49.0% | C | $2,400 | C | $2,800 | N/A | N/A |
| 3 | Justin Smoak | SWITCH | 0.348 | 0.370 | 0.244 | 40.4% | 11.3% | 29.7% | 30.2% | 1B | $3,400 | 1B | $4,800 | N/A | N/A |
| 4 | Kendrys Morales | SWITCH | 0.313 | 0.385 | 0.194 | 40.7% | 8.1% | 20.4% | 48.9% | 1B | $3,000 | 1B | $3,400 | N/A | N/A |
| 5 | Troy Tulowitzki | RIGHT | 0.322 | 0.344 | 0.184 | 33.3% | 7.4% | 17.2% | 41.3% | SS | $2,800 | SS | $3,300 | N/A | N/A |
| 6 | Steve Pearce | RIGHT | 0.340 | 0.342 | 0.160 | 30.9% | 8.7% | 17.8% | 45.9% | OF | $2,900 | OF | $3,400 | N/A | N/A |
| 7 | Miguel Montero | LEFT | 0.321 | 0.309 | 0.166 | 31.7% | 13.7% | 21.0% | 45.5% | C | $2,000 | C | $3,100 | N/A | N/A |
| 8 | Kevin Pillar | RIGHT | 0.283 | 0.294 | 0.111 | 26.7% | 5.1% | 15.7% | 47.4% | OF | $2,500 | OF | $3,100 | N/A | N/A |
| 9 | Ryan Goins | LEFT | 0.265 | 0.272 | 0.146 | 30.3% | 7.1% | 21.4% | 47.3% | 2B | $2,000 | 2B/SS | $2,400 | N/A | N/A |
Elite Plays – None
Secondary Plays – Jose Bautista, Josh Donaldson, Kendrys Morales
Stackability – ORANGE
NY Yankees
The Yankees may not be at full strength, but they are catching Marco Estrada at an opportune time. In his last three starts, Estrada has given up 15 walks and 11 earned runs. He has blowup potential when his command is off and we know the Yankees have plenty of firepower throughout their lineup. They are a patient offense at the plate and one of the best in baseball against right-handed pitching. A stack is certainly viable here and it’s worth noting that Gary Sanchez, Didi Gregorius, and Chase Headley all have at least two home runs against Estrada in the past.
Projected Lineup (Splits vs. RH Pitching)
| # | Player | Bats | wOBA | xwOBA | ISO | HC% | BB% | K% | GB% | FD Pos. | FD Sal. | DK Pos. | DK Sal. | FDRFT Pos. | FDRFT Sal. |
|---|---|---|---|---|---|---|---|---|---|---|---|---|---|---|---|
| 1 | Brett Gardner | LEFT | 0.347 | 0.327 | 0.153 | 30.9% | 12.1% | 17.1% | 47.3% | OF | $3,500 | OF | $4,100 | N/A | N/A |
| 2 | Aaron Judge | RIGHT | 0.420 | 0.414 | 0.323 | 49.2% | 13.5% | 32.6% | 37.6% | OF | $4,800 | OF | $5,500 | N/A | N/A |
| 3 | Gary Sanchez | RIGHT | 0.427 | 0.386 | 0.304 | 38.8% | 8.6% | 22.6% | 48.2% | C | $3,700 | C | $4,600 | N/A | N/A |
| 4 | Didi Gregorius | LEFT | 0.318 | 0.263 | 0.189 | 24.7% | 2.9% | 15.1% | 41.6% | SS | $3,200 | SS | $4,400 | N/A | N/A |
| 5 | Chase Headley | SWITCH | 0.328 | 0.325 | 0.149 | 31.3% | 12.1% | 25.0% | 44.1% | 3B | $2,900 | 3B | $3,700 | N/A | N/A |
| 6 | Jacoby Ellsbury | LEFT | 0.331 | 0.317 | 0.133 | 26.4% | 9.8% | 12.3% | 48.1% | OF | $3,300 | OF | $3,800 | N/A | N/A |
| 7 | 1.016 | 0.667 | 66.7% | 0.0% | 0.0% | 0.0% | P | $8,400 | P | $8,300 | P | $8,000 | |||
| 8 | Austin Romine | RIGHT | 0.268 | 0.290 | 0.086 | 22.1% | 4.8% | 21.2% | 42.8% | C | $2,200 | C | $2,900 | N/A | N/A |
| 9 | Tyler Wade | LEFT | 0.318 | 0.368 | 0.111 | 40.0% | 18.2% | 36.4% | 20.0% | OF | $2,300 | SS | $2,400 | N/A | N/A |
Elite Plays – Brett Gardner, Aaron Judge, Gary Sanchez, Didi Gregorius
Secondary Plays – Jacoby Ellsbury, Chase Headley, Tyler Wade
Stackability – YELLOW / GREEN
Tampa Bay at Chicago Cubs – 2:20 PM ET
| Tampa Bay | Chicago Cubs | ||||||||||||||
 | Blake Snell |  | John Lackey | ||||||||||||
| LEFT | RIGHT | ||||||||||||||
| Vegas Moneyline | Vegas Over/Under | ||||||||||||||
| CHC-155 | 9.5 | ||||||||||||||
| Stats | wOBA | xwOBA | HC% | BB% | K% | GB% | Stats | wOBA | xwOBA | HC% | BB% | K% | GB% | ||
|---|---|---|---|---|---|---|---|---|---|---|---|---|---|---|---|
| SP vs. Left (2016-17) | 0.291 | 0.292 | 31.5% | 12.4% | 27.3% | 54.9% | SP vs. Left (2016-17) | 0.329 | 0.350 | 35.0% | 9.4% | 19.4% | 45.5% | ||
| SP vs. Right (2016-17) | 0.342 | 0.332 | 33.2% | 13.4% | 21.3% | 34.2% | SP vs. Right (2016-17) | 0.288 | 0.308 | 35.6% | 5.4% | 25.5% | 38.7% | ||
Pitcher Grind Down
| Blake Snell | |||||||||
 | FanDuel | DraftKings | FantasyDraft | ||||||
| Salary: | $6,600 | Salary: | $6,200 | Salary: | |||||
| Salary Rank: | 24 of 30 | Salary Rank: | 16 of 30 | Salary Rank: | of 30 | ||||
| Stats | Starts | SIERA | ERA | K% | BB% | GB% | HC% | SC% | |
|---|---|---|---|---|---|---|---|---|---|
| 2016 | 19 | 4.53 | 3.54 | 24.4% | 12.7% | 36.5% | 31.4% | 22.2% | |
| 2017 | 9 | 5.54 | 5.36 | 18.8% | 14.1% | 40.6% | 35.7% | 17.5% | |
Snell was sent down to the minors to work on his command and potentially some mechanical issues. After being called back up, the reports were nothing but positive. He then came out and walked five batters in his first start back. The issue with Snell is always his command. He walks too many batters and doesn’t have a high ground ball rate, so he doesn’t induce many double play balls. His matchup against the Cubs is far from ideal, as Chicago is ranked third in team wOBA against left-handed pitching.
Quick Breakdown:Until we see these “improvements” from Snell, I will be avoiding him in all formats.
| John Lackey | |||||||||
 | FanDuel | DraftKings | FantasyDraft | ||||||
| Salary: | $8,300 | Salary: | $5,600 | Salary: | |||||
| Salary Rank: | 10 of 30 | Salary Rank: | 20 of 30 | Salary Rank: | of 30 | ||||
| Stats | Starts | SIERA | ERA | K% | BB% | GB% | HC% | SC% | |
|---|---|---|---|---|---|---|---|---|---|
| 2016 | 29 | 3.83 | 3.35 | 24.1% | 7.1% | 41.0% | 34.4% | 16.2% | |
| 2017 | 16 | 4.42 | 5.24 | 20.5% | 7.4% | 43.0% | 37.1% | 15.0% | |
Lackey’s fountain of youth seems to be drying up. After a career high strikeout rate in 2016, he has taken a step back this year. He currently owns a 4.42 SIERA (5.24 ERA) with an average strikeout rate and a high hard contact rate. There are plenty of red flags if you are looking to fade Lackey in this slate. However, it’s rare that we see a pitcher that is favored and that has good strikeout potential listed at a bargain price of $5,600 on DraftKings. The Rays may have a potent offense, but they also have the second highest strikeout rate against right-handed pitching.
Quick Breakdown:Lackey is viable as an SP2 on DraftKings. The risk is there, but so is the reward in a matchup against the strikeout-prone Rays.
Batter Grind Down
Tampa Bay
Even though I will have some shares of John Lackey today, that doesn’t mean that I will be fading the Rays completely. A hedge stack is a decent strategy, as we have seen Lackey get shelled on a number of occasions. In terms of splits, John Lackey has allowed a .350 xwOBA and a 35% hard contact rate to left-handed hitters in the last two seasons. Mallex Smith, Corey Dickerson, and Logan Morrison are all viable one-off targets and I actually don’t mind the mini three-man stack.
Projected Lineup (Splits vs. RH Pitching)
| # | Player | Bats | wOBA | xwOBA | ISO | HC% | BB% | K% | GB% | FD Pos. | FD Sal. | DK Pos. | DK Sal. | FDRFT Pos. | FDRFT Sal. |
|---|---|---|---|---|---|---|---|---|---|---|---|---|---|---|---|
| 1 | Mallex Smith | LEFT | 0.347 | 0.266 | 0.128 | 21.4% | 10.8% | 19.3% | 57.1% | OF | $2,600 | OF | $3,200 | N/A | N/A |
| 2 | Corey Dickerson | LEFT | 0.355 | 0.323 | 0.262 | 33.0% | 6.5% | 21.6% | 35.0% | OF | $3,800 | OF | $3,900 | N/A | N/A |
| 3 | Evan Longoria | RIGHT | 0.353 | 0.349 | 0.234 | 35.6% | 5.9% | 19.3% | 36.3% | 3B | $3,100 | 3B | $3,600 | N/A | N/A |
| 4 | Logan Morrison | LEFT | 0.351 | 0.377 | 0.256 | 40.9% | 11.3% | 21.9% | 38.8% | 1B | $3,800 | 1B | $4,700 | N/A | N/A |
| 5 | Steve Souza | RIGHT | 0.350 | 0.334 | 0.217 | 33.5% | 9.9% | 31.0% | 40.5% | OF | $3,400 | OF | $4,200 | N/A | N/A |
| 6 | Tim Beckham | RIGHT | 0.321 | 0.304 | 0.189 | 44.6% | 5.0% | 31.4% | 44.0% | SS | $3,100 | SS | $3,100 | N/A | N/A |
| 7 | Wilson Ramos | RIGHT | 0.346 | 0.345 | 0.168 | 36.1% | 6.3% | 16.4% | 54.1% | C | $2,600 | C | $3,400 | N/A | N/A |
| 8 | Adeiny Hechavarria | RIGHT | 0.261 | 0.303 | 0.069 | 29.9% | 4.8% | 12.3% | 47.8% | SS | $2,000 | SS | $2,500 | N/A | N/A |
| 9 | Blake Snell | LEFT | 0.277 | 0.296 | 0.000 | 0.0% | 40.0% | 20.0% | 100.0% | P | $6,600 | P | $6,200 | N/A | N/A |
Elite Plays – Mallex Smith
Secondary Plays – Corey Dickerson, Evan Longoria, Logan Morrison
Stackability – YELLOW
Chicago Cubs
The Cubs are one of the best offenses in baseball against left-handed pitching. They are potentially licking their chops heading into tomorrow’s matchup against Blake Snell, who has one of the highest walk rates of any starting pitcher. In terms of splits, Snell is significantly worse against right-handed hitters, allowing a .332 xwOBA and a 33% hard contact in the last two seasons. All of the righties (and Anthony Rizzo) are viable targets.
Projected Lineup (Splits vs. LH Pitching)
| # | Player | Bats | wOBA | xwOBA | ISO | HC% | BB% | K% | GB% | FD Pos. | FD Sal. | DK Pos. | DK Sal. | FDRFT Pos. | FDRFT Sal. |
|---|---|---|---|---|---|---|---|---|---|---|---|---|---|---|---|
| 1 | Willson Contreras | RIGHT | 0.358 | 0.336 | 0.199 | 30.8% | 8.0% | 18.5% | 57.4% | C | $3,300 | C | $3,600 | N/A | N/A |
| 2 | Kris Bryant | RIGHT | 0.438 | 0.440 | 0.324 | 39.2% | 17.8% | 18.9% | 32.5% | 3B | $3,800 | 3B | $3,900 | N/A | N/A |
| 3 | Anthony Rizzo | LEFT | 0.381 | 0.358 | 0.247 | 27.2% | 10.0% | 11.6% | 44.3% | 1B | $4,200 | 1B | $4,700 | N/A | N/A |
| 4 | Ben Zobrist | SWITCH | 0.342 | 0.314 | 0.162 | 31.8% | 12.0% | 18.4% | 54.0% | OF | $2,700 | 2B/OF | $3,500 | N/A | N/A |
| 5 | Ian Happ | SWITCH | 0.375 | 0.267 | 0.270 | 20.0% | 5.0% | 32.5% | 29.2% | OF | $3,500 | 2B/OF | $3,900 | N/A | N/A |
| 6 | Albert Almora | RIGHT | 0.396 | 0.342 | 0.237 | 28.4% | 11.4% | 11.4% | 47.5% | OF | $2,100 | OF | $2,600 | N/A | N/A |
| 7 | Javier Baez | RIGHT | 0.350 | 0.317 | 0.200 | 32.2% | 7.8% | 21.5% | 43.9% | 2B | $2,600 | 2B/SS | $3,200 | N/A | N/A |
| 8 | Addison Russell | RIGHT | 0.338 | 0.334 | 0.213 | 29.2% | 12.6% | 22.9% | 39.2% | SS | $2,800 | SS | $3,000 | N/A | N/A |
| 9 | John Lackey | RIGHT | 0.070 | 0.163 | 0.000 | 25.0% | 0.0% | 38.5% | 40.0% | P | $8,300 | P | $5,600 | N/A | N/A |
Elite Plays – Kris Bryant, Willson Contreras
Secondary Plays – Anthony Rizzo, Ian Happ, Willson Contreras
Stackability –
Chicago White Sox at Oakland – 3:35 PM ET
| Chicago White Sox | Oakland | ||||||||||||||
 | Mike Pelfrey |  | Sonny Gray | ||||||||||||
| RIGHT | RIGHT | ||||||||||||||
| Vegas Moneyline | Vegas Over/Under | ||||||||||||||
| OAK-180 | 9.0 | ||||||||||||||
| Stats | wOBA | xwOBA | HC% | BB% | K% | GB% | Stats | wOBA | xwOBA | HC% | BB% | K% | GB% | ||
|---|---|---|---|---|---|---|---|---|---|---|---|---|---|---|---|
| SP vs. Left (2016-17) | 0.374 | 0.391 | 35.7% | 10.1% | 12.9% | 42.8% | SP vs. Left (2016-17) | 0.311 | 0.316 | 28.2% | 7.2% | 19.7% | 53.9% | ||
| SP vs. Right (2016-17) | 0.332 | 0.325 | 24.8% | 7.6% | 11.7% | 59.0% | SP vs. Right (2016-17) | 0.347 | 0.328 | 36.8% | 8.6% | 20.1% | 55.3% | ||
Pitcher Grind Down
| Mike Pelfrey | |||||||||
 | FanDuel | DraftKings | FantasyDraft | ||||||
| Salary: | $6,000 | Salary: | $5,200 | Salary: | |||||
| Salary Rank: | 29 of 30 | Salary Rank: | 24 of 30 | Salary Rank: | of 30 | ||||
| Stats | Starts | SIERA | ERA | K% | BB% | GB% | HC% | SC% | |
|---|---|---|---|---|---|---|---|---|---|
| 2016 | 22 | 5.25 | 5.07 | 10.4% | 8.5% | 52.2% | 31.2% | 20.1% | |
| 2017 | 13 | 5.35 | 4.13 | 14.5% | 9.9% | 48.6% | 27.8% | 24.9% | |
Pelfrey is never in play when it comes to DFS. The debate surrounding him is whether or not he is a viable option to stack against. Some argue that his ground ball rate, hard contact rate, and ability to pitch out of jams makes him a bad pitcher to stack against. Others argue that he’s a gas can that has some serious regression coming. I see both sides of the argument and certainly like to target hitters against Pelfrey, but more often than not, I end up picking my spots instead of completely stacking against him.
Quick Breakdown:Pelfrey is an easy fade in all formats.
| Sonny Gray | |||||||||
 | FanDuel | DraftKings | FantasyDraft | ||||||
| Salary: | $8,600 | Salary: | $9,000 | Salary: | |||||
| Salary Rank: | 7 of 30 | Salary Rank: | 6 of 30 | Salary Rank: | of 30 | ||||
| Stats | Starts | SIERA | ERA | K% | BB% | GB% | HC% | SC% | |
|---|---|---|---|---|---|---|---|---|---|
| 2016 | 22 | 4.32 | 5.69 | 18.2% | 8.1% | 53.9% | 33.6% | 16.1% | |
| 2017 | 12 | 3.78 | 4.09 | 22.9% | 7.6% | 55.9% | 30.6% | 16.3% | |
Gray is my favorite pitcher in the early slate. He is pitching in the best ballpark, he has the best matchup, and he’s arguably in the best form. In 12 starts this season, he has a 3.78 SIERA with a strikeout rate of 23% and a ground ball rate of 56%. If you’ve ever read the Grind Down, then you know how I feel about pitchers with elite ground ball rates and an above-average strikeout rate. Meanwhile, the White Sox are ranked 27th in team wOBA and 20th in strikeout rate against right-handed pitching.
Quick Breakdown:Gray has shown more upside this season. He’s an elite play in all formats.
Batter Grind Down
Chicago White Sox
The White Sox are always on my radar when facing a left-handed pitcher and rarely on my radar when facing a right-handed pitcher. Sonny Gray has been in solid form this season and the White Sox have to face him on the road in the pitcher-friendly Oakland Alameda Coliseum. Gray does have reverse splits (.328 xwOBA and a 37% hard contact rate to righties), but Jose Abreu and Avisail Garcia are ground ball hitters that fare much better against fly ball pitchers.
Projected Lineup (Splits vs. RH Pitching)
| # | Player | Bats | wOBA | xwOBA | ISO | HC% | BB% | K% | GB% | FD Pos. | FD Sal. | DK Pos. | DK Sal. | FDRFT Pos. | FDRFT Sal. |
|---|---|---|---|---|---|---|---|---|---|---|---|---|---|---|---|
| 1 | Adam Engel | RIGHT | 0.309 | 0.276 | 0.158 | 42.9% | 2.4% | 28.6% | 48.0% | OF | $2,700 | OF | $3,400 | N/A | N/A |
| 2 | Melky Cabrera | SWITCH | 0.326 | 0.325 | 0.132 | 28.7% | 7.6% | 10.1% | 47.0% | OF | $3,400 | OF | $3,900 | N/A | N/A |
| 3 | Jose Abreu | RIGHT | 0.341 | 0.346 | 0.173 | 33.9% | 5.9% | 17.3% | 46.1% | 1B | $3,600 | 1B | $4,100 | N/A | N/A |
| 4 | Avisail Garcia | RIGHT | 0.321 | 0.328 | 0.161 | 32.4% | 5.9% | 24.0% | 53.2% | OF | $2,800 | OF | $2,700 | N/A | N/A |
| 5 | Todd Frazier | RIGHT | 0.322 | 0.324 | 0.224 | 31.1% | 10.6% | 22.8% | 39.1% | 3B | $3,500 | 3B | $4,200 | N/A | N/A |
| 6 | Matt Davidson | RIGHT | 0.322 | 0.294 | 0.284 | 47.5% | 3.7% | 46.6% | 33.8% | 3B | $2,500 | 1B/3B | $3,200 | N/A | N/A |
| 7 | Tim Anderson | RIGHT | 0.282 | 0.268 | 0.143 | 30.0% | 3.3% | 27.2% | 51.5% | SS | $2,500 | SS | $3,000 | N/A | N/A |
| 8 | Omar Narvaez | LEFT | 0.271 | 0.294 | 0.027 | 13.6% | 10.1% | 12.0% | 43.5% | C | $2,300 | C | $2,000 | N/A | N/A |
| 9 | Yolmer Sanchez | SWITCH | 0.308 | 0.286 | 0.144 | 24.2% | 5.8% | 22.5% | 41.5% | 2B | $2,700 | 2B | $3,100 | N/A | N/A |
Elite Plays – None
Secondary Plays – None
Stackability – RED
Oakland
The A’s are basically the perfect team to stack against a pitcher like Mike Pelfrey. In order to succeed, Pelfrey needs to induce a lot of ground balls and soft contact. In case you didn’t know, the A’s have the highest fly-ball rate of any team in baseball against right-handed pitching (43%). When you get the ball in the air against Pelfrey, good things tend to happen. The A’s are a tremendous stack option in the early slate and their ownership shouldn’t be out of control.
Projected Lineup (Splits vs. RH Pitching)
| # | Player | Bats | wOBA | xwOBA | ISO | HC% | BB% | K% | GB% | FD Pos. | FD Sal. | DK Pos. | DK Sal. | FDRFT Pos. | FDRFT Sal. |
|---|---|---|---|---|---|---|---|---|---|---|---|---|---|---|---|
| 1 | Matt Joyce | LEFT | 0.353 | 0.366 | 0.217 | 36.2% | 17.6% | 22.4% | 38.7% | OF | $2,700 | OF | $3,000 | N/A | N/A |
| 2 | Franklin Barreto | RIGHT | 0.250 | 0.277 | 0.136 | 46.2% | 8.3% | 37.5% | 38.5% | SS | $2,800 | SS | $4,200 | N/A | N/A |
| 3 | Jed Lowrie | SWITCH | 0.324 | 0.331 | 0.137 | 33.0% | 8.9% | 16.6% | 34.8% | 2B | $2,500 | 2B | $3,600 | N/A | N/A |
| 4 | Khris Davis | RIGHT | 0.356 | 0.368 | 0.286 | 40.4% | 7.6% | 29.4% | 42.3% | OF | $4,000 | OF | $4,600 | N/A | N/A |
| 5 | Yonder Alonso | LEFT | 0.333 | 0.361 | 0.162 | 34.3% | 10.4% | 17.2% | 38.4% | 1B | $3,100 | 1B | $3,900 | N/A | N/A |
| 6 | Ryon Healy | RIGHT | 0.337 | 0.333 | 0.215 | 34.7% | 4.2% | 25.6% | 41.0% | 3B | $3,300 | 1B/3B | $3,700 | N/A | N/A |
| 7 | Josh Phegley | RIGHT | 0.268 | 0.294 | 0.130 | 30.0% | 5.1% | 16.1% | 37.8% | C | $2,100 | C | $2,200 | N/A | N/A |
| 8 | Jaycob Brugman | LEFT | 0.279 | 0.262 | 0.048 | 20.0% | 11.3% | 25.4% | 48.9% | OF | $2,300 | OF | $3,500 | N/A | N/A |
| 9 | Rajai Davis | RIGHT | 0.290 | 0.267 | 0.129 | 25.6% | 6.3% | 20.1% | 47.0% | OF | $2,500 | OF | $3,500 | N/A | N/A |
Elite Plays – Jed Lowrie, Khris Davis, Yonder Alonso
Secondary Plays – Matt Joyce, Franklin Barreto, Ryon Healy
Stackability – YELLOW / GREEN
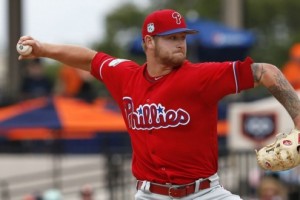
Pittsburgh at Philadelphia – 7:05 PM ET
| Pittsburgh | Philadelphia | ||||||||||||||
 | Gerrit Cole |  | Ben Lively | ||||||||||||
| RIGHT | RIGHT | ||||||||||||||
| Vegas Moneyline | Vegas Over/Under | ||||||||||||||
| PIT-140 | 9.0 | ||||||||||||||
| Stats | wOBA | xwOBA | HC% | BB% | K% | GB% | Stats | wOBA | xwOBA | HC% | BB% | K% | GB% | ||
|---|---|---|---|---|---|---|---|---|---|---|---|---|---|---|---|
| SP vs. Left (2016-17) | 0.373 | 0.340 | 39.0% | 6.0% | 21.6% | 40.1% | SP vs. Left (2016-17) | 0.354 | 0.365 | 32.8% | 10.1% | 6.3% | 46.8% | ||
| SP vs. Right (2016-17) | 0.286 | 0.304 | 25.3% | 7.2% | 17.9% | 51.3% | SP vs. Right (2016-17) | 0.331 | 0.288 | 32.4% | 4.8% | 9.6% | 34.3% | ||
Pitcher Grind Down
| Gerrit Cole | |||||||||
 | FanDuel | DraftKings | FantasyDraft | ||||||
| Salary: | $8,600 | Salary: | $8,700 | Salary: | $16,800 | ||||
| Salary Rank: | 7 of 30 | Salary Rank: | 7 of 30 | Salary Rank: | 5 of 30 | ||||
| Stats | Starts | SIERA | ERA | K% | BB% | GB% | HC% | SC% | |
|---|---|---|---|---|---|---|---|---|---|
| 2016 | 21 | 4.24 | 3.88 | 19.4% | 7.1% | 45.6% | 30.1% | 21.3% | |
| 2017 | 17 | 4.22 | 4.51 | 20.0% | 6.1% | 46.4% | 33.8% | 22.4% | |
Cole is a pitcher that has more talent than his statistics show, but eventually we have to trust the numbers. He has an average strikeout rate, a SIERA above 4.00, and he continues to struggle against left-handed hitters. It seems like the DFS community wants him to be great, but that just hasn’t been the case. I have a hard time paying a premium for pitchers with mediocre numbers and I’m more than willing to fade Cole if he’s going to be popular tonight. The matchup against the Phillies looks good on paper, but he has to face them in the hitter-friendly Citizens Bank Park.
Quick Breakdown: Cole is a calculated fade for me in this slate. I will be taking my shots elsewhere.
| Ben Lively | |||||||||
 | FanDuel | DraftKings | FantasyDraft | ||||||
| Salary: | $6,700 | Salary: | $5,300 | Salary: | $10,400 | ||||
| Salary Rank: | 22 of 30 | Salary Rank: | 23 of 30 | Salary Rank: | 18 of 30 | ||||
| Stats | Starts | SIERA | ERA | K% | BB% | GB% | HC% | SC% | |
|---|---|---|---|---|---|---|---|---|---|
| 2017 | 6 | 6.13 | 3.72 | 8.0% | 7.4% | 40.2% | 32.6% | 20.7% | |
Lively has a strikeout rate of 8% in his first six major league starts. I could end the analysis there, but I’ll continue. To make matters worse, Lively’s SIERA is a full two and a half runs higher than his ERA, which suggests some serious regression moving forward. He is an easy fade tonight against the Pirates, who have one of the lowest strikeout rates of any offense against right-handed pitching.
Quick Breakdown: Avoid Lively in all formats.
Batter Grind Down
Pittsburgh
The Pirates see a favorable ballpark shift playing in Philadelphia and they draw an exploitable matchup against rookie Ben Lively. The sample size is small (six starts), but Lively has allowed a .365 xwOBA to left-handed hitters. He also has a strikeout rate of 8% and some serious regression coming his way. The Pirates are a sneaky offense to target in tournaments. While I probably won’t be stacking them as a whole, you can use a few different batters as one-off targets and potentially even as mini-stacks.
Projected Lineup (Splits vs. RH Pitching)
| # | Player | Bats | wOBA | xwOBA | ISO | HC% | BB% | K% | GB% | FD Pos. | FD Sal. | DK Pos. | DK Sal. | FDRFT Pos. | FDRFT Sal. |
|---|---|---|---|---|---|---|---|---|---|---|---|---|---|---|---|
| 1 | Adam Frazier | LEFT | 0.324 | 0.331 | 0.126 | 31.5% | 8.9% | 14.3% | 45.7% | OF | $2,900 | OF | $3,800 | IF/OF | $7,600 |
| 2 | Josh Harrison | RIGHT | 0.311 | 0.292 | 0.110 | 28.2% | 4.4% | 15.0% | 42.6% | 2B | $2,900 | 2B/3B | $3,700 | 2B | $7,200 |
| 3 | Andrew McCutchen | RIGHT | 0.333 | 0.342 | 0.170 | 34.9% | 9.9% | 20.5% | 37.1% | OF | $3,700 | OF | $4,500 | RF | $8,700 |
| 4 | Josh Bell | SWITCH | 0.342 | 0.353 | 0.197 | 33.2% | 12.4% | 17.1% | 51.2% | 1B | $2,800 | 1B | $3,700 | IF/OF | $7,200 |
| 5 | David Freese | RIGHT | 0.316 | 0.323 | 0.127 | 31.4% | 9.3% | 26.1% | 58.6% | 3B | $2,600 | 3B | $3,000 | 3B | $6,000 |
| 6 | Gregory Polanco | LEFT | 0.325 | 0.337 | 0.190 | 32.9% | 8.9% | 16.6% | 39.6% | OF | $2,900 | OF | $3,600 | RF | $7,200 |
| 7 | Francisco Cervelli | RIGHT | 0.312 | 0.325 | 0.091 | 28.4% | 13.2% | 18.8% | 52.4% | C | $2,600 | C | $2,900 | C | $5,700 |
| 8 | Jordy Mercer | RIGHT | 0.308 | 0.297 | 0.119 | 25.7% | 8.4% | 14.7% | 49.1% | SS | $2,500 | SS | $3,600 | SS | $7,200 |
| 9 | Gerrit Cole | RIGHT | 0.143 | 0.142 | 0.000 | 5.6% | 1.6% | 39.3% | 77.8% | P | $8,600 | P | $8,700 | P | $16,800 |
Elite Plays – None
Secondary Plays – Adam Frazier, Andrew McCutchen, Josh Bell, Gregory Polanco
Stackability – YELLOW
Philadelphia
This is a situation where I will probably be avoiding both the pitcher (Gerrit Cole) and the offense facing him (Phillies). I don’t love Cole’s price or the ballpark and at the same time, I have little to no confidence in the Phillies’ offense. On the season, they are ranked 29th in team wOBA against right-handed pitching. I will note that Cole is considerably worse against left-handed hitters, allowing a .340 xwOBA and a 39% hard contact over the course of the last two seasons.
Projected Lineup (Splits vs. RH Pitching)
| # | Player | Bats | wOBA | xwOBA | ISO | HC% | BB% | K% | GB% | FD Pos. | FD Sal. | DK Pos. | DK Sal. | FDRFT Pos. | FDRFT Sal. |
|---|---|---|---|---|---|---|---|---|---|---|---|---|---|---|---|
| 1 | Odubel Herrera | LEFT | 0.331 | 0.307 | 0.151 | 29.6% | 8.2% | 21.1% | 43.1% | OF | $2,400 | OF | $2,500 | IF/OF | $4,800 |
| 2 | Freddy Galvis | SWITCH | 0.301 | 0.276 | 0.170 | 28.4% | 5.7% | 21.0% | 40.2% | SS | $2,600 | SS | $3,400 | SS | $6,800 |
| 3 | Aaron Altherr | RIGHT | 0.314 | 0.297 | 0.149 | 33.8% | 8.9% | 31.0% | 45.5% | OF | $3,200 | OF | $4,100 | LF | $8,000 |
| 4 | Tommy Joseph | RIGHT | 0.324 | 0.325 | 0.209 | 38.6% | 5.5% | 22.9% | 42.3% | 1B | $3,200 | 1B | $4,000 | 1B | $7,800 |
| 5 | Maikel Franco | RIGHT | 0.285 | 0.315 | 0.142 | 28.2% | 6.6% | 16.2% | 46.4% | 3B | $3,100 | 3B | $3,300 | 3B | $6,600 |
| 6 | Nick Williams | LEFT | 0.396 | 0.380 | 0.000 | 60.0% | 12.5% | 12.5% | 40.0% | OF | $2,400 | OF | $3,100 | LF | $6,000 |
| 7 | Ty Kelly | SWITCH | 0.277 | 0.286 | 0.153 | 28.8% | 9.6% | 19.3% | 41.4% | 2B | $2,200 | 3B/OF | $2,300 | IF/OF | $4,500 |
| 8 | Cameron Rupp | RIGHT | 0.282 | 0.301 | 0.154 | 31.7% | 6.2% | 29.6% | 48.1% | C | $2,100 | C | $2,500 | C | $4,800 |
| 9 | Ben Lively | RIGHT | 0.146 | 0.162 | 0.000 | 0.0% | 0.0% | 66.7% | 50.0% | P | $6,700 | P | $5,300 | P | $10,400 |
Elite Plays – None
Secondary Plays – Odubel Herrera, Freddy Galvis, Nick Williams
Stackability – ORANGE
NY Mets at Washington – 7:05 PM ET
| NY Mets | Washington | ||||||||||||||
 | Jacob deGrom |  | Tanner Roark | ||||||||||||
| RIGHT | RIGHT | ||||||||||||||
| Vegas Moneyline | Vegas Over/Under | ||||||||||||||
| WAS-100 | 8.5 | ||||||||||||||
| Stats | wOBA | xwOBA | HC% | BB% | K% | GB% | Stats | wOBA | xwOBA | HC% | BB% | K% | GB% | ||
|---|---|---|---|---|---|---|---|---|---|---|---|---|---|---|---|
| SP vs. Left (2016-17) | 0.286 | 0.306 | 32.2% | 7.8% | 23.5% | 43.9% | SP vs. Left (2016-17) | 0.312 | 0.332 | 30.6% | 10.4% | 17.9% | 40.6% | ||
| SP vs. Right (2016-17) | 0.302 | 0.295 | 33.7% | 6.6% | 28.3% | 47.7% | SP vs. Right (2016-17) | 0.285 | 0.301 | 22.0% | 6.8% | 21.2% | 54.6% | ||
Pitcher Grind Down
| Jacob deGrom | |||||||||
 | FanDuel | DraftKings | FantasyDraft | ||||||
| Salary: | $10,900 | Salary: | $12,300 | Salary: | $24,000 | ||||
| Salary Rank: | 1 of 30 | Salary Rank: | 1 of 30 | Salary Rank: | 1 of 30 | ||||
| Stats | Starts | SIERA | ERA | K% | BB% | GB% | HC% | SC% | |
|---|---|---|---|---|---|---|---|---|---|
| 2016 | 24 | 3.66 | 3.04 | 23.7% | 6.0% | 45.6% | 31.3% | 19.0% | |
| 2017 | 16 | 3.59 | 3.55 | 29.0% | 8.8% | 46.0% | 35.6% | 21.4% | |
DeGrom continues to pitch well this season. In 16 starts, he has a 3.59 SIERA with a strikeout rate of 29%. His velocity is up from a year ago and his swinging strike rate of 14.2% (career high) suggests that he can sustain this high of a k-rate moving forward. The issue tonight is obviously his matchup against the Nationals, who are a top three offense against right-handed pitching this season. While he doesn’t standout as a great cash game option, I will gladly target him in tournaments in a slate where he is going to be under-owned. He has as much upside as any pitcher in the slate and he has pitched well against the Nationals in his career – the current roster has a .279 wOBA against him in 120 plate appearances.
Quick Breakdown: DeGrom is an elite tournament play, but he is a bit overpriced for cash games.
| Tanner Roark | |||||||||
 | FanDuel | DraftKings | FantasyDraft | ||||||
| Salary: | $7,600 | Salary: | $6,600 | Salary: | $13,200 | ||||
| Salary Rank: | 14 of 30 | Salary Rank: | 14 of 30 | Salary Rank: | 11 of 30 | ||||
| Stats | Starts | SIERA | ERA | K% | BB% | GB% | HC% | SC% | |
|---|---|---|---|---|---|---|---|---|---|
| 2016 | 33 | 4.32 | 2.83 | 20.1% | 8.5% | 48.7% | 24.3% | 23.1% | |
| 2017 | 17 | 4.68 | 5.27 | 18.5% | 8.6% | 46.3% | 29.7% | 14.9% | |
Roark is not a pitcher that I use often in DFS. He basically needs a near-perfect matchup for me to consider him and he doesn’t have that going for him tonight against the Mets. On the season, New York is ranked ninth in team wOBA and fourth in strikeout rate against right-handed pitching. Not only is this an offense that hit righties well, but their lineup is full of left-handed hitters, which doesn’t bode well for Roark’s splits.
Quick Breakdown: There are better options in both cash games and tournaments.
Batter Grind Down
NY Mets
The Mets are the preferred offense to target in this game, even though has it as a pick ‘em. Over the last two seasons, Tanner Roark has allowed a .332 xwOBA and a 10% walk rate to left-handed hitters, which brings Curtis Granderson, Asdrubal Cabrera, Jay Bruce, and Lucas Duda into play. While I like the Mets’ offense a bit here, there are more attractive matchups in this slate. Rather than using New York as a stack, I’d rather sprinkle in their hitters as one-offs throughout my tournament lineups.
Projected Lineup (Splits vs. RH Pitching)
| # | Player | Bats | wOBA | xwOBA | ISO | HC% | BB% | K% | GB% | FD Pos. | FD Sal. | DK Pos. | DK Sal. | FDRFT Pos. | FDRFT Sal. |
|---|---|---|---|---|---|---|---|---|---|---|---|---|---|---|---|
| 1 | Curtis Granderson | LEFT | 0.346 | 0.341 | 0.239 | 36.1% | 13.3% | 19.9% | 33.5% | OF | $3,600 | OF | $4,600 | CF | $9,000 |
| 2 | Asdrubal Cabrera | SWITCH | 0.342 | 0.330 | 0.203 | 35.4% | 7.6% | 17.3% | 38.7% | 2B | $3,200 | SS | $3,500 | SS | $6,800 |
| 3 | Yoenis Cespedes | RIGHT | 0.354 | 0.353 | 0.235 | 38.6% | 7.6% | 19.6% | 35.8% | OF | $3,300 | OF | $3,900 | LF | $7,800 |
| 4 | Jay Bruce | LEFT | 0.373 | 0.366 | 0.292 | 41.7% | 9.4% | 21.0% | 35.8% | OF | $3,500 | OF | $4,100 | RF | $8,100 |
| 5 | Lucas Duda | LEFT | 0.369 | 0.390 | 0.259 | 41.4% | 12.4% | 21.9% | 31.0% | 1B | $3,300 | 1B | $4,200 | 1B | $8,100 |
| 6 | T.J. Rivera | RIGHT | 0.366 | 0.304 | 0.174 | 29.0% | 3.5% | 10.4% | 38.1% | 3B | $2,500 | 1B/3B | $3,500 | 3B | $6,900 |
| 7 | Jose Reyes | SWITCH | 0.274 | 0.269 | 0.129 | 26.1% | 7.7% | 16.1% | 37.4% | SS | $2,400 | 3B/SS | $3,200 | SS | $6,300 |
| 8 | Travis d’Arnaud | RIGHT | 0.281 | 0.297 | 0.131 | 33.0% | 5.9% | 16.7% | 47.3% | C | $2,700 | C | $3,500 | C | $6,900 |
| 9 | Jacob deGrom | RIGHT | 0.265 | 0.247 | 0.079 | 27.8% | 5.5% | 20.5% | 55.3% | P | $10,900 | P | $12,300 | P | $24,000 |
Elite Plays – None
Secondary Plays – Curtis Granderson, Asdrubal Cabrera, Jay Bruce, Lucas Duda
Stackability – YELLOW
Washington
For me, it doesn’t matter how good an offense is or what ballpark they play in. When a team faces an elite pitcher, I don’t see the need in targeting any of their hitters. There are 12 games on the schedule tonight and much better matchups than the one against Jacob deGrom, who has held both left and right-handed hitters under a .310 xwOBA. Bryce Harper has good BvP numbers against deGrom in the past, but I’d rather take an underweight stance on him compared to the field.
Projected Lineup (Splits vs. RH Pitching)
| # | Player | Bats | wOBA | xwOBA | ISO | HC% | BB% | K% | GB% | FD Pos. | FD Sal. | DK Pos. | DK Sal. | FDRFT Pos. | FDRFT Sal. |
|---|---|---|---|---|---|---|---|---|---|---|---|---|---|---|---|
| 1 | Michael Taylor | RIGHT | 0.303 | 0.280 | 0.188 | 33.2% | 5.5% | 31.9% | 41.0% | OF | $2,900 | OF | $4,300 | CF | $8,400 |
| 2 | Ryan Raburn | RIGHT | 0.292 | 0.277 | 0.156 | 39.5% | 7.2% | 36.6% | 45.3% | OF | $2,100 | OF | $3,000 | LF | $6,000 |
| 3 | Bryce Harper | LEFT | 0.380 | 0.397 | 0.232 | 34.4% | 18.5% | 15.8% | 39.7% | OF | $4,000 | OF | $5,300 | RF | $10,400 |
| 4 | Ryan Zimmerman | RIGHT | 0.326 | 0.337 | 0.188 | 36.3% | 5.6% | 22.7% | 45.6% | 1B | $3,100 | 1B | $4,400 | 1B | $8,700 |
| 5 | Daniel Murphy | LEFT | 0.411 | 0.396 | 0.252 | 38.2% | 6.9% | 8.5% | 35.5% | 2B | $3,400 | 2B | $4,800 | 2B | $9,200 |
| 6 | Anthony Rendon | RIGHT | 0.350 | 0.353 | 0.197 | 35.2% | 10.0% | 17.2% | 36.7% | 3B | $3,000 | 3B | $4,400 | 3B | $8,700 |
| 7 | Matt Wieters | SWITCH | 0.300 | 0.314 | 0.158 | 32.6% | 6.2% | 17.9% | 37.6% | C | $2,600 | C | $3,100 | C | $6,000 |
| 8 | Wilmer Difo | SWITCH | 0.263 | 0.267 | 0.059 | 21.7% | 9.8% | 20.3% | 55.6% | SS | $2,000 | 2B/SS | $2,500 | 2B | $4,800 |
| 9 | Tanner Roark | RIGHT | 0.164 | 0.169 | 0.014 | 10.0% | 5.7% | 25.3% | 60.4% | P | $7,600 | P | $6,600 | P | $13,200 |