MLB Grind Down: Friday, April 20th

Jump to Page 1 2 3
The RotoGrinders MLB Grind Down will give you an in-depth analysis into the upcoming MLB schedule. This article will break down the numbers for every single game and give you analysis on which trends you can exploit. While matchups are a major factor in daily fantasy baseball, there are plenty of other factors to consider such as injuries, weather, and salaries.
The analysis should point you in the right direction, but it is still up to you to decipher the information and make your own selections. No sport has more variance than baseball. The best choice is not always the right choice but following the trends will win you money over time.
Note: As always, if you want to try a new DFS site, be sure to click through a RotoGrinders link and use our DraftKings promo code, FanDuel promo code, and FantasyDraft promo code to receive the best perks in the industry.

Stackability Rating System:
GREEN – A viable full stack in cash games and GPPs.
YELLOW – A viable mini-stack in cash games and full stack in GPPs.
ORANGE – A viable stack in large field GPPs.
RED – Not a recommended stack for cash games or GPPs.
Implied Run Totals
Ballpark Ratings
Cleveland at Baltimore – 7:05 PM ET
| Cleveland | Baltimore | ||||||||||||||
 | Trevor Bauer |  | Dylan Bundy | ||||||||||||
| RIGHT | RIGHT | ||||||||||||||
| Vegas Moneyline | Vegas Over/Under | ||||||||||||||
| CLE-108 | 8.0 | ||||||||||||||
| Stats | wOBA | xwOBA | HC% | BB% | K% | GB% | Stats | wOBA | xwOBA | HC% | BB% | K% | GB% | ||
|---|---|---|---|---|---|---|---|---|---|---|---|---|---|---|---|
| SP vs. Left (2016-17) | 0.348 | 0.340 | 33.0% | 8.5% | 23.7% | 42.4% | SP vs. Left (2016-17) | 0.334 | 0.350 | 39.5% | 7.5% | 17.4% | 29.5% | ||
| SP vs. Right (2016-17) | 0.305 | 0.306 | 36.4% | 7.6% | 28.2% | 48.5% | SP vs. Right (2016-17) | 0.274 | 0.293 | 32.1% | 7.0% | 27.8% | 37.4% | ||
Pitcher Grind Down
| Trevor Bauer | |||||||||
 | FanDuel | DraftKings | FantasyDraft | ||||||
| Salary: | $9,000 | Salary: | $9,400 | Salary: | $17,600 | ||||
| Salary Rank: | 6 of 30 | Salary Rank: | 5 of 30 | Salary Rank: | 5 of 30 | ||||
| Stats | Starts | SIERA | ERA | K% | BB% | GB% | HC% | SC% | |
|---|---|---|---|---|---|---|---|---|---|
| 2017 | 31 | 3.80 | 4.19 | 26.2% | 8.0% | 46.4% | 34.4% | 15.0% | |
| 2018 | 3 | 3.67 | 2.25 | 24.7% | 8.2% | 37.7% | 37.0% | 18.5% | |
Hellooooooooo! Happy Friday everyone. As always, thanks for joining me to break down tonight’s MLB slate. We start in Baltimore in a battle between two good offensive teams. Bauer doesn’t ever seem to get the respect that he deserves, although the DFS community is starting to come around on him. In his first three starts of the season, he has a 3.67 SIERA with a strikeout rate of 25%. He draws a boom or bust matchup tonight against the Orioles, who have five batters in their projected lineup with a strikeout rate of at least 25%.
Quick Breakdown: Bauer is viable as a low floor/high ceiling play in tournaments, especially if you enter multiple lineups each night.
| Dylan Bundy | |||||||||
 | FanDuel | DraftKings | FantasyDraft | ||||||
| Salary: | $9,400 | Salary: | $8,000 | Salary: | $15,100 | ||||
| Salary Rank: | 5 of 30 | Salary Rank: | 8 of 30 | Salary Rank: | 9 of 30 | ||||
| Stats | Starts | SIERA | ERA | K% | BB% | GB% | HC% | SC% | |
|---|---|---|---|---|---|---|---|---|---|
| 2017 | 28 | 4.45 | 4.24 | 21.8% | 7.3% | 32.8% | 36.5% | 17.6% | |
| 2018 | 4 | 2.93 | 1.40 | 29.8% | 6.7% | 36.9% | 31.8% | 21.2% | |
Bundy continues to dominate for the Orioles, posting a 2.93 SIERA with a strikeout rate of 30% on the season. There were some encouraging signs in the spring and he’s clearly been able to carry that over to the regular season. He is throwing more sinkers and sliders than he did last year and his swinging strike rate is all the way up to 16.3%. The best part is that he is still only $8,000 on DraftKings. There is a lot to like here other than his matchup against the Indians. There are a few teams that I don’t target pitchers against and Cleveland is one of them.
Quick Breakdown: At his discounted price on DraftKings, Bundy is worth a look as an SP2 in large-field tournaments, but I will be looking elsewhere.
Batter Grind Down
Cleveland
The fact that we have a game in Camden Yards with a total of eight runs shows how much respect the betting markets have for these two starting pitchers. While I don’t love the idea of playing Dylan Bundy against the Indians, I won’t be targeting any hitters against him. His stuff has been filthy this season and there are 14 other games to choose batters from tonight.
Projected Lineup (Splits vs. RH Pitching)
| # | Player | Bats | wOBA | xwOBA | ISO | HC% | BB% | K% | GB% | FD Pos. | FD Sal. | DK Pos. | DK Sal. | FDRFT Pos. | FDRFT Sal. |
|---|---|---|---|---|---|---|---|---|---|---|---|---|---|---|---|
| 1 | Francisco Lindor | SWITCH | 0.340 | 0.362 | 0.236 | 33.7% | 8.2% | 13.9% | 39.3% | SS | $4,100 | SS | $4,700 | SS | $9,000 |
| 2 | Jason Kipnis | LEFT | 0.292 | 0.310 | 0.179 | 33.3% | 7.0% | 20.4% | 33.5% | 2B | $3,000 | 2B | $3,800 | 2B | $7,200 |
| 3 | Jose Ramirez | SWITCH | 0.388 | 0.356 | 0.268 | 31.3% | 9.7% | 10.4% | 37.7% | 3B | $3,900 | 3B | $4,800 | IF/OF | $9,100 |
| 4 | Michael Brantley | LEFT | 0.365 | 0.372 | 0.182 | 39.4% | 9.8% | 13.2% | 48.3% | OF | $3,200 | OF | $3,700 | LF | $7,300 |
| 5 | Edwin Encarnacion | RIGHT | 0.370 | 0.393 | 0.261 | 37.7% | 12.9% | 19.7% | 34.6% | 1B | $3,400 | 1B | $4,600 | 1B | $9,200 |
| 6 | Yonder Alonso | LEFT | 0.373 | 0.386 | 0.227 | 35.6% | 13.9% | 22.3% | 34.7% | 1B | $2,600 | 1B | $4,200 | 1B | $8,200 |
| 7 | Roberto Perez | RIGHT | 0.268 | 0.291 | 0.132 | 28.2% | 10.0% | 28.9% | 51.4% | C | $2,100 | C | $2,800 | C | $5,700 |
| 8 | Tyler Naquin | LEFT | 0.258 | 0.267 | 0.089 | 36.6% | 6.6% | 26.2% | 56.1% | OF | $2,100 | OF | $2,900 | CF | $5,900 |
| 9 | Bradley Zimmer | LEFT | 0.301 | 0.301 | 0.152 | 37.6% | 8.1% | 33.1% | 44.6% | OF | $2,200 | OF | $3,100 | CF | $5,900 |
Elite Plays – None
Secondary Plays – Francisco Lindor, Jose Ramirez
Stackability – ORANGE
Baltimore
If this is a boom or bust matchup for Trevor Bauer, then this is obviously a boom or bust matchup for the Orioles’ offense. Bauer is a fly-ball pitcher that gives up a lot of hard contact. I have more interest in the Orioles than I do the Indians, but only as one-off targets in large-field tournaments. Trey Mancini, Pedro Alvarez, and Manny Machado all own a .360+ xwOBA against right-handed pitching.
Projected Lineup (Splits vs. RH Pitching)
| # | Player | Bats | wOBA | xwOBA | ISO | HC% | BB% | K% | GB% | FD Pos. | FD Sal. | DK Pos. | DK Sal. | FDRFT Pos. | FDRFT Sal. |
|---|---|---|---|---|---|---|---|---|---|---|---|---|---|---|---|
| 1 | Trey Mancini | RIGHT | 0.360 | 0.361 | 0.211 | 34.0% | 7.0% | 22.4% | 50.2% | OF | $3,400 | 1B/OF | $3,500 | IF/OF | $6,300 |
| 2 | Pedro Alvarez | LEFT | 0.380 | 0.376 | 0.167 | 31.6% | 14.3% | 25.4% | 36.8% | 1B | $2,300 | 1B/3B | $3,000 | 1B | $6,000 |
| 3 | Manny Machado | RIGHT | 0.324 | 0.360 | 0.191 | 36.2% | 8.1% | 17.3% | 42.0% | SS | $4,700 | SS | $5,000 | 3B | $10,000 |
| 4 | Adam Jones | RIGHT | 0.329 | 0.321 | 0.188 | 30.8% | 3.2% | 19.1% | 44.4% | OF | $3,100 | OF | $3,900 | CF | $7,800 |
| 5 | Chris Davis | LEFT | 0.313 | 0.341 | 0.223 | 42.1% | 12.5% | 34.5% | 39.4% | 1B | $2,400 | 1B | $3,100 | IF/OF | $5,500 |
| 6 | Tim Beckham | RIGHT | 0.315 | 0.310 | 0.162 | 38.6% | 5.3% | 29.9% | 50.0% | 2B | $2,700 | 3B | $3,000 | SS | $5,600 |
| 7 | Danny Valencia | RIGHT | 0.291 | 0.276 | 0.141 | 25.5% | 5.8% | 26.3% | 49.4% | 3B | $2,500 | 3B | $2,800 | 1B | $5,400 |
| 8 | Anthony Santander | SWITCH | 0.283 | 0.263 | 0.154 | 34.9% | 1.9% | 18.5% | 30.2% | OF | $2,000 | OF | $2,800 | LF | $5,700 |
| 9 | Caleb Joseph | RIGHT | 0.265 | 0.249 | 0.124 | 25.3% | 3.2% | 29.8% | 47.2% | C | $2,000 | C | $2,600 | C | $4,700 |
Elite Plays – None
Secondary Plays – Trey Mancini, Pedro Alvarez, Manny Machado
Stackability – ORANGE
Pittsburgh at Philadelphia – 7:05 PM ET
| Pittsburgh | Philadelphia | ||||||||||||||
 | Ivan Nova |  | Ben Lively | ||||||||||||
| RIGHT | RIGHT | ||||||||||||||
| Vegas Moneyline | Vegas Over/Under | ||||||||||||||
| PHI-113 | 8.0 | ||||||||||||||
| Stats | wOBA | xwOBA | HC% | BB% | K% | GB% | Stats | wOBA | xwOBA | HC% | BB% | K% | GB% | ||
|---|---|---|---|---|---|---|---|---|---|---|---|---|---|---|---|
| SP vs. Left (2016-17) | 0.349 | 0.384 | 34.5% | 4.4% | 11.8% | 42.6% | SP vs. Left (2016-17) | 0.387 | 0.381 | 30.7% | 8.3% | 11.4% | 40.3% | ||
| SP vs. Right (2016-17) | 0.314 | 0.310 | 35.2% | 4.6% | 22.0% | 48.3% | SP vs. Right (2016-17) | 0.310 | 0.294 | 30.6% | 3.7% | 20.1% | 32.9% | ||
Pitcher Grind Down
| Ivan Nova | |||||||||
 | FanDuel | DraftKings | FantasyDraft | ||||||
| Salary: | $8,300 | Salary: | $6,300 | Salary: | $13,000 | ||||
| Salary Rank: | 8 of 30 | Salary Rank: | 20 of 30 | Salary Rank: | 17 of 30 | ||||
| Stats | Starts | SIERA | ERA | K% | BB% | GB% | HC% | SC% | |
|---|---|---|---|---|---|---|---|---|---|
| 2017 | 31 | 4.45 | 4.14 | 16.7% | 4.6% | 45.7% | 34.8% | 16.6% | |
| 2018 | 4 | 3.49 | 4.88 | 21.8% | 4.0% | 43.8% | 35.6% | 13.7% | |
Nova is not a pitcher that I want to target against the Phillies or in this ballpark. In order for him to be viable in DFS, he has to be facing a right-handed heavy lineup in a pitcher-friendly ballpark. He’s 0-for-2 with that criteria. Since the start of last season, he has allowed a .384 xwOBA to left-handed hitters and the Phillies are projected to have five of them in their lineup tonight.
Quick Breakdown: There will be times to use Nova, but this isn’t one of them.
| Ben Lively | |||||||||
 | FanDuel | DraftKings | FantasyDraft | ||||||
| Salary: | $6,400 | Salary: | $5,800 | Salary: | $11,300 | ||||
| Salary Rank: | 21 of 30 | Salary Rank: | 24 of 30 | Salary Rank: | 24 of 30 | ||||
| Stats | Starts | SIERA | ERA | K% | BB% | GB% | HC% | SC% | |
|---|---|---|---|---|---|---|---|---|---|
| 2017 | 15 | 5.27 | 4.26 | 14.0% | 6.5% | 38.2% | 30.2% | 21.5% | |
| 2018 | 3 | 3.29 | 5.87 | 24.3% | 4.3% | 29.2% | 33.3% | 27.1% | |
For the longest time, Lively’s first name kept popping up as Edward on the lineups page. I’m not sure if that’s his real name or what, but it gave me a chuckle every time. He’s actually been decent in his first three starts of the season, posting a 24% strikeout rate and a 4% walk rate. He’s a small favorite here, but the Pirates are a low-strikeout offense. With 15 games on the schedule tonight, we can find better options.
Quick Breakdown: Edward can be avoided in all formats.
Batter Grind Down
Pittsburgh
The Pirates left their bats at home last night, as they couldn’t get anything going against Jake Arrieta. I was clearly wrong about that one, but that happens in baseball. They draw a mediocre matchup tonight against Ben Lively. While he has looked sharp this season, he has allowed a .387 xwOBA to left-handed hitters over the last two years. There aren’t any core plays here, but there are a few decent one-off targets.
Projected Lineup (Splits vs. RH Pitching)
| # | Player | Bats | wOBA | xwOBA | ISO | HC% | BB% | K% | GB% | FD Pos. | FD Sal. | DK Pos. | DK Sal. | FDRFT Pos. | FDRFT Sal. |
|---|---|---|---|---|---|---|---|---|---|---|---|---|---|---|---|
| 1 | Adam Frazier | LEFT | 0.322 | 0.332 | 0.139 | 29.2% | 8.3% | 12.0% | 48.3% | OF | $2,400 | 2B/OF | $3,300 | IF/OF | $6,600 |
| 2 | Gregory Polanco | LEFT | 0.317 | 0.339 | 0.182 | 29.4% | 8.3% | 13.1% | 39.8% | OF | $4,300 | OF | $4,300 | RF | $8,000 |
| 3 | Starling Marte | RIGHT | 0.365 | 0.338 | 0.150 | 26.9% | 7.5% | 17.2% | 46.9% | OF | $4,300 | OF | $4,600 | CF | $8,900 |
| 4 | Josh Bell | SWITCH | 0.340 | 0.329 | 0.202 | 32.7% | 10.8% | 20.3% | 52.3% | 1B | $3,700 | 1B | $3,800 | 1B | $7,600 |
| 5 | Corey Dickerson | LEFT | 0.339 | 0.334 | 0.219 | 34.9% | 5.8% | 22.2% | 37.9% | OF | $3,800 | OF | $3,800 | LF | $7,400 |
| 6 | Francisco Cervelli | RIGHT | 0.326 | 0.338 | 0.134 | 34.4% | 10.5% | 19.9% | 47.4% | C | $3,000 | C | $3,100 | C | $5,900 |
| 7 | Colin Moran | LEFT | 0.342 | 0.394 | 0.140 | 40.9% | 8.9% | 12.5% | 38.6% | 3B | $2,900 | 3B | $3,200 | 3B | $6,300 |
| 8 | Jordy Mercer | RIGHT | 0.311 | 0.304 | 0.148 | 27.8% | 9.4% | 15.6% | 47.1% | SS | $2,800 | SS | $2,900 | SS | $5,900 |
| 9 | Ivan Nova | RIGHT | 0.000 | 0.069 | 0.000 | 4.0% | 0.0% | 47.9% | 68.4% | P | $8,300 | P | $6,300 | P | $13,000 |
Elite Plays – None
Secondary Plays – Gregory Polanco, Josh Bell, Corey Dickerson
Stackability – ORANGE / YELLOW
Philadelphia
The Phillies are a better offense than most people give them credit for. They have a nice mix of high on-base and power hitters, but they do strikeout at a high rate. The good news is that Ivan Nova has a 12% strikeout rate against lefties. He also allows a .384 xwOBA and a 35% hard contact rate to batters from that side of the plate. Carlos Santana is one of my favorite one-off targets on the board tonight. I’m not sure we need to stack the Phillies in a slate this size, but Cesar Hernandez, Rhys Hoskins, and Nick Williams are viable as well.
Projected Lineup (Splits vs. RH Pitching)
| # | Player | Bats | wOBA | xwOBA | ISO | HC% | BB% | K% | GB% | FD Pos. | FD Sal. | DK Pos. | DK Sal. | FDRFT Pos. | FDRFT Sal. |
|---|---|---|---|---|---|---|---|---|---|---|---|---|---|---|---|
| 1 | Cesar Hernandez | SWITCH | 0.347 | 0.310 | 0.114 | 21.5% | 11.3% | 21.5% | 49.5% | 2B | $3,500 | 2B | $4,200 | 2B | $8,400 |
| 2 | Carlos Santana | SWITCH | 0.346 | 0.392 | 0.210 | 35.9% | 13.6% | 17.5% | 33.0% | 1B | $3,200 | 1B | $3,900 | 1B | $7,800 |
| 3 | Odubel Herrera | LEFT | 0.337 | 0.313 | 0.169 | 28.4% | 6.5% | 21.3% | 40.6% | OF | $3,600 | OF | $3,900 | IF/OF | $7,800 |
| 4 | Rhys Hoskins | RIGHT | 0.427 | 0.411 | 0.312 | 42.4% | 14.6% | 22.9% | 27.2% | OF | $4,900 | OF | $5,100 | 1B | $9,700 |
| 5 | Nick Williams | LEFT | 0.349 | 0.346 | 0.198 | 37.1% | 6.3% | 27.6% | 46.8% | OF | $2,300 | OF | $2,900 | LF | $5,800 |
| 6 | Scott Kingery | RIGHT | 0.322 | 0.326 | 0.200 | 35.3% | 8.0% | 24.0% | 38.2% | SS | $3,700 | 3B/OF | $4,100 | SS | $8,000 |
| 7 | Andrew Knapp | SWITCH | 0.318 | 0.308 | 0.103 | 38.1% | 15.5% | 28.3% | 56.2% | C | $2,200 | C | $2,900 | C | $5,900 |
| 8 | Ben Lively | RIGHT | 0.210 | 0.222 | 0.136 | 26.7% | 0.0% | 31.8% | 60.0% | P | $6,400 | P | $5,800 | P | $11,300 |
| 9 | J.P. Crawford | LEFT | 0.328 | 0.305 | 0.155 | 20.3% | 12.1% | 22.2% | 33.3% | SS | $2,500 | SS | $3,100 | SS | $6,000 |
Elite Plays – Carlos Santana
Secondary Plays – Cesar Hernandez, Rhys Hoskins, Nick Williams
Stackability – YELLOW
Toronto at NY Yankees – 7:05 PM ET
| Toronto | NY Yankees | ||||||||||||||
 | Marco Estrada |  | Sonny Gray | ||||||||||||
| RIGHT | RIGHT | ||||||||||||||
| Vegas Moneyline | Vegas Over/Under | ||||||||||||||
| NYY-190 | 9.0 | ||||||||||||||
| Stats | wOBA | xwOBA | HC% | BB% | K% | GB% | Stats | wOBA | xwOBA | HC% | BB% | K% | GB% | ||
|---|---|---|---|---|---|---|---|---|---|---|---|---|---|---|---|
| SP vs. Left (2016-17) | 0.291 | 0.278 | 24.4% | 7.0% | 22.0% | 34.3% | SP vs. Left (2016-17) | 0.290 | 0.311 | 25.9% | 9.7% | 22.2% | 52.9% | ||
| SP vs. Right (2016-17) | 0.366 | 0.333 | 30.1% | 10.4% | 21.3% | 27.5% | SP vs. Right (2016-17) | 0.299 | 0.319 | 29.6% | 7.7% | 22.8% | 54.0% | ||
Pitcher Grind Down
| Marco Estrada | |||||||||
 | FanDuel | DraftKings | FantasyDraft | ||||||
| Salary: | $7,600 | Salary: | $6,700 | Salary: | $13,000 | ||||
| Salary Rank: | 13 of 30 | Salary Rank: | 17 of 30 | Salary Rank: | 17 of 30 | ||||
| Stats | Starts | SIERA | ERA | K% | BB% | GB% | HC% | SC% | |
|---|---|---|---|---|---|---|---|---|---|
| 2017 | 33 | 4.69 | 4.98 | 21.8% | 8.8% | 30.3% | 27.2% | 21.4% | |
| 2018 | 3 | 4.64 | 4.24 | 19.4% | 9.7% | 33.3% | 31.4% | 21.6% | |
Estrada is great when he’s locked in and a great pitcher to stack against when he’s struggling. It’s hard to know which Estrada is going to show up tonight, but his form hasn’t been great. In three starts this season, he has a 4.64 SIERA with a walk rate of 10%. Fly-ball pitchers are typically easy fades in small ballparks, especially when they are matched up with an offense that is as potent as the Yankees.
Quick Breakdown: Nope, nope, nope.
| Sonny Gray | |||||||||
 | FanDuel | DraftKings | FantasyDraft | ||||||
| Salary: | $8,200 | Salary: | $7,700 | Salary: | $15,500 | ||||
| Salary Rank: | 9 of 30 | Salary Rank: | 9 of 30 | Salary Rank: | 8 of 30 | ||||
| Stats | Starts | SIERA | ERA | K% | BB% | GB% | HC% | SC% | |
|---|---|---|---|---|---|---|---|---|---|
| 2017 | 27 | 4.08 | 3.55 | 22.6% | 8.4% | 52.8% | 28.0% | 16.8% | |
| 2018 | 3 | 3.75 | 6.92 | 22.4% | 10.5% | 60.5% | 27.3% | 25.0% | |
Gray hasn’t had the best luck in the early part of the season. While his high walk rate hasn’t helped, it’s safe to say that his .409 BABIP is going to come down (league average is around .300). The advanced numbers all check out — 3.75 SIERA, 22% strikeout rate, and a 61% ground ball rate. Perhaps this is the night where positive regression shines through. I’m not afraid to target pitchers against the Blue Jays when they are on the road. They have some decent power in their lineup, but have six projected starters with at least a 22% strikeout rate against right-handed pitching.
Quick Breakdown: Gray is cheap, he’s a large favorite, and the stats check out. He’s viable as an SP2 in all formats.
Batter Grind Down
Toronto
Even though the Blue Jays are playing in a hitter-friendly ballpark, I have a hard time loading up hitters against pitchers with an elite ground ball rate and at least an average strikeout rate. When the two most likely outcomes are a strikeout or a ground ball, that’s not great for an offense. The first three batters in this lineup (Curtis Granderson, Teoscar Hernandez, and Justin Smoak) all have high fly-ball rates, but are best suited as large-field tournament plays.
Projected Lineup (Splits vs. RH Pitching)
| # | Player | Bats | wOBA | xwOBA | ISO | HC% | BB% | K% | GB% | FD Pos. | FD Sal. | DK Pos. | DK Sal. | FDRFT Pos. | FDRFT Sal. |
|---|---|---|---|---|---|---|---|---|---|---|---|---|---|---|---|
| 1 | Curtis Granderson | LEFT | 0.346 | 0.348 | 0.247 | 35.6% | 14.1% | 23.0% | 31.8% | OF | $3,100 | OF | $3,900 | CF | $7,400 |
| 2 | Teoscar Hernandez | RIGHT | 0.412 | 0.348 | 0.362 | 27.3% | 8.0% | 33.3% | 34.1% | OF | $3,300 | OF | $3,200 | CF | $6,800 |
| 3 | Justin Smoak | SWITCH | 0.359 | 0.401 | 0.267 | 40.5% | 11.7% | 22.8% | 33.6% | 1B | $4,100 | 1B | $4,400 | 1B | $8,100 |
| 4 | Yangervis Solarte | SWITCH | 0.343 | 0.321 | 0.198 | 31.3% | 7.9% | 12.6% | 38.1% | 3B | $3,800 | 2B/3B | $4,100 | 2B | $8,500 |
| 5 | Russell Martin | RIGHT | 0.331 | 0.344 | 0.181 | 29.9% | 13.2% | 22.0% | 52.7% | C | $2,300 | C | $3,300 | C | $6,300 |
| 6 | Kevin Pillar | RIGHT | 0.283 | 0.307 | 0.127 | 26.7% | 5.0% | 15.9% | 44.3% | OF | $3,100 | OF | $3,400 | CF | $6,300 |
| 7 | Randal Grichuk | RIGHT | 0.313 | 0.324 | 0.243 | 39.7% | 5.9% | 31.4% | 37.5% | OF | $2,200 | OF | $3,200 | LF | $6,600 |
| 8 | Aledmys Diaz | RIGHT | 0.314 | 0.290 | 0.186 | 26.3% | 2.9% | 13.5% | 47.3% | SS | $3,100 | SS | $3,500 | SS | $6,400 |
| 9 | Devon Travis | RIGHT | 0.261 | 0.302 | 0.126 | 29.9% | 2.0% | 22.7% | 41.1% | 2B | $2,200 | 2B | $2,900 | 2B | $5,700 |
Elite Plays – None
Secondary Plays – Curtis Granderson (GPP), Teoscar Hernandez (GPP), Justin Smoak (GPP)
Stackability – ORANGE
NY Yankees
The Yankees have as much firepower as any offense in baseball. They also have one of the best hitter’s parks in baseball. Tonight they square off against a fly-ball pitcher that gives up a lot of walks. We have to like the upside for this lineup. If you look at the table below, you can see that the Yankees have eight projected starters with a wOBA of at least .345 against right-handed pitching. I’m typically a one lineup per site type of guy, but am planning to play a few extra tonight because I love the slate. At least one of my lineups will be a Yankees’ stack.
Projected Lineup (Splits vs. RH Pitching)
| # | Player | Bats | wOBA | xwOBA | ISO | HC% | BB% | K% | GB% | FD Pos. | FD Sal. | DK Pos. | DK Sal. | FDRFT Pos. | FDRFT Sal. |
|---|---|---|---|---|---|---|---|---|---|---|---|---|---|---|---|
| 1 | Brett Gardner | LEFT | 0.357 | 0.333 | 0.184 | 31.5% | 11.4% | 18.9% | 43.5% | OF | $3,500 | OF | $4,000 | LF | $7,700 |
| 2 | Aaron Judge | RIGHT | 0.435 | 0.442 | 0.345 | 43.6% | 16.4% | 30.2% | 35.4% | OF | $5,100 | OF | $5,300 | RF | $10,300 |
| 3 | Giancarlo Stanton | RIGHT | 0.377 | 0.370 | 0.304 | 38.2% | 10.6% | 27.5% | 45.1% | OF | $4,800 | OF | $5,000 | RF | $9,800 |
| 4 | Didi Gregorius | LEFT | 0.374 | 0.314 | 0.257 | 27.8% | 6.5% | 10.8% | 35.6% | SS | $4,600 | SS | $5,200 | SS | $10,200 |
| 5 | Gary Sanchez | RIGHT | 0.351 | 0.381 | 0.238 | 36.3% | 6.1% | 22.2% | 43.0% | C | $3,900 | C | $4,700 | C | $9,400 |
| 6 | Aaron Hicks | SWITCH | 0.360 | 0.345 | 0.230 | 31.0% | 16.0% | 20.0% | 41.9% | OF | $3,600 | OF | $3,400 | CF | $6,600 |
| 7 | Neil Walker | SWITCH | 0.348 | 0.363 | 0.177 | 35.3% | 12.4% | 16.8% | 39.3% | 1B | $2,500 | 1B/2B | $3,300 | 2B | $6,400 |
| 8 | Miguel Andujar | RIGHT | 0.391 | 0.376 | 0.333 | 44.4% | 3.1% | 12.5% | 44.4% | 3B | $2,600 | 3B | $2,800 | 3B | $5,700 |
| 9 | Tyler Wade | LEFT | 0.207 | 0.247 | 0.081 | 17.7% | 8.6% | 28.4% | 52.0% | 2B | $2,000 | 2B | $3,200 | 2B | $6,700 |
Elite Plays – Aaron Judge, Didi Gregorius, Gary Sanchez
Secondary Plays – Brett Gardner, Giancarlo Stanton, Aaron Hicks, Neil Walker
Stackability – GREEN
Kansas City at Detroit – 7:10 PM ET
| Kansas City | Detroit | ||||||||||||||
 | Jakob Junis |  | Daniel Norris | ||||||||||||
| RIGHT | LEFT | ||||||||||||||
| Vegas Moneyline | Vegas Over/Under | ||||||||||||||
| DET-103 | 8.0 | ||||||||||||||
| Stats | wOBA | xwOBA | HC% | BB% | K% | GB% | Stats | wOBA | xwOBA | HC% | BB% | K% | GB% | ||
|---|---|---|---|---|---|---|---|---|---|---|---|---|---|---|---|
| SP vs. Left (2016-17) | 0.325 | 0.332 | 34.6% | 5.8% | 18.2% | 46.6% | SP vs. Left (2016-17) | 0.381 | 0.352 | 36.1% | 9.2% | 18.3% | 38.6% | ||
| SP vs. Right (2016-17) | 0.306 | 0.357 | 36.9% | 5.9% | 20.6% | 33.1% | SP vs. Right (2016-17) | 0.346 | 0.353 | 42.3% | 9.7% | 19.7% | 39.5% | ||
Pitcher Grind Down
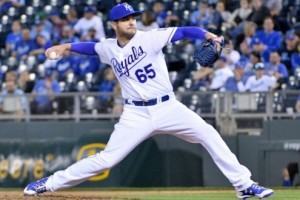
| Jakob Junis | |||||||||
 | FanDuel | DraftKings | FantasyDraft | ||||||
| Salary: | $8,500 | Salary: | $8,300 | Salary: | $16,300 | ||||
| Salary Rank: | 7 of 30 | Salary Rank: | 7 of 30 | Salary Rank: | 7 of 30 | ||||
| Stats | Starts | SIERA | ERA | K% | BB% | GB% | HC% | SC% | |
|---|---|---|---|---|---|---|---|---|---|
| 2017 | 16 | 4.49 | 4.30 | 19.0% | 5.9% | 40.1% | 36.7% | 16.9% | |
| 2018 | 3 | 3.74 | 1.93 | 21.9% | 5.5% | 38.0% | 30.0% | 22.0% | |
Junis was a pitcher that I had my eye on heading into the season. He showed some promise as a rooke and has come out of the gates firing this season. In three starts, he has a 3.74 SIERA with a strikeout rate of 22% and a walk rate of 6%. While I typically like targeting right-handed hitters against the Tigers, I’m a little worried about Junis in this spot. He has reverse-splits (meaning he has worse numbers against batters of the same handedness as himself) and the Tigers have a right-handed heavy lineup.
Quick Breakdown: Junis is talented, but this may not be the best spot for him.
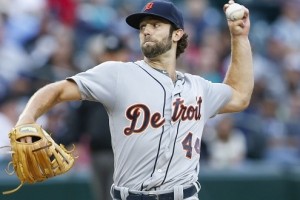
| Daniel Norris | |||||||||
 | FanDuel | DraftKings | FantasyDraft | ||||||
| Salary: | $6,000 | Salary: | $5,500 | Salary: | $10,800 | ||||
| Salary Rank: | 24 of 30 | Salary Rank: | 25 of 30 | Salary Rank: | 25 of 30 | ||||
| Stats | Starts | SIERA | ERA | K% | BB% | GB% | HC% | SC% | |
|---|---|---|---|---|---|---|---|---|---|
| 2017 | 18 | 4.94 | 5.31 | 18.7% | 9.6% | 38.8% | 41.7% | 16.3% | |
| 2018 | 0 | 2.73 | 7.11 | 30.0% | 10.0% | 47.1% | 22.2% | 11.1% | |
The Tigers need a spot starter for the second half of this double-header (the first game isn’t included in the main slate), so Norris will get the nod. He has experience as a starter, but has yet to throw more than 64 pitches in any outing this season. I am much more willing to trust his numbers from last season than I am to trust his small sample out of the bullpen this season. Even though I like picking on the Royals, Norris offers more risk than upside.
Quick Breakdown: There are too many red flags for Norris tonight (and in general).
Batter Grind Down
Kansas City
The Royals see a positive ballpark shift playing in Detroit and they draw an exploitable matchup against Daniel Norris. Throughout his career, Norris has been a fly-ball pitcher with a low strikeout rate. He has struggled with both left and right-handed hitters, allowing a .350+ xwOBA and a 36%+ hard contact rate to both since the beginning of last season. We don’t need to go as far as stacking the Royals here, but Whit Merrifield is one of the best one-off targets on the board tonight.
Projected Lineup (Splits vs. LH Pitching)
| # | Player | Bats | wOBA | xwOBA | ISO | HC% | BB% | K% | GB% | FD Pos. | FD Sal. | DK Pos. | DK Sal. | FDRFT Pos. | FDRFT Sal. |
|---|---|---|---|---|---|---|---|---|---|---|---|---|---|---|---|
| 1 | Jon Jay | LEFT | 0.333 | 0.347 | 0.020 | 17.7% | 13.3% | 19.2% | 52.0% | OF | $2,200 | OF | $3,100 | CF | $5,500 |
| 2 | Whit Merrifield | RIGHT | 0.343 | 0.340 | 0.183 | 34.5% | 5.9% | 15.7% | 37.6% | 2B | $3,400 | 2B/OF | $4,000 | IF/OF | $7,200 |
| 3 | Mike Moustakas | LEFT | 0.325 | 0.309 | 0.197 | 30.2% | 3.2% | 16.2% | 41.9% | 3B | $3,700 | 3B | $4,200 | 3B | $8,100 |
| 4 | Lucas Duda | LEFT | 0.276 | 0.299 | 0.212 | 37.0% | 6.2% | 35.7% | 38.4% | 1B | $2,300 | 1B | $3,400 | 1B | $6,900 |
| 5 | Jorge Soler | RIGHT | 0.272 | 0.343 | 0.160 | 47.1% | 10.5% | 29.8% | 38.2% | OF | $2,400 | OF | $3,000 | RF | $6,000 |
| 6 | Abraham Almonte | SWITCH | 0.239 | 0.251 | 0.061 | 19.4% | 10.7% | 25.0% | 68.6% | OF | $2,000 | OF | $2,900 | RF | $5,500 |
| 7 | Paulo Orlando | RIGHT | 0.327 | 0.373 | 0.103 | 30.4% | 0.0% | 20.0% | 34.8% | OF | $2,300 | OF | $2,700 | RF | $5,500 |
| 8 | Alcides Escobar | RIGHT | 0.325 | 0.294 | 0.154 | 32.8% | 5.1% | 16.0% | 40.3% | SS | $2,600 | SS | $2,800 | SS | $5,700 |
| 9 | Cam Gallagher | RIGHT | 0.288 | 0.443 | 0.083 | 30.0% | 7.7% | 15.4% | 20.0% | C | $2,100 | C | $2,500 | C | $4,900 |
Elite Plays – Whit Merrifield
Secondary Plays – Jorge Soler (GPP)
Stackability – ORANGE
Detroit
The Tigers’ offense went nuts in yesterday’s game against the Orioles, but they don’t have the most talented collection of hitters. They also draw a tougher matchup tonight, as Jake Junis has pitched well so far this season. He has good command and a slightly above-average strikeout rate. In a smaller slate, I would give Leonys Martin and Nick Castellanos a look, but they are a bit of a reach in a 15-game slate. Overall, this game doesn’t have much fantasy appeal.
Projected Lineup (Splits vs. RH Pitching)
| # | Player | Bats | wOBA | xwOBA | ISO | HC% | BB% | K% | GB% | FD Pos. | FD Sal. | DK Pos. | DK Sal. | FDRFT Pos. | FDRFT Sal. |
|---|---|---|---|---|---|---|---|---|---|---|---|---|---|---|---|
| 1 | Leonys Martin | LEFT | 0.259 | 0.286 | 0.093 | 24.1% | 7.4% | 23.3% | 35.8% | OF | $2,800 | OF | $3,200 | CF | $6,800 |
| 2 | Jeimer Candelario | SWITCH | 0.335 | 0.319 | 0.166 | 26.5% | 10.0% | 20.0% | 44.4% | 3B | $3,000 | 3B | $3,300 | 3B | $6,300 |
| 3 | Miguel Cabrera | RIGHT | 0.292 | 0.375 | 0.143 | 42.2% | 9.3% | 20.0% | 42.8% | 1B | $3,400 | 1B | $4,000 | 1B | $7,200 |
| 4 | Nick Castellanos | RIGHT | 0.329 | 0.375 | 0.185 | 43.9% | 6.7% | 22.6% | 36.1% | OF | $3,400 | OF | $4,400 | IF/OF | $8,300 |
| 5 | Victor Martinez | SWITCH | 0.320 | 0.378 | 0.138 | 43.7% | 8.8% | 14.1% | 37.8% | C | $2,300 | 1B | $3,300 | 1B | $6,500 |
| 6 | James McCann | RIGHT | 0.269 | 0.304 | 0.106 | 35.7% | 5.7% | 25.1% | 39.2% | C | $2,200 | C | $2,900 | C | $5,600 |
| 7 | JaCoby Jones | RIGHT | 0.215 | 0.245 | 0.060 | 31.3% | 7.0% | 38.3% | 53.0% | OF | $2,100 | OF | $2,800 | IF/OF | $5,600 |
| 8 | Jose Iglesias | RIGHT | 0.274 | 0.258 | 0.115 | 27.0% | 4.2% | 15.1% | 52.5% | SS | $2,000 | SS | $2,700 | SS | $5,800 |
| 9 | Dixon Machado | RIGHT | 0.294 | 0.291 | 0.098 | 35.1% | 4.6% | 19.1% | 53.8% | 2B | $2,400 | 2B | $3,200 | SS | $6,800 |
Elite Plays – None
Secondary Plays – Leonys Martin, Nick Castellanos
Stackability – ORANGE
Minnesota at Tampa Bay – 7:10 PM ET
| Minnesota | Tampa Bay | ||||||||||||||
 | Lance Lynn |  | Chris Archer | ||||||||||||
| RIGHT | RIGHT | ||||||||||||||
| Vegas Moneyline | Vegas Over/Under | ||||||||||||||
| TB -125 | 7.5 | ||||||||||||||
| Stats | wOBA | xwOBA | HC% | BB% | K% | GB% | Stats | wOBA | xwOBA | HC% | BB% | K% | GB% | ||
|---|---|---|---|---|---|---|---|---|---|---|---|---|---|---|---|
| SP vs. Left (2016-17) | 0.354 | 0.360 | 30.8% | 14.3% | 15.3% | 45.5% | SP vs. Left (2016-17) | 0.350 | 0.325 | 43.1% | 8.9% | 27.7% | 42.5% | ||
| SP vs. Right (2016-17) | 0.260 | 0.280 | 28.3% | 7.4% | 24.8% | 43.0% | SP vs. Right (2016-17) | 0.284 | 0.293 | 36.0% | 5.8% | 29.8% | 41.3% | ||
Pitcher Grind Down
| Lance Lynn | |||||||||
 | FanDuel | DraftKings | FantasyDraft | ||||||
| Salary: | $7,100 | Salary: | $6,400 | Salary: | $13,000 | ||||
| Salary Rank: | 16 of 30 | Salary Rank: | 19 of 30 | Salary Rank: | 17 of 30 | ||||
| Stats | Starts | SIERA | ERA | K% | BB% | GB% | HC% | SC% | |
|---|---|---|---|---|---|---|---|---|---|
| 2017 | 33 | 4.85 | 3.43 | 19.7% | 10.1% | 44.0% | 29.2% | 21.1% | |
| 2018 | 2 | 5.63 | 5.00 | 28.6% | 23.8% | 50.0% | 40.0% | 25.0% | |
I’ve always been lower on Lynn than most of the DFS community. In his time with the Cardinals, he was a beneficiary of playing in a good ballpark with a good offense at his back. Now that he’s in the American League, we are starting to see him struggle. In his first two starts of the season, he has a 5.63 SIERA with a walk rate of 24%. I know his matchup against the Rays is appealing, but don’t fall for the trap.
Quick Breakdown: Lynn would need to be extremely cheap to deserve consideration tonight and he’s not.
| Chris Archer | |||||||||
 | FanDuel | DraftKings | FantasyDraft | ||||||
| Salary: | $8,000 | Salary: | $8,800 | Salary: | $17,300 | ||||
| Salary Rank: | 11 of 30 | Salary Rank: | 6 of 30 | Salary Rank: | 6 of 30 | ||||
| Stats | Starts | SIERA | ERA | K% | BB% | GB% | HC% | SC% | |
|---|---|---|---|---|---|---|---|---|---|
| 2017 | 34 | 3.44 | 4.07 | 29.2% | 7.0% | 42.0% | 39.4% | 13.2% | |
| 2018 | 4 | 3.72 | 7.84 | 25.0% | 9.4% | 40.3% | 38.7% | 21.0% | |
There are plenty of great arms taking the mound tonight, but Archer is my favorite when you factor in salaries. He gives you elite strikeout upside at a fraction of the price. Sheesh, I’m starting to sound like a used car salesman. He’s been unlucky in his first four starts this season, but positive regression is due. He currently owns a 3.72 SIERA with a strikeout rate of 25%. The Twins actually have a potent offense, but Archer gets to face them at home in a pitcher-friendly ballpark. It’s time for one of his classic double-digit strikeout performances.
Quick Breakdown: Archer is an elite play in all formats.
Batter Grind Down
Minnesota
Seeing as how Chris Archer is a core play of mine, I will obviously be fading the Twins. They are playing on the road in a pitcher-friendly ballpark and they are facing a pitcher with an above-average strikeout rate and a great track record at home. They have also struggled against Archer in the past, combining for a .222 wOBA and 34 strikeouts in 105 plate appearances.
Projected Lineup (Splits vs. RH Pitching)
| # | Player | Bats | wOBA | xwOBA | ISO | HC% | BB% | K% | GB% | FD Pos. | FD Sal. | DK Pos. | DK Sal. | FDRFT Pos. | FDRFT Sal. |
|---|---|---|---|---|---|---|---|---|---|---|---|---|---|---|---|
| 1 | Brian Dozier | RIGHT | 0.346 | 0.332 | 0.213 | 32.8% | 10.6% | 19.8% | 38.1% | 2B | $4,000 | 2B | $4,600 | 2B | $9,300 |
| 2 | Joe Mauer | LEFT | 0.360 | 0.403 | 0.127 | 40.6% | 12.7% | 13.5% | 48.7% | 1B | $3,200 | 1B | $3,200 | 1B | $6,500 |
| 3 | Miguel Sano | RIGHT | 0.349 | 0.349 | 0.229 | 45.4% | 10.6% | 37.9% | 39.0% | 3B | $3,700 | 3B | $4,100 | IF/OF | $8,200 |
| 4 | Eddie Rosario | LEFT | 0.370 | 0.351 | 0.261 | 33.3% | 7.4% | 17.8% | 38.5% | OF | $3,000 | OF | $3,000 | LF | $5,400 |
| 5 | Logan Morrison | LEFT | 0.357 | 0.375 | 0.278 | 38.8% | 13.4% | 25.2% | 33.3% | 1B | $2,100 | 1B | $2,900 | 1B | $5,600 |
| 6 | Eduardo Escobar | SWITCH | 0.328 | 0.332 | 0.220 | 35.3% | 5.9% | 21.6% | 32.3% | SS | $2,900 | SS | $3,000 | SS | $5,600 |
| 7 | Max Kepler | LEFT | 0.357 | 0.335 | 0.221 | 36.6% | 10.0% | 16.5% | 40.6% | OF | $2,400 | OF | $3,000 | RF | $6,000 |
| 8 | Robbie Grossman | SWITCH | 0.323 | 0.337 | 0.150 | 28.4% | 12.5% | 20.6% | 38.9% | OF | $2,000 | OF | $2,800 | LF | $5,500 |
| 9 | Jason Castro | LEFT | 0.308 | 0.321 | 0.145 | 34.0% | 12.2% | 29.3% | 40.9% | C | $2,100 | C | $2,600 | C | $4,800 |
Elite Plays – None
Secondary Plays – None
Stackability – RED
Tampa Bay
In a smaller slate, I would have some interest in the Rays’ offense. Lance Lynn has a below-average strikeout rate, the form is not good coming into this start, and he has allowed a .360 xwOBA to left-handed hitters since the beginning of last season. The problem with the Rays is that there are so many good offenses to target that they will end up falling by the wayside. If you absolutely have to target the Rays for some reason, Denard Span, Joey Wendle, and Brad Miller are your best bets.
Projected Lineup (Splits vs. RH Pitching)
| # | Player | Bats | wOBA | xwOBA | ISO | HC% | BB% | K% | GB% | FD Pos. | FD Sal. | DK Pos. | DK Sal. | FDRFT Pos. | FDRFT Sal. |
|---|---|---|---|---|---|---|---|---|---|---|---|---|---|---|---|
| 1 | Denard Span | LEFT | 0.343 | 0.343 | 0.182 | 27.7% | 7.7% | 12.5% | 40.4% | OF | $2,600 | OF | $2,800 | CF | $5,700 |
| 2 | Joey Wendle | LEFT | 0.335 | 0.299 | 0.217 | 35.1% | 11.1% | 18.5% | 56.8% | 2B | $2,800 | 2B | $2,800 | 2B | $5,900 |
| 3 | Carlos Gomez | RIGHT | 0.343 | 0.349 | 0.211 | 41.4% | 8.1% | 29.1% | 38.3% | OF | $2,800 | OF | $3,700 | CF | $7,400 |
| 4 | C.J. Cron | RIGHT | 0.301 | 0.332 | 0.151 | 34.9% | 5.6% | 24.8% | 34.9% | 1B | $3,300 | 1B | $3,400 | 1B | $6,800 |
| 5 | Brad Miller | LEFT | 0.298 | 0.325 | 0.136 | 37.6% | 16.9% | 26.8% | 47.6% | 1B | $2,700 | 2B | $3,200 | 2B | $6,500 |
| 6 | Wilson Ramos | RIGHT | 0.299 | 0.328 | 0.188 | 31.8% | 4.7% | 17.6% | 52.0% | C | $2,300 | C | $2,900 | C | $5,400 |
| 7 | Mallex Smith | LEFT | 0.315 | 0.267 | 0.095 | 21.7% | 9.3% | 18.5% | 48.9% | OF | $3,300 | OF | $3,200 | CF | $6,300 |
| 8 | Daniel Robertson | RIGHT | 0.288 | 0.296 | 0.095 | 28.8% | 11.7% | 26.9% | 50.9% | 3B | $2,900 | 2B/SS | $3,100 | 2B | $5,500 |
| 9 | Adeiny Hechavarria | RIGHT | 0.274 | 0.293 | 0.112 | 35.3% | 3.3% | 19.0% | 49.8% | SS | $2,500 | SS | $2,800 | SS | $5,700 |