MLB Grind Down: Monday, June 25th

Jump to Page 1 2 3
The RotoGrinders MLB Grind Down will give you an in-depth analysis into the upcoming MLB schedule. This article will break down the numbers for every single game and give you analysis on which trends you can exploit. While matchups are a major factor in daily fantasy baseball, there are plenty of other factors to consider such as injuries, weather, and salaries.
The analysis should point you in the right direction, but it is still up to you to decipher the information and make your own selections. No sport has more variance than baseball. The best choice is not always the right choice but following the trends will win you money over time.
Note: As always, if you want to try a new DFS site, be sure to click through a RotoGrinders link and use our DraftKings promo code, FanDuel promo code, and FantasyDraft promo code to receive the best perks in the industry.

Stackability Rating System:
GREEN – A viable full stack in cash games and GPPs.
YELLOW – A viable mini-stack in cash games and full stack in GPPs.
ORANGE – A viable stack in large field GPPs.
RED – Not a recommended stack for cash games or GPPs.
Implied Run Totals
Ballpark Ratings
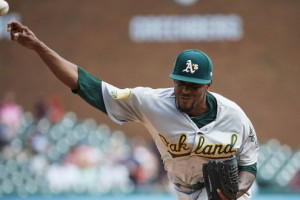
Oakland at Detroit – 3:10 PM ET
| Oakland | Detroit | ||||||||||||||
 | Edwin Jackson |  | Jordan Zimmermann | ||||||||||||
| RIGHT | RIGHT | ||||||||||||||
| Vegas Moneyline | Vegas Over/Under | ||||||||||||||
| DET-105 | 9.5 | ||||||||||||||
| Stats | wOBA | xwOBA | HC% | BB% | K% | GB% | Stats | wOBA | xwOBA | HC% | BB% | K% | GB% | ||
|---|---|---|---|---|---|---|---|---|---|---|---|---|---|---|---|
| SP vs. Left (2016-17) | SP vs. Left (2016-17) | 0.290 | 0.310 | 30.9% | 7.5% | 23.8% | 30.9% | ||||||||
| SP vs. Right (2016-17) | SP vs. Right (2016-17) | 0.331 | 0.387 | 42.6% | 4.1% | 23.0% | 25.9% | ||||||||
Pitcher Grind Down
| Edwin Jackson | |||||||||
 | FanDuel | DraftKings | FantasyDraft | ||||||
| Salary: | Salary: | Salary: | |||||||
| Salary Rank: | of 22 | Salary Rank: | of 22 | Salary Rank: | |||||
| Stats | Starts | SIERA | ERA | K% | BB% | GB% | HC% | SC% | |
|---|---|---|---|---|---|---|---|---|---|
| 2017 | 13 | 5.03 | 5.21 | 17.7% | 8.6% | 37.0% | 30.8% | 22.4% | |
There are two early games on the schedule, which should provide some daytime entertainment. Jackson will be making his first start of the season and his first as a member of the A’s. This is actually his 13th major league ball club, so he’s nearly played for half of the teams in baseball. In 13 starts last year, he posted a 5.03 SIERA with a strikeout rate of 18%. His numbers in the minors were mediocre at best before being called up and today’s game against the Tigers is set as a pick ‘em with an over/under of 9.5 runs.
Quick Breakdown: Even though there are only two games in the early slate, Jackson is an easy fade.
| Jordan Zimmermann | |||||||||
 | FanDuel | DraftKings | FantasyDraft | ||||||
| Salary: | $7,200 | Salary: | Salary: | ||||||
| Salary Rank: | 13 of 22 | Salary Rank: | of 22 | Salary Rank: | |||||
| Stats | Starts | SIERA | ERA | K% | BB% | GB% | HC% | SC% | |
|---|---|---|---|---|---|---|---|---|---|
| 2017 | 29 | 5.22 | 6.08 | 14.5% | 6.2% | 33.2% | 39.5% | 13.4% | |
| 2018 | 8 | 3.90 | 4.95 | 23.4% | 5.8% | 28.4% | 36.7% | 21.1% | |
| L14 | 1 | 3.47 | 5.40 | 21.1% | 0.0% | 33.3% | 13.3% | 20.0% | |
Zimmermann has an ERA close to five, but his advanced numbers are much better than they were a year ago. In his eight starts this season, he has a 3.90 SIERA with a strikeout rate of 23% and a walk rate of 6%. The fact that his hard contact rate is 8% higher than his ground ball rate is far from ideal, but we are working with very few options in the early two-game slate. The A’s have plenty of firepower in their lineup, but also have a 23% strikeout rate against right-handed pitching.
Quick Breakdown: Zimmermann is viable if you are playing the two-game early slate on a multi-pitcher DFS site.
Batter Grind Down
Oakland
Jordan Zimmermann is viable on multi-pitcher sites, but that has more to do with the other pitchers in the slate than it does with his matchup against the A’s. This offense is potent, they see a favorable ballpark shift playing in Detroit, and their lineup was built to hit fly balls. On the season, Zimmermann has allowed a .387 xwOBA and a 43% hard contact rate to right-handed hitters. He’s been tough on lefties, but that could be thanks to a small sample size. Khris Davis (.448 xwOBA against righties) is the top play here, but Dustin Fowler, Matt Joyce, Jed Lowrie, and Matt Olson are also viable.
Projected Lineup (Splits vs. RH Pitching)
| # | Player | Bats | xwOBA | L15 | ISO | HC% | BB% | K% | GB% | FD Pos. | FD Sal. | DK Pos. | DK Sal. | FDRFT Pos. | FDRFT Sal. |
|---|---|---|---|---|---|---|---|---|---|---|---|---|---|---|---|
| 1 | Dustin Fowler | LEFT | 0.339 | 0.309 | 0.152 | 46.9% | 5.6% | 17.8% | 44.4% | OF | $2,500 | N/A | N/A | ||
| 2 | Matt Joyce | LEFT | 0.329 | 0.357 | 0.161 | 33.3% | 14.2% | 23.5% | 31.6% | OF | $2,600 | N/A | N/A | ||
| 3 | Jed Lowrie | SWITCH | 0.338 | 0.254 | 0.224 | 35.6% | 9.5% | 22.3% | 37.2% | 3B | $3,500 | N/A | N/A | ||
| 4 | Khris Davis | RIGHT | 0.448 | 0.437 | 0.303 | 49.6% | 7.6% | 24.8% | 34.3% | OF | $3,900 | N/A | N/A | ||
| 5 | Matt Olson | LEFT | 0.420 | 0.367 | 0.269 | 55.1% | 10.4% | 28.0% | 33.1% | 1B | $3,400 | N/A | N/A | ||
| 6 | Stephen Piscotty | RIGHT | 0.358 | 0.362 | 0.159 | 45.5% | 7.4% | 21.1% | 43.9% | OF | $2,800 | N/A | N/A | ||
| 7 | Marcus Semien | RIGHT | 0.306 | 0.316 | 0.092 | 27.6% | 8.0% | 18.6% | 43.1% | SS | $3,300 | N/A | N/A | ||
| 8 | Jonathan Lucroy | RIGHT | 0.328 | 0.376 | 0.100 | 44.5% | 6.5% | 14.9% | 45.8% | C | $2,300 | N/A | N/A | ||
| 9 | Franklin Barreto | RIGHT | 0.154 | 0.315 | 0.214 | 33.3% | 0.0% | 35.7% | 25.0% | 2B | $2,400 | N/A | N/A | ||
| Team Averages | 0.336 | 0.344 | 0.186 | 41.3% | 7.7% | 23.0% | 37.6% |
Elite Plays – Khris Davis
Secondary Plays – Dustin Fowler, Matt Joyce, Jed Lowrie, Matt Olson
Stackability – YELLOW
Detroit
The Tigers aren’t exactly world beaters offensively, but they draw an exploitable matchup against Edwin Jackson, who struggled in the majors last season and who was average at best in the minors earlier this season. If we look at his splits from 2017, Jackson allowed a .344 wOBA to lefties and a .336 wOBA to righties. The bottom of the Tigers’ order should be avoided, but each of the first four batters are viable thanks to their numbers against right-handed pitching — Leonys Martin (.424 xwOBA), Niko Goodrum (.338 xwOBA), Nick Castellanos (.368 xwOBA), and Victor Martinez (.350 xwOBA).
Projected Lineup (Splits vs. RH Pitching)
| # | Player | Bats | xwOBA | L15 | ISO | HC% | BB% | K% | GB% | FD Pos. | FD Sal. | DK Pos. | DK Sal. | FDRFT Pos. | FDRFT Sal. |
|---|---|---|---|---|---|---|---|---|---|---|---|---|---|---|---|
| 1 | Leonys Martin | LEFT | 0.424 | 0.357 | 0.191 | 42.4% | 10.8% | 21.1% | 35.5% | OF | $3,000 | N/A | N/A | ||
| 2 | Niko Goodrum | SWITCH | 0.338 | 0.289 | 0.234 | 34.5% | 10.2% | 31.3% | 41.7% | OF | $2,700 | N/A | N/A | ||
| 3 | Nick Castellanos | RIGHT | 0.368 | 0.344 | 0.187 | 48.3% | 4.9% | 23.7% | 33.7% | OF | $2,800 | N/A | N/A | ||
| 4 | Victor Martinez | SWITCH | 0.350 | 0.317 | 0.086 | 42.0% | 7.8% | 10.4% | 39.5% | C | $2,100 | N/A | N/A | ||
| 5 | John Hicks | RIGHT | 0.291 | 0.310 | 0.153 | 43.5% | 3.5% | 31.7% | 38.9% | C | $2,100 | N/A | N/A | ||
| 6 | JaCoby Jones | RIGHT | 0.301 | 0.246 | 0.168 | 31.7% | 3.8% | 28.0% | 42.1% | OF | $2,500 | N/A | N/A | ||
| 7 | Grayson Greiner | RIGHT | 0.330 | 0.219 | 0.097 | 28.6% | 11.4% | 28.6% | 42.9% | C | $2,200 | N/A | N/A | ||
| 8 | Jose Iglesias | RIGHT | 0.279 | 0.322 | 0.100 | 24.9% | 4.0% | 12.0% | 45.1% | SS | $2,400 | N/A | N/A | ||
| 9 | Dixon Machado | RIGHT | 0.296 | 0.223 | 0.067 | 29.6% | 6.7% | 18.4% | 43.2% | 2B | $2,000 | N/A | N/A | ||
| Team Averages | 0.331 | 0.292 | 0.143 | 36.2% | 7.0% | 22.8% | 40.3% |
Elite Plays – Leonys Martin, Nick Castellanos
Secondary Plays – Niko Goodrum, Victor Martinez
Stackability – YELLOW
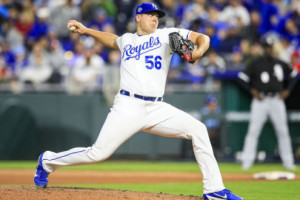
LA Angels at Kansas City – 4:15 PM ET
| LA Angels | Kansas City | ||||||||||||||
 | Tyler Skaggs |  | Brad Keller | ||||||||||||
| LEFT | RIGHT | ||||||||||||||
| Vegas Moneyline | Vegas Over/Under | ||||||||||||||
| LAA-150 | 9.0 | ||||||||||||||
| Stats | wOBA | xwOBA | HC% | BB% | K% | GB% | Stats | wOBA | xwOBA | HC% | BB% | K% | GB% | ||
|---|---|---|---|---|---|---|---|---|---|---|---|---|---|---|---|
| SP vs. Left (2016-17) | 0.204 | 0.274 | 34.5% | 2.3% | 30.2% | 50.9% | SP vs. Left (2016-17) | 0.249 | 0.307 | 29.6% | 13.3% | 11.7% | 58.1% | ||
| SP vs. Right (2016-17) | 0.331 | 0.314 | 37.3% | 8.9% | 24.4% | 46.3% | SP vs. Right (2016-17) | 0.306 | 0.326 | 37.2% | 7.2% | 15.3% | 55.8% | ||
Pitcher Grind Down
| Tyler Skaggs | |||||||||
 | FanDuel | DraftKings | FantasyDraft | ||||||
| Salary: | $9,300 | Salary: | Salary: | ||||||
| Salary Rank: | 3 of 22 | Salary Rank: | of 22 | Salary Rank: | |||||
| Stats | Starts | SIERA | ERA | K% | BB% | GB% | HC% | SC% | |
|---|---|---|---|---|---|---|---|---|---|
| 2017 | 16 | 4.44 | 4.55 | 20.8% | 7.7% | 41.8% | 32.2% | 20.8% | |
| 2018 | 14 | 3.51 | 2.81 | 25.9% | 7.2% | 47.5% | 36.5% | 12.3% | |
| L14 | 1 | 2.47 | 0.00 | 29.6% | 3.7% | 50.0% | 38.9% | 22.2% | |
Skaggs is the easy SP1 choice for the early slate. In 14 starts this season, he has a 3.51 SIERA with a strikeout rate of 26% and a walk rate of 7%. He gives up a lot of hard contact, but his high strikeout rate more than makes up for it. He draws a favorable matchup against the Royals, whose projected lineup has an xwOBA under .300 with a strikeout rate of 25%. The other advantage of facing the Royals is that they swing at pitches early in the count. Against southpaws this season, Kansas City averages the fourth fewest pitches per plate appearance. Skaggs not only has strikeout upside, but he could end up pitching deep into this game.
Quick Breakdown: Skaggs is an elite play in all formats.
| Brad Keller | |||||||||
 | FanDuel | DraftKings | FantasyDraft | ||||||
| Salary: | $5,500 | Salary: | Salary: | ||||||
| Salary Rank: | 22 of 22 | Salary Rank: | of 22 | Salary Rank: | |||||
| Stats | Starts | SIERA | ERA | K% | BB% | GB% | HC% | SC% | |
|---|---|---|---|---|---|---|---|---|---|
| 2018 | 4 | 4.53 | 2.63 | 14.0% | 9.4% | 56.6% | 34.6% | 17.7% | |
| L14 | 2 | 6.09 | 3.97 | 9.8% | 13.7% | 48.6% | 47.4% | 13.2% | |
Keller is making his 26th appearance of the season, but 21 of those were as a reliever. While he is close to being stretched out (83 and 85 pitches in his last two starts), he doesn’t offer much of a floor or a ceiling. He currently owns a 4.53 SIERA with a strikeout rate of only 14%. The issue with a low strikeout rate is that it places an emphasis on limiting mistakes. In order for Keller to reach value with such a low k-rate, he needs to pitch deep into games and prevent earned runs. Those aren’t two of his best attributes. It doesn’t help that he’s facing an Angels’ offense that has a .323 xwOBA and a 19% strikeout rate against right-handed pitching.
Quick Breakdown: Avoid Keller in both cash games and tournaments.
Batter Grind Down
LA Angels
The Angels have the highest implied run total of the four teams in the early slate. Even though Kauffman Stadium is a large ballpark, it is very humid today in Kansas City and we have a helping wind blowing out to left field. Brad Keller has a low strikeout rate and a high hard contact rate, which bodes well for the Angels’ offense as a whole. We are dealing with a small sample size here, but Keller has allowed a .328 xwOBA and a 37% hard contact rate to right-handed hitters. Ian Kinsler, (.336 xwOBA), Mike Trout (.464 xwOBA), Justin Upton (.392 xwOBA), and Albert Pujols (.355 xwOBA) all bat from the right side and all hit right-handed pitching well.
Projected Lineup (Splits vs. RH Pitching)
| # | Player | Bats | xwOBA | L15 | ISO | HC% | BB% | K% | GB% | FD Pos. | FD Sal. | DK Pos. | DK Sal. | FDRFT Pos. | FDRFT Sal. |
|---|---|---|---|---|---|---|---|---|---|---|---|---|---|---|---|
| 1 | Ian Kinsler | RIGHT | 0.336 | 0.348 | 0.202 | 33.9% | 9.0% | 9.0% | 37.4% | 2B | $2,900 | N/A | N/A | ||
| 2 | Mike Trout | RIGHT | 0.464 | 0.427 | 0.329 | 47.9% | 20.1% | 19.0% | 32.5% | OF | $5,200 | N/A | N/A | ||
| 3 | Justin Upton | RIGHT | 0.392 | 0.415 | 0.229 | 47.1% | 11.5% | 27.1% | 42.0% | OF | $3,900 | N/A | N/A | ||
| 4 | Albert Pujols | RIGHT | 0.355 | 0.420 | 0.181 | 40.6% | 4.2% | 14.3% | 39.6% | 1B | $3,000 | N/A | N/A | ||
| 5 | Luis Valbuena | LEFT | 0.296 | 0.337 | 0.156 | 41.2% | 5.9% | 32.8% | 37.5% | 3B | $2,900 | N/A | N/A | ||
| 6 | Andrelton Simmons | RIGHT | 0.363 | 0.233 | 0.129 | 38.4% | 6.2% | 4.1% | 47.0% | SS | $2,900 | N/A | N/A | ||
| 7 | Kole Calhoun | LEFT | 0.271 | 0.372 | 0.078 | 34.2% | 5.5% | 24.5% | 52.6% | OF | $2,700 | N/A | N/A | ||
| 8 | Martin Maldonado | RIGHT | 0.266 | 0.262 | 0.102 | 29.1% | 4.4% | 23.1% | 36.7% | C | $2,100 | N/A | N/A | ||
| 9 | Michael Hermosillo | RIGHT | 0.168 | 0.128 | 0.000 | 26.3% | 0.0% | 13.6% | 72.2% | OF | $2,000 | N/A | N/A | ||
| Team Averages | 0.323 | 0.327 | 0.156 | 37.6% | 7.4% | 18.6% | 44.2% |
Elite Plays – Ian Kinsler, Mike Trout, Justin Upton, Albert Pujols
Secondary Plays – Luis Valbuena, Andrelton Simmons
Stackability – YELLOW / GREEN
Kansas City
For whatever reason, games in Kansas City always seem to have a higher total than we expect. Since the Royals play their home games here, their implied run totals often seem inflated. They might have a run projection over four today, but draw the worst matchup of the early slate. In addition to having an elite strikeout rate, Tyler Skaggs has held both left and right-handed hitters under a .315 xwOBA. Outside of a Whit Merrifield (.421 xwOBA against lefties) one-off in tournaments, the Royals should be avoided.
Projected Lineup (Splits vs. LH Pitching)
| # | Player | Bats | xwOBA | L15 | ISO | HC% | BB% | K% | GB% | FD Pos. | FD Sal. | DK Pos. | DK Sal. | FDRFT Pos. | FDRFT Sal. |
|---|---|---|---|---|---|---|---|---|---|---|---|---|---|---|---|
| 1 | Whit Merrifield | RIGHT | 0.421 | 0.302 | 0.242 | 45.5% | 7.1% | 14.3% | 31.2% | 2B | $2,800 | N/A | N/A | ||
| 2 | Rosell Herrera | SWITCH | 0.325 | 0.294 | 0.111 | 50.0% | 0.0% | 11.1% | 62.5% | OF | $2,100 | N/A | N/A | ||
| 3 | Salvador Perez | RIGHT | 0.326 | 0.312 | 0.250 | 37.5% | 7.0% | 22.8% | 35.0% | C | $2,600 | N/A | N/A | ||
| 4 | Hunter Dozier | RIGHT | 0.342 | 0.215 | 0.069 | 33.3% | 9.4% | 25.0% | 33.3% | 1B | $2,400 | N/A | N/A | ||
| 5 | Lucas Duda | LEFT | 0.301 | 0.232 | 0.071 | 20.0% | 2.2% | 26.7% | 33.3% | 1B | $2,600 | N/A | N/A | ||
| 6 | Alcides Escobar | RIGHT | 0.308 | 0.246 | 0.167 | 30.2% | 5.4% | 18.9% | 44.2% | SS | $2,100 | N/A | N/A | ||
| 7 | Alex Gordon | LEFT | 0.286 | 0.466 | 0.000 | 31.0% | 11.1% | 20.6% | 69.0% | OF | $2,400 | N/A | N/A | ||
| 8 | Abraham Almonte | SWITCH | 0.282 | 0.268 | 0.083 | 28.6% | 9.8% | 22.0% | 66.7% | OF | $2,000 | N/A | N/A | ||
| 9 | Adalberto Mondesi | RIGHT | 0.082 | 0.333 | 0.000 | 0.0% | 0.0% | 66.7% | 100.0% | SS | $2,200 | N/A | N/A | ||
| Team Averages | 0.297 | 0.296 | 0.110 | 30.7% | 5.8% | 25.3% | 52.8% |
Elite Plays – Whit Merrifield (GPP)
Secondary Plays – Whit Merrifield (Cash)
Stackability – ORANGE
NY Yankees at Philadelphia – 7:05 PM ET
| NY Yankees | Philadelphia | ||||||||||||||
 | Jonathan Loaisiga |  | Vince Velasquez | ||||||||||||
| RIGHT | RIGHT | ||||||||||||||
| Vegas Moneyline | Vegas Over/Under | ||||||||||||||
| NYY-135 | 8.5 | ||||||||||||||
| Stats | wOBA | xwOBA | HC% | BB% | K% | GB% | Stats | wOBA | xwOBA | HC% | BB% | K% | GB% | ||
|---|---|---|---|---|---|---|---|---|---|---|---|---|---|---|---|
| SP vs. Left (2016-17) | 0.338 | 0.244 | 16.7% | 20.0% | 40.0% | 66.7% | SP vs. Left (2016-17) | 0.363 | 0.308 | 33.9% | 8.7% | 27.8% | 37.0% | ||
| SP vs. Right (2016-17) | 0.319 | 0.423 | 56.3% | 13.0% | 17.4% | 50.0% | SP vs. Right (2016-17) | 0.275 | 0.281 | 31.7% | 8.3% | 29.2% | 40.8% | ||
Pitcher Grind Down
| Jonathan Loaisiga | |||||||||
 | FanDuel | DraftKings | FantasyDraft | ||||||
| Salary: | $6,400 | Salary: | $7,300 | Salary: | $14,400 | ||||
| Salary Rank: | 17 of 22 | Salary Rank: | 11 of 22 | Salary Rank: | 11 of 22 | ||||
| Stats | Starts | SIERA | ERA | K% | BB% | GB% | HC% | SC% | |
|---|---|---|---|---|---|---|---|---|---|
| 2018 | 2 | 4.36 | 3.12 | 26.3% | 15.8% | 54.5% | 45.5% | 9.1% | |
| L14 | 2 | 4.38 | 3.12 | 26.3% | 15.8% | 54.5% | 45.5% | 9.1% | |
We kick off tonight’s ten-game slate with the Yankees and Phillies. Loaisiga pitched well in his major league debut, but was knocked around by the Mariners in his last start. There are certainly some encouraging signs here (26% strikeout rate with a 55% ground ball rate), but he’s still unproven at the major league level. This will be his first career start on the road and it comes in a home run-friendly ballpark against an offense that has been heating up (.353 xwOBA over the last 15 days). The range of outcomes for Loaisiga is broad, but I have more interest in the Phillies’ offense.
Quick Breakdown: Loaisiga is viable in large-field tournaments, but I will take my chances elsewhere.
| Vince Velasquez | |||||||||
 | FanDuel | DraftKings | FantasyDraft | ||||||
| Salary: | $8,100 | Salary: | $6,600 | Salary: | $12,700 | ||||
| Salary Rank: | 10 of 22 | Salary Rank: | 15 of 22 | Salary Rank: | 16 of 22 | ||||
| Stats | Starts | SIERA | ERA | K% | BB% | GB% | HC% | SC% | |
|---|---|---|---|---|---|---|---|---|---|
| 2017 | 15 | 4.73 | 5.13 | 21.6% | 10.8% | 42.5% | 38.1% | 15.2% | |
| 2018 | 15 | 3.49 | 4.82 | 28.5% | 8.5% | 38.8% | 32.9% | 16.4% | |
| L14 | 2 | 3.67 | 4.15 | 29.2% | 10.4% | 35.7% | 39.3% | 21.4% | |
Velasquez has an ERA close to five, but his peripheral numbers suggest some positive regression. He currently owns a 3.49 SIERA with a strikeout rate of 29%. Those two numbers alone are appealing, but he does have a high fly-ball rate with a relatively high hard contact rate. He draws a difficult matchup against the Yankees, whose projected lineup has a .351 xwOBA against right-handed pitching this season. Velasquez also has a wide range of potential outcomes here, but at least we know what he brings to the table.
Quick Breakdown: Velasquez is viable in large-field tournaments, despite the tough matchup against the Yankees.
Batter Grind Down
NY Yankees
The Yankees are playing in a home run-friendly ballpark, but lose the use of the DH in this series. Their matchup against Vince Velasquez isn’t great, despite the fact that his ERA is close to five on the season. He has held both left and right-handed hitters under a .310 xwOBA and under a 34% hard contact rate. The best way to beat the Yankees is with a high-strikeout pitcher and Velasquez certainly fits the mold. While I won’t be using a full Yankees’ stack, Aaron Judge (.409 xwOBA), Didi Gregorius (.356 xwOBA), and Miguel Andujar (.364 xwOBA) all hit right-handed pitching well.
Projected Lineup (Splits vs. RH Pitching)
| # | Player | Bats | xwOBA | L15 | ISO | HC% | BB% | K% | GB% | FD Pos. | FD Sal. | DK Pos. | DK Sal. | FDRFT Pos. | FDRFT Sal. |
|---|---|---|---|---|---|---|---|---|---|---|---|---|---|---|---|
| 1 | Brett Gardner | LEFT | 0.310 | 0.323 | 0.157 | 31.8% | 11.9% | 16.4% | 49.3% | OF | $2,900 | OF | $3,800 | LF | $7,200 |
| 2 | Aaron Judge | RIGHT | 0.409 | 0.386 | 0.301 | 48.8% | 14.9% | 29.8% | 46.5% | OF | $4,500 | OF | $5,300 | RF | $10,000 |
| 3 | Didi Gregorius | LEFT | 0.356 | 0.354 | 0.258 | 41.2% | 9.7% | 13.4% | 32.9% | SS | $3,800 | SS | $4,400 | SS | $8,100 |
| 4 | Giancarlo Stanton | RIGHT | 0.298 | 0.305 | 0.171 | 34.1% | 8.4% | 33.6% | 53.8% | OF | $4,200 | OF | $5,000 | RF | $10,000 |
| 5 | Miguel Andujar | RIGHT | 0.364 | 0.263 | 0.208 | 36.3% | 3.2% | 17.8% | 50.7% | 3B | $3,500 | 3B | $4,000 | 3B | $7,300 |
| 6 | Greg Bird | LEFT | 0.281 | 0.283 | 0.246 | 37.5% | 5.4% | 28.4% | 43.8% | 1B | $2,400 | 1B | $3,700 | 1B | $7,400 |
| 7 | Austin Romine | RIGHT | 0.389 | 0.301 | 0.214 | 35.6% | 13.6% | 18.2% | 42.2% | C | $2,500 | C | $3,600 | C | $7,700 |
| 8 | Jonathan Loaisiga | RIGHT | P | $6,400 | P | $7,300 | P | $14,400 | |||||||
| 9 | Gleyber Torres | RIGHT | 0.398 | 0.357 | 0.258 | 39.0% | 6.2% | 26.7% | 29.8% | 2B | $4,000 | 2B | $4,200 | 2B | $8,500 |
| Team Averages | 0.351 | 0.322 | 0.227 | 38.0% | 9.2% | 23.0% | 43.6% |
Elite Plays – Aaron Judge (GPP), Didi Gregorius (GPP)
Secondary Plays – Aaron Judge (Cash), Didi Gregorius (Cash), Brett Gardner, Miguel Andujar, Greg Bird
Stackability – ORANGE / YELLOW
Philadelphia
The Phillies aren’t an offense that we should load up on in cash games, but they certainly provide a high ceiling for tournaments. They are playing at home in a hitter-friendly ballpark and they are facing a rookie pitcher that is making his first career start on the road. The high strikeout rate of the Phillies could lead to a nice outing for Jonathan Loaisiga, but his inexperience could lead to a big outing for the Phillies’ offense. Cesar Hernandez (.334 xwOBA), Rhys Hoskins (.395 xwOBA), Odubel Herrera (.333 xwOBA), Carlos Santana (.387 xwOBA), and Nick Williams (.387 xwOBA) all hit right-handed pitching well and are all viable in tournaments.
Projected Lineup (Splits vs. RH Pitching)
| # | Player | Bats | xwOBA | L15 | ISO | HC% | BB% | K% | GB% | FD Pos. | FD Sal. | DK Pos. | DK Sal. | FDRFT Pos. | FDRFT Sal. |
|---|---|---|---|---|---|---|---|---|---|---|---|---|---|---|---|
| 1 | Cesar Hernandez | SWITCH | 0.334 | 0.321 | 0.150 | 26.3% | 14.1% | 22.8% | 44.2% | 2B | $3,700 | 2B | $4,700 | 2B | $9,400 |
| 2 | Rhys Hoskins | RIGHT | 0.395 | 0.419 | 0.231 | 34.8% | 13.7% | 27.8% | 28.0% | OF | $4,000 | OF | $5,000 | IF/OF | $10,100 |
| 3 | Odubel Herrera | LEFT | 0.333 | 0.357 | 0.206 | 27.9% | 7.8% | 19.6% | 43.9% | OF | $3,800 | OF | $5,100 | IF/OF | $10,100 |
| 4 | Carlos Santana | SWITCH | 0.387 | 0.354 | 0.237 | 36.4% | 19.8% | 13.7% | 36.7% | 1B | $3,700 | 1B | $4,600 | 1B | $9,400 |
| 5 | Nick Williams | LEFT | 0.387 | 0.377 | 0.237 | 33.0% | 8.6% | 23.2% | 47.0% | OF | $2,300 | OF | $3,300 | RF | $6,700 |
| 6 | Scott Kingery | RIGHT | 0.307 | 0.314 | 0.114 | 28.1% | 6.6% | 22.4% | 38.9% | SS | $2,400 | SS | $3,000 | SS | $5,600 |
| 7 | Maikel Franco | RIGHT | 0.313 | 0.354 | 0.162 | 22.8% | 4.5% | 16.7% | 55.3% | 3B | $2,700 | 3B | $3,300 | 3B | $6,400 |
| 8 | Jorge Alfaro | RIGHT | 0.261 | 0.216 | 0.131 | 29.0% | 3.6% | 39.1% | 55.3% | C | $2,400 | C | $2,900 | C | $5,600 |
| 9 | Vince Velasquez | RIGHT | 0.212 | 0.463 | 0.000 | 20.0% | 0.0% | 25.0% | 91.7% | P | $8,100 | P | $6,600 | P | $12,700 |
| Team Averages | 0.325 | 0.353 | 0.163 | 28.7% | 8.7% | 23.4% | 49.0% |
Elite Plays – Rhys Hoskins, Cesar Hernandez (GPP), Carlos Santana (GPP)
Secondary Plays – Cesar Hernandez (Cash), Carlos Santana (Cash), Odubel Herrera, Nick Williams
Stackability – YELLOW
Seattle at Baltimore – 7:05 PM ET
| Seattle | Baltimore | ||||||||||||||
 | Felix Hernandez |  | Andrew Cashner | ||||||||||||
| RIGHT | RIGHT | ||||||||||||||
| Vegas Moneyline | Vegas Over/Under | ||||||||||||||
| SEA-110 | 9.5 | ||||||||||||||
| Stats | wOBA | xwOBA | HC% | BB% | K% | GB% | Stats | wOBA | xwOBA | HC% | BB% | K% | GB% | ||
|---|---|---|---|---|---|---|---|---|---|---|---|---|---|---|---|
| SP vs. Left (2016-17) | 0.338 | 0.392 | 37.0% | 10.3% | 20.7% | 39.3% | SP vs. Left (2016-17) | 0.358 | 0.360 | 26.8% | 10.1% | 23.7% | 35.5% | ||
| SP vs. Right (2016-17) | 0.335 | 0.337 | 40.7% | 6.5% | 18.4% | 49.7% | SP vs. Right (2016-17) | 0.405 | 0.403 | 33.9% | 9.9% | 14.0% | 43.0% | ||
Pitcher Grind Down
| Felix Hernandez | |||||||||
 | FanDuel | DraftKings | FantasyDraft | ||||||
| Salary: | $7,500 | Salary: | $7,000 | Salary: | $13,900 | ||||
| Salary Rank: | 12 of 22 | Salary Rank: | 13 of 22 | Salary Rank: | 12 of 22 | ||||
| Stats | Starts | SIERA | ERA | K% | BB% | GB% | HC% | SC% | |
|---|---|---|---|---|---|---|---|---|---|
| 2017 | 16 | 4.19 | 4.36 | 21.2% | 7.1% | 46.9% | 30.7% | 19.1% | |
| 2018 | 16 | 4.36 | 5.14 | 19.4% | 8.2% | 45.1% | 39.1% | 17.2% | |
| L14 | 2 | 3.00 | 1.50 | 24.5% | 4.1% | 51.4% | 40.0% | 14.3% | |
King Felix has pitched well in three of his last four starts and now gets to face a right-handed heavy Orioles’ offense that has a high strikeout rate against right-handed pitching this season. Is that enough to overcome his low k-rate and the fact that he’s pitching on the road in a hitter-friendly ballpark? Well, that’s up to you to decide. Hernandez certainly has some upside, as the Orioles’ projected lineup has a .311 xwOBA with a strikeout rate of 28% against righties.
Quick Breakdown: Hernandez has a low floor (fade in cash games), but his ceiling in this matchup warrants consideration in tournaments.
| Andrew Cashner | |||||||||
 | FanDuel | DraftKings | FantasyDraft | ||||||
| Salary: | $6,200 | Salary: | $4,600 | Salary: | $9,200 | ||||
| Salary Rank: | 18 of 22 | Salary Rank: | 18 of 22 | Salary Rank: | 18 of 22 | ||||
| Stats | Starts | SIERA | ERA | K% | BB% | GB% | HC% | SC% | |
|---|---|---|---|---|---|---|---|---|---|
| 2017 | 28 | 5.52 | 3.40 | 12.2% | 9.1% | 48.6% | 28.4% | 18.5% | |
| 2018 | 14 | 4.75 | 4.72 | 18.8% | 10.0% | 39.5% | 30.6% | 16.9% | |
| L14 | 1 | 3.12 | 0.00 | 14.3% | 0.0% | 50.0% | 0.0% | 33.3% | |
Cashner’s biggest strength last season was his high ground ball rate (especially against right-handed hitters). He was never a pitcher to target in DFS, but stacks rarely worked against him. Times have changed in 2018, as his ground ball rate is below 40%. He has a high SIERA (4.75), a low strikeout rate (19%), and a high walk rate (10%). He’s pitching in a hitter-friendly ballpark and he draws one of the worst matchups of the slate. The Mariners’ projected lineup has a .351 xwOBA with a strikeout rate of only 21% against right-handed pitching.
Quick Breakdown: Fire up Cashner in low-ball formats and fire up a Mariners’ stack in normal tournaments.
Batter Grind Down
Seattle
The Mariners see a favorable ballpark boost playing in Camden Yards and draw one of the best matchups of the slate. In addition to having a high fly-ball rate and a low strikeout rate, Andrew Cashner has allowed a .360 xwOBA to lefties and a .403 xwOBA to righties this season. Dee Gordon doesn’t offer much upside in terms of extra-base hits, but he brings stolen base upside to the table and is cheap across the industry. I always give him a boost when he’s facing a pitcher with a high walk rate. Jean Segura (if active), Mitch Haniger, Nelson Cruz, and Kyle Seager are all borderline elite plays at their respective positions.
Projected Lineup (Splits vs. RH Pitching)
| # | Player | Bats | xwOBA | L15 | ISO | HC% | BB% | K% | GB% | FD Pos. | FD Sal. | DK Pos. | DK Sal. | FDRFT Pos. | FDRFT Sal. |
|---|---|---|---|---|---|---|---|---|---|---|---|---|---|---|---|
| 1 | Dee Gordon | LEFT | 0.276 | 0.254 | 0.069 | 17.9% | 2.0% | 16.0% | 54.0% | 2B | $2,900 | 2B/OF | $4,300 | IF/OF | $8,200 |
| 2 | Jean Segura | RIGHT | 0.330 | 0.283 | 0.144 | 30.2% | 3.6% | 13.6% | 55.2% | SS | $3,700 | SS | $4,900 | SS | $9,300 |
| 3 | Mitch Haniger | RIGHT | 0.412 | 0.344 | 0.251 | 41.0% | 12.2% | 23.6% | 41.0% | OF | $3,400 | OF | $4,900 | RF | $9,000 |
| 4 | Nelson Cruz | RIGHT | 0.411 | 0.574 | 0.254 | 39.3% | 6.7% | 19.7% | 43.7% | OF | $3,900 | OF | $5,200 | RF | $9,800 |
| 5 | Kyle Seager | LEFT | 0.337 | 0.323 | 0.202 | 40.7% | 6.2% | 20.4% | 35.5% | 3B | $2,900 | 3B | $4,100 | 3B | $8,300 |
| 6 | Ryon Healy | RIGHT | 0.372 | 0.396 | 0.222 | 41.3% | 3.6% | 21.3% | 41.6% | 1B | $2,800 | 1B | $4,100 | 1B | $8,200 |
| 7 | Denard Span | LEFT | 0.353 | 0.306 | 0.163 | 34.8% | 13.4% | 13.9% | 39.7% | OF | $2,600 | OF | $4,000 | CF | $7,700 |
| 8 | Mike Zunino | RIGHT | 0.340 | 0.276 | 0.256 | 43.2% | 3.7% | 37.8% | 40.5% | C | $2,300 | C | $3,400 | C | $6,600 |
| 9 | Guillermo Heredia | SWITCH | 0.330 | 0.202 | 0.112 | 27.4% | 12.8% | 18.3% | 44.9% | OF | $2,000 | OF | $2,800 | CF | $5,800 |
| Team Averages | 0.351 | 0.329 | 0.186 | 35.1% | 7.1% | 20.5% | 44.0% |
Elite Plays – Dee Gordon, Mitch Haniger, Nelson Cruz, Kyle Seager (FD)
Secondary Plays – Kyle Seager (DK), Jean Segura, Ryon Healy
Stackability – GREEN
Baltimore
The Orioles have an exploitable matchup against Felix Hernandez, but don’t quite have the right set of exploitees (and yes, I made the word up). On the season, Hernandez has held right-handed hitters to a .335 xwOBA on a 50% ground ball rate. The Orioles are projected to have six righties in their lineup tonight and we can rule all of them out with the exception of Manny Machado, who owns a .385 xwOBA and a .267 ISO against right-handed pitching. Jace Peterson, Chris Davis, and Colby Rasmus are the top targets here, but they are better tournament plays than core targets.
Projected Lineup (Splits vs. RH Pitching)
| # | Player | Bats | xwOBA | L15 | ISO | HC% | BB% | K% | GB% | FD Pos. | FD Sal. | DK Pos. | DK Sal. | FDRFT Pos. | FDRFT Sal. |
|---|---|---|---|---|---|---|---|---|---|---|---|---|---|---|---|
| 1 | Jace Peterson | LEFT | 0.294 | 0.364 | 0.150 | 29.2% | 11.2% | 25.0% | 46.5% | 3B | $2,500 | 2B/3B | $3,300 | 2B | $6,700 |
| 2 | Adam Jones | RIGHT | 0.355 | 0.309 | 0.197 | 35.1% | 3.1% | 17.9% | 40.1% | OF | $2,800 | OF | $3,900 | CF | $7,500 |
| 3 | Manny Machado | RIGHT | 0.385 | 0.352 | 0.267 | 35.3% | 11.2% | 17.2% | 32.9% | SS | $4,200 | SS | $5,000 | 3B | $10,000 |
| 4 | Mark Trumbo | RIGHT | 0.375 | 0.418 | 0.217 | 42.5% | 6.1% | 22.8% | 40.0% | OF | $3,100 | 1B/OF | $4,200 | DH | $8,500 |
| 5 | Chris Davis | LEFT | 0.261 | 0.212 | 0.045 | 30.9% | 8.1% | 36.6% | 47.8% | 1B | $2,300 | 1B | $2,800 | IF/OF | $5,700 |
| 6 | Jonathan Schoop | RIGHT | 0.230 | 0.300 | 0.177 | 25.2% | 3.0% | 24.6% | 48.3% | 2B | $2,600 | 2B | $3,400 | 2B | $6,300 |
| 7 | Colby Rasmus | LEFT | 0.305 | 0.414 | 0.138 | 42.9% | 6.3% | 46.9% | 35.7% | OF | $2,300 | OF | $3,200 | LF | $6,500 |
| 8 | Trey Mancini | RIGHT | 0.370 | 0.260 | 0.142 | 33.9% | 9.6% | 24.2% | 48.5% | OF | $2,400 | 1B/OF | $3,200 | IF/OF | $6,600 |
| 9 | Caleb Joseph | RIGHT | 0.223 | 0.344 | 0.175 | 26.3% | 1.7% | 33.9% | 35.1% | C | $2,200 | C | $2,700 | C | $5,800 |
| Team Averages | 0.311 | 0.330 | 0.168 | 33.5% | 6.7% | 27.7% | 41.7% |
Elite Plays – None
Secondary Plays – Jace Peterson, Manny Machado, Chris Davis, Colby Rasmus
Stackability – ORANGE / YELLOW
Arizona at Miami – 7:10 PM ET
| Arizona | Miami | ||||||||||||||
 | Shelby Miller |  | Dan Straily | ||||||||||||
| RIGHT | RIGHT | ||||||||||||||
| Vegas Moneyline | Vegas Over/Under | ||||||||||||||
| ARI-115 | 8.5 | ||||||||||||||
| Stats | wOBA | xwOBA | HC% | BB% | K% | GB% | Stats | wOBA | xwOBA | HC% | BB% | K% | GB% | ||
|---|---|---|---|---|---|---|---|---|---|---|---|---|---|---|---|
| SP vs. Left (2016-17) | SP vs. Left (2016-17) | 0.393 | 0.433 | 48.7% | 17.1% | 18.8% | 25.4% | ||||||||
| SP vs. Right (2016-17) | SP vs. Right (2016-17) | 0.334 | 0.447 | 50.8% | 5.8% | 19.5% | 36.1% | ||||||||
Pitcher Grind Down
| Shelby Miller | |||||||||
 | FanDuel | DraftKings | FantasyDraft | ||||||
| Salary: | $6,600 | Salary: | $6,500 | Salary: | $13,100 | ||||
| Salary Rank: | 16 of 22 | Salary Rank: | 16 of 22 | Salary Rank: | 15 of 22 | ||||
| Stats | Starts | SIERA | ERA | K% | BB% | GB% | HC% | SC% | |
|---|---|---|---|---|---|---|---|---|---|
| 2017 | 4 | 5.06 | 4.09 | 20.2% | 12.1% | 43.9% | 25.4% | 20.9% | |
Miller will be making his long-awaited return to the mound after needing Tommy John surgery on his elbow. In his four rehab starts this season, he posted an FIP close to three with a strikeout rate above 30%. While those numbers are encouraging, he had a 4.87 FIP with a strikeout rate of only 15% in his last full season in the majors (2016). It doesn’t hurt to take a wait and see approach, especially since there are nine other games on the schedule this fine evening.
Quick Breakdown: No need to jump into a full-blown relationship. Take it slow with Miller and see how it goes.
| Dan Straily | |||||||||
 | FanDuel | DraftKings | FantasyDraft | ||||||
| Salary: | $6,000 | Salary: | $4,500 | Salary: | $9,200 | ||||
| Salary Rank: | 19 of 22 | Salary Rank: | 19 of 22 | Salary Rank: | 18 of 22 | ||||
| Stats | Starts | SIERA | ERA | K% | BB% | GB% | HC% | SC% | |
|---|---|---|---|---|---|---|---|---|---|
| 2017 | 33 | 4.43 | 4.26 | 22.1% | 7.8% | 34.2% | 32.6% | 19.1% | |
| 2018 | 10 | 5.09 | 4.89 | 19.1% | 12.3% | 30.3% | 49.6% | 9.5% | |
| L14 | 2 | 4.23 | 9.95 | 26.7% | 10.0% | 18.8% | 58.8% | 11.8% | |
Straily has not had a good year. He started on the DL and hasn’t pitched well since his return. Overall, he has a 5.09 SIERA with a 12% walk rate and a hard contact rate that is 20% higher than his ground ball rate (I didn’t think that was possible). The good news is that his strikeouts have come up over the last few weeks, yet his price continues to go down. His matchup against the Diamondbacks is far from perfect, but at least he’s facing them at home in the pitcher-friendly Marlins Park.
Quick Breakdown: At a price of only $4,500 on DraftKings, Straily is viable in large-field tournaments.
Batter Grind Down
Arizona
The Diamondbacks have been red-hot at the plate recently (.370 xwOBA over the last 15 days) and draw an exploitable matchup against Dan Straily, who is an extreme fly-ball pitcher that gives up a lot of hard contact. On the season, Straily has allowed a .433 xwOBA to lefties and a .447 xwOBA to righties. The fact that this game is being played in Miami should help keep ownership down on the Diamondbacks, even though they have one of the highest ceilings of any offense on the schedule. Paul Goldschmidt (.361 xwOBA), Jake Lamb (.368 xwOBA), David Peralta (.368 xwOBA), and Daniel Descalso (.377 xwOBA) all hit right-handed pitching well.
Projected Lineup (Splits vs. RH Pitching)
| # | Player | Bats | xwOBA | L15 | ISO | HC% | BB% | K% | GB% | FD Pos. | FD Sal. | DK Pos. | DK Sal. | FDRFT Pos. | FDRFT Sal. |
|---|---|---|---|---|---|---|---|---|---|---|---|---|---|---|---|
| 1 | Jon Jay | LEFT | 0.347 | 0.352 | 0.115 | 38.4% | 5.8% | 14.0% | 53.6% | OF | $3,500 | OF | $4,600 | CF | $9,000 |
| 2 | Paul Goldschmidt | RIGHT | 0.361 | 0.495 | 0.211 | 44.3% | 13.3% | 30.4% | 41.2% | 1B | $4,500 | 1B | $5,300 | 1B | $9,900 |
| 3 | Jake Lamb | LEFT | 0.368 | 0.299 | 0.175 | 48.0% | 9.4% | 25.6% | 45.3% | 3B | $3,300 | 3B | $4,100 | 3B | $8,400 |
| 4 | David Peralta | LEFT | 0.368 | 0.378 | 0.254 | 52.3% | 8.5% | 19.0% | 48.1% | OF | $3,700 | OF | $4,900 | RF | $9,000 |
| 5 | Daniel Descalso | LEFT | 0.377 | 0.365 | 0.243 | 43.2% | 16.8% | 22.7% | 30.6% | 2B | $3,000 | 2B/3B | $3,900 | 3B | $7,600 |
| 6 | Ketel Marte | SWITCH | 0.304 | 0.398 | 0.140 | 28.8% | 6.7% | 14.6% | 51.4% | 2B | $3,300 | 2B/SS | $3,800 | SS | $7,600 |
| 7 | Alex Avila | LEFT | 0.280 | 0.448 | 0.111 | 53.5% | 10.9% | 46.5% | 37.2% | C | $2,200 | C | $2,500 | C | $5,000 |
| 8 | Jarrod Dyson | LEFT | 0.284 | 0.226 | 0.071 | 20.7% | 11.3% | 13.1% | 40.7% | OF | $2,300 | OF | $3,300 | CF | $6,300 |
| 9 | Shelby Miller | RIGHT | P | $6,600 | P | $6,500 | P | $13,100 | |||||||
| Team Averages | 0.336 | 0.370 | 0.165 | 41.2% | 10.3% | 23.2% | 43.5% |
Elite Plays – Paul Goldschmidt (GPP), Jake Lamb (GPP), David Peralta (GPP)
Secondary Plays – Paul Goldschmidt (Cash), Jake Lamb (Cash), David Peralta (Cash), Jon Jay, Daniel Descalso, Ketel Marte
Stackability – YELLOW / GREEN
Miami
The Marlins draw a boom or bust matchup against Shelby Miller. There are more positives than negatives here. He struggled in his last full season in the majors and this is his first start since coming back from Tommy John surgery. While he did pitch well in his rehab starts, they were at the Single-A and Double-A levels. If we look at his career splits, Miller has allowed a .336 wOBA to lefties and a .281 wOBA to righties. Derek Dietrich and Justin Bour are both elite tournament plays and they are dirt cheap across the industry. JT Riddle is also worth a look at min-salary on FanDuel ($2,000).
Projected Lineup (Splits vs. RH Pitching)
| # | Player | Bats | xwOBA | L15 | ISO | HC% | BB% | K% | GB% | FD Pos. | FD Sal. | DK Pos. | DK Sal. | FDRFT Pos. | FDRFT Sal. |
|---|---|---|---|---|---|---|---|---|---|---|---|---|---|---|---|
| 1 | Derek Dietrich | LEFT | 0.348 | 0.385 | 0.173 | 38.7% | 5.4% | 21.3% | 40.6% | OF | $3,100 | OF | $3,800 | IF/OF | $7,500 |
| 2 | Brian Anderson | RIGHT | 0.346 | 0.361 | 0.102 | 36.7% | 8.2% | 21.1% | 50.0% | OF | $3,000 | 3B/OF | $3,600 | IF/OF | $7,300 |
| 3 | J.T. Realmuto | RIGHT | 0.404 | 0.378 | 0.269 | 44.6% | 6.5% | 15.2% | 43.2% | C | $3,400 | C | $4,400 | C | $8,600 |
| 4 | Justin Bour | LEFT | 0.408 | 0.362 | 0.261 | 43.4% | 17.3% | 23.6% | 36.6% | 1B | $3,000 | 1B | $3,500 | 1B | $6,500 |
| 5 | Starlin Castro | RIGHT | 0.287 | 0.224 | 0.107 | 34.6% | 5.0% | 20.4% | 49.7% | 2B | $2,800 | 2B | $3,400 | 2B | $6,800 |
| 6 | JT Riddle | LEFT | 0.337 | 0.343 | 0.172 | 37.2% | 4.8% | 27.0% | 46.3% | SS | $2,000 | SS | $3,300 | SS | $6,500 |
| 7 | Miguel Rojas | RIGHT | 0.301 | 0.320 | 0.114 | 31.3% | 4.9% | 13.7% | 55.4% | 3B | $2,500 | 3B/SS | $2,900 | SS | $5,800 |
| 8 | Lewis Brinson | RIGHT | 0.278 | 0.349 | 0.144 | 40.0% | 3.8% | 34.9% | 50.5% | OF | $2,200 | OF | $3,100 | CF | $5,600 |
| 9 | Dan Straily | RIGHT | 0.096 | 0.018 | 0.000 | 0.0% | 7.7% | 61.5% | 66.7% | P | $6,000 | P | $4,500 | P | $9,200 |
| Team Averages | 0.312 | 0.304 | 0.149 | 34.1% | 7.1% | 26.5% | 48.8% |
Elite Plays – Derek Dietrich (GPP), Justin Bour (GPP)
Secondary Plays – Derek Dietrich (Cash), Justin Bour (Cash), JT Riddle
Stackability – ORANGE / YELLOW
Note: Unless noted, all statistics in the Grind Down are from the 2018 season.