MLB Grind Down: Monday, May 30th
The RotoGrinders MLB Grind Down will give you an in-depth analysis into the upcoming MLB schedule. This article will break down the numbers for every single game and give you analysis on which trends you can exploit. While matchups are a major factor in daily fantasy baseball, there are plenty of other factors to consider such as injuries, weather, and salaries.
The analysis should point you in the right direction, but it is still up to you to decipher the information and make your own selections. No sport has more variance than baseball. The best choice is not always the right choice but following the trends will win you money over time.
Note: As always, if you want to try a new DFS site, be sure to click through a RotoGrinders link and use our DraftKings promo code and FanDuel promo code to receive the best perks in the industry.
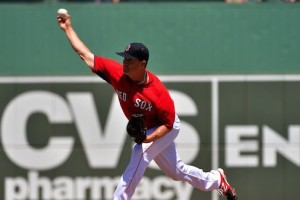
Chicago White Sox at NY Mets – 1:10 PM ET
| Chicago White Sox | NY Mets |
 | |  | |
| LEFT | RIGHT |
| Vegas Moneyline | Vegas Over/Under |
| CWS -125 | 7.0 |
| Stats | wOBA | HR All. | K% | BB% | Stats | wOBA | HR All. | K% | BB% |
| SP vs. Left | 0.268 | 5 | 21.8% | 3.8% | SP vs. Left | 0.327 | 19 | 23.1% | 7.6% |
| SP vs. Right | 0.309 | 12 | 21.1% | 5.4% | SP vs. Right | 0.263 | 7 | 23.3% | 3.2% |
Pitcher Grind Down
| Jose Quintana |
 | FanDuel | DraftKings |
| Salary: | $9,300 | Salary: | $11,700 |
| FPPG: | 38.7 | FPPG: | 21.3 |
| Pitcher Rating: | 89.4 | Pitcher Rank: | 2 |
| Statistics | Starts | PitchPS | SIERA | ERA | K% | BB% | SS% | GB% | FB% | HH% |
| L14 Days | 3 | 102.3 | 3.41 | 4.19 | 22.8% | 3.8% | 8.8% | 43.6% | 36.4% | 33.9% |
| 2016 | 10 | 100.9 | 3.41 | 2.22 | 23.6% | 4.7% | 8.7% | 41.3% | 34.6% | 32.8% |
| 2015 | 32 | 105.4 | 3.62 | 3.36 | 20.5% | 5.1% | 9.2% | 47.1% | 29.7% | 27.7% |
Quintana is having a career year thus far, posting a 3.41 SIERA with a strikeout rate of 23.6% in his first ten starts. He is always a pitcher with great command, as evidenced by his elite walk rate. He draws a favorable matchup today against the Mets, who have had their struggles with left-handed pitching. On the season, they are ranked 20th in team wOBA and 29th in strikeout rate against southpaws. Quintana sees a boost both in this ballpark and because they are playing under National League rules. He is a viable option in all league formats.
| Matt Harvey |
 | FanDuel | DraftKings |
| Salary: | $7,200 | Salary: | $6,200 |
| FPPG: | 22.0 | FPPG: | 9.3 |
| Pitcher Rating: | 86.0 | Pitcher Rank: | 5 |
| Statistics | Starts | PitchPS | SIERA | ERA | K% | BB% | SS% | GB% | FB% | HH% |
| L14 Days | 3 | 82.0 | 4.81 | 10.80 | 12.9% | 5.7% | 8.5% | 38.2% | 30.9% | 33.3% |
| 2016 | 10 | 91.5 | 4.33 | 6.08 | 18.0% | 7.0% | 10.2% | 38.9% | 33.7% | 30.8% |
| 2015 | 29 | 96.5 | 3.23 | 2.71 | 24.9% | 4.9% | 11.6% | 46.0% | 36.1% | 26.7% |
Poor . He has really struggled to get anything going this season and when he has gotten hit, he has gotten hit hard. In his first ten starts, he has a 4.33 SIERA (6.08 ERA) with a strikeout rate of only 18%. While there are certainly concerns, I expect some positive regression moving forward. His BABIP of .374 is not sustainable (his career BABIP is .288). Even though it’s been ugly, he deserves consideration in GPPs at this price point. The White Sox have not hit right-handed pitching well this season, ranking 22nd in team wOBA and 23rd in team ISO.
Batter Grind Down
Chicago White Sox
Do we know which is going to show up in this game? Of course not, but as I mentioned above, his struggles will not last forever. The White Sox do not hit right-handed pitching well and they have the sixth lowest team total on the board. Harvey has allowed a .341+ wOBA to both left and right-handed hitters this season, but this is still a pitcher’s ballpark. I see the White Sox hitters as GPP plays.
- White Sox Offense (2016)
Team wOBA vs. RHP — 0.306 (22 of 30)
Team ISO vs. RHP — 0.140 (23 of 30)
Team K% vs. RHP — 20.3% (14 of 30)
Runs Per Game — 4.16 (17 of 30)
Projected Run Total — 3.65 (25 of 30)
Projected Lineup
| # | Player | Bats | wOBA vs. RHP | ISO vs. RHP | wOBA L14 | FD Position | FD Salary | DK Position | DK Salary |
| 1 | | LEFT | 0.353 | 0.166 | 0.270 | OF | $3,300 | OF | $4,200 |
| 2 | | RIGHT | 0.299 | 0.104 | 0.342 | OF | $3,100 | OF | $2,900 |
| 3 | | RIGHT | 0.335 | 0.221 | 0.368 | 3B | $3,900 | 3B | $4,100 |
| 4 | | SWITCH | 0.325 | 0.126 | 0.334 | OF | $3,300 | OF | $3,200 |
| 5 | | RIGHT | 0.366 | 0.218 | 0.266 | 1B | $3,200 | 1B | $3,800 |
| 6 | | RIGHT | 0.298 | 0.141 | 0.254 | 2B | $2,600 | 2B | $3,000 |
| 7 | | SWITCH | 0.269 | 0.105 | 0.344 | C | $2,800 | C | $2,700 |
| 8 | | RIGHT | 0.265 | 0.106 | 0.331 | SS | $2,600 | SS | $3,000 |
| 9 | | LEFT | 0.000 | 0.000 | | P | $9,300 | P | $11,700 |
| | Team Averages | — | 0.279 | 0.132 | 0.314 | — | — | — | — |
Elite Plays – NONE
Secondary Plays – , , ,
Stackability – NONE
NY Mets
The Mets are small underdogs today and since the White Sox have one of the lowest team totals on the board, you know what that means. New York has the third lowest run projection of the 30 teams in action. has been an elite pitcher over the last two seasons and he has held both left and right-handed hitters under a .305 wOBA.
- Mets Offense (2016)
Team wOBA vs. LHP — 0.303 (20 of 30)
Team ISO vs. LHP — 0.155 (13 of 30)
Team K% vs. LHP — 27.2% (29 of 30)
Runs Per Game — 3.86 (26 of 30)
Projected Run Total — 3.35 (28 of 30)
Projected Lineup
| # | Player | Bats | wOBA vs. LHP | ISO vs. LHP | wOBA L14 | FD Position | FD Salary | DK Position | DK Salary |
| 1 | | LEFT | 0.256 | 0.125 | 0.335 | OF | $3,100 | OF | $2,700 |
| 2 | | SWITCH | 0.314 | 0.126 | 0.295 | SS | $3,300 | SS | $2,700 |
| 3 | | RIGHT | 0.367 | 0.262 | 0.433 | OF | $4,000 | OF | $4,100 |
| 4 | | SWITCH | 0.300 | 0.142 | 0.334 | 2B | $3,000 | 2B | $2,700 |
| 5 | | RIGHT | 0.342 | 0.156 | 0.514 | OF | $2,500 | OF | $2,700 |
| 6 | | RIGHT | 0.375 | 0.256 | | SS | $2,300 | 2B/3B | $3,300 |
| 7 | | RIGHT | 0.215 | 0.132 | 0.157 | C | $2,100 | C | $2,000 |
| 8 | | RIGHT | 0.266 | 0.088 | 0.245 | 3B | $2,000 | 1B/3B | $2,700 |
| 9 | | RIGHT | 0.212 | 0.167 | 0.000 | P | $7,200 | P | $6,200 |
| | Team Averages | — | 0.294 | 0.162 | 0.289 | — | — | — | — |
Elite Plays – NONE
Secondary Plays –
Stackability – NONE
San Francisco at Atlanta – 1:10 PM ET
| San Francisco | Atlanta |
 | |  | |
| RIGHT | RIGHT |
| Vegas Moneyline | Vegas Over/Under |
| SF -185 | 7.5 |
| Stats | wOBA | HR All. | K% | BB% | Stats | wOBA | HR All. | K% | BB% |
| SP vs. Left | 0.344 | 23 | 18.4% | 6.3% | SP vs. Left | 0.412 | 12 | 17.3% | 6.3% |
| SP vs. Right | 0.289 | 11 | 19.4% | 4.7% | SP vs. Right | 0.347 | 10 | 21.6% | 7.2% |
Pitcher Grind Down
| Jeff Samardzija |
 | FanDuel | DraftKings |
| Salary: | $10,700 | Salary: | $12,200 |
| FPPG: | 42.3 | FPPG: | 22.7 |
| Pitcher Rating: | 89.3 | Pitcher Rank: | 3 |
| Statistics | Starts | PitchPS | SIERA | ERA | K% | BB% | SS% | GB% | FB% | HH% |
| L14 Days | 3 | 107.3 | 3.61 | 1.19 | 21.4% | 3.6% | 9.6% | 38.7% | 38.7% | 44.4% |
| 2016 | 10 | 107.5 | 3.57 | 2.54 | 22.3% | 5.8% | 10.3% | 46.7% | 31.7% | 28.5% |
| 2015 | 32 | 104.3 | 4.18 | 4.96 | 17.9% | 5.4% | 9.8% | 39.0% | 39.8% | 27.0% |
Samardzija is having his best season since 2011. This was somewhat expected, as he came over from the American League and he is pitching for a team that is known to get the most out of their starting rotation. Through his first ten starts, he has a 3.57 SIERA with a strikeout rate of 22.3%. His swinging strike rate and his ground ball rate are up, both of which are good for his fantasy appeal. He draws one of the top matchups on the board, as the Braves are ranked 28th in team wOBA and 30th in team ISO against right-handed pitching this season.
| Mike Foltynewicz |
 | FanDuel | DraftKings |
| Salary: | $6,400 | Salary: | $6,900 |
| FPPG: | 26.0 | FPPG: | 13.3 |
| Pitcher Rating: | 50.5 | Pitcher Rank: | 20 |
| Statistics | Starts | PitchPS | SIERA | ERA | K% | BB% | SS% | GB% | FB% | HH% |
| L14 Days | 3 | 95.0 | 4.13 | 3.24 | 17.4% | 5.8% | 9.1% | 44.0% | 28.0% | 28.9% |
| 2016 | 5 | 96.8 | 3.82 | 3.95 | 20.7% | 5.2% | 8.5% | 39.8% | 36.1% | 31.8% |
| 2015 | 15 | 98.7 | 4.30 | 5.71 | 19.3% | 7.3% | 8.9% | 33.3% | 43.5% | 32.5% |
If I ever decide to change my last name, I would give Foltynewicz a hard look. Derek Foltynewicz sounds pretty nice, right? will draw the start for the Braves today. In his first five starts of the season, he has a 3.82 SIERA with a strikeout rate of 20.7%. He has all the weapons to be a successful starter at this level (he hit 100 MPH in his last start), he just hasn’t been able to put it altogether yet. As a large underdog at home against the Giants, Foltynewicz can be avoided for now.
Batter Grind Down
San Francisco
The Giants haven’t been great against right-handed pitching this season, but I expect them to turn that around. They have a number of quality left-handed hitters in their lineup. Even though they are playing in one of the best pitcher’s parks in baseball, they draw a decent matchup against . Over the last two seasons, he has allowed a .412 wOBA to left-handed hitters.
- Giants Offense (2016)
Team wOBA vs. RHP — 0.314 (16 of 30)
Team ISO vs. RHP — 0.140 (23 of 30)
Team K% vs. RHP — 15.7% (2 of 30)
Runs Per Game — 4.44 (12 of 30)
Projected Run Total — 4.24 (15 of 30)
Projected Lineup
| # | Player | Bats | wOBA vs. RHP | ISO vs. RHP | wOBA L14 | FD Position | FD Salary | DK Position | DK Salary |
| 1 | | LEFT | 0.361 | 0.124 | 0.229 | OF | $3,200 | OF | $3,700 |
| 2 | | LEFT | 0.357 | 0.165 | 0.271 | 2B | $3,100 | 2B | $3,800 |
| 3 | Matt Duffy | RIGHT | 0.332 | 0.140 | 0.267 | 3B | $2,900 | 3B | $3,700 |
| 4 | | RIGHT | 0.353 | 0.155 | 0.366 | C | $3,800 | C | $4,400 |
| 5 | | RIGHT | 0.372 | 0.190 | 0.351 | OF | $3,600 | OF | $4,500 |
| 6 | | LEFT | 0.362 | 0.190 | 0.283 | 1B | $3,700 | 1B | $3,800 |
| 7 | | LEFT | 0.340 | 0.220 | 0.349 | SS | $3,100 | SS | $3,900 |
| 8 | | LEFT | 0.327 | 0.118 | 0.321 | OF | $2,700 | OF | $3,300 |
| 9 | | RIGHT | 0.207 | 0.087 | 0.172 | P | $10,700 | P | $12,200 |
| | Team Averages | — | 0.335 | 0.154 | 0.290 | — | — | — | — |
Elite Plays –
Secondary Plays – , , ,
Stackability – NONE
Atlanta
The Braves have very little going for them at the moment. They have the worst record in the majors and they currently average the fewest runs scored per game. They come into today’s game, with get this – the lowest team total on the board. has really pitched well this season and at this point, there is no reason to actively target the Braves’ hitters in your lineups.
- Braves Offense (2016)
Team wOBA vs. RHP — 0.284 (28 of 30)
Team ISO vs. RHP — 0.090 (30 of 30)
Team K% vs. RHP — 19.6% (11 of 30)
Runs Per Game — 3.18 (30 of 30)
Projected Run Total — 3.26 (30 of 30)
Projected Lineup
| # | Player | Bats | wOBA vs. RHP | ISO vs. RHP | wOBA L14 | FD Position | FD Salary | DK Position | DK Salary |
| 1 | | LEFT | 0.346 | 0.114 | 0.308 | OF | $3,100 | OF | $3,000 |
| 2 | | RIGHT | 0.308 | 0.141 | 0.426 | 2B | $3,000 | 2B/3B | $2,200 |
| 3 | | LEFT | 0.370 | 0.217 | 0.263 | 1B | $3,000 | 1B | $3,300 |
| 4 | | RIGHT | 0.312 | 0.189 | 0.443 | OF | $2,700 | OF | $2,300 |
| 5 | | LEFT | 0.341 | 0.094 | 0.270 | OF | $3,100 | OF | $3,000 |
| 6 | | LEFT | 0.325 | 0.130 | 0.151 | C | $2,200 | C | $2,400 |
| 7 | | RIGHT | 0.296 | 0.136 | 0.000 | 3B | $2,000 | 3B/OF | $2,100 |
| 8 | Chase d’Arnaud | RIGHT | 0.410 | 0.040 | 0.459 | 2B | $2,500 | 2B/3B | $3,300 |
| 9 | | RIGHT | 0.071 | 0.034 | 0.000 | P | $6,400 | P | $6,900 |
| | Team Averages | — | 0.309 | 0.122 | 0.258 | — | — | — | — |
Elite Plays – NONE
Secondary Plays – NONE
Stackability – NONE
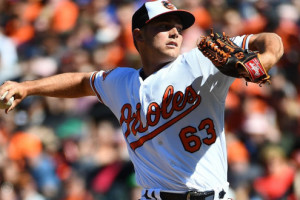
Boston at Baltimore – 1:35 PM ET
| Boston | Baltimore |
 | |  | |
| RIGHT | RIGHT |
| Vegas Moneyline | Vegas Over/Under |
| BAL -105 | 9.0 |
| Stats | wOBA | HR All. | K% | BB% | Stats | wOBA | HR All. | K% | BB% |
| SP vs. Left | 0.281 | 6 | 17.0% | 9.5% | SP vs. Left | 0.311 | 2 | 7.1% | 8.2% |
| SP vs. Right | 0.298 | 9 | 20.8% | 7.9% | SP vs. Right | 0.300 | 5 | 15.3% | 4.2% |
Pitcher Grind Down
| Steven Wright |
 | FanDuel | DraftKings |
| Salary: | $9,200 | Salary: | $8,300 |
| FPPG: | 37.9 | FPPG: | 21.1 |
| Pitcher Rating: | 54.0 | Pitcher Rank: | 19 |
| Statistics | Starts | PitchPS | SIERA | ERA | K% | BB% | SS% | GB% | FB% | HH% |
| L14 Days | 3 | 103.7 | 4.02 | 4.66 | 19.5% | 6.1% | 11.3% | 41.7% | 33.3% | 27.9% |
| 2016 | 9 | 108.1 | 4.04 | 2.52 | 22.0% | 8.5% | 11.5% | 41.6% | 35.5% | 26.8% |
| 2015 | 9 | 130.9 | 4.60 | 4.09 | 16.8% | 8.7% | 9.3% | 43.2% | 43.2% | 33.9% |
Wright’s numbers aren’t going to leap off the page at you, but he is one of the few starters in baseball that has averaged at least 108 pitches per start this season. He also has a high strikeout rate and a great offense behind him, which gives him nice upside every time he takes the mound. The knuckleballer makes an interesting GPP play against the Orioles, who are ranked 23rd in strikeout rate against right-handed pitching this season.
| Tyler Wilson |
 | FanDuel | DraftKings |
| Salary: | $7,200 | Salary: | $5,300 |
| FPPG: | 18.2 | FPPG: | 9.2 |
| Pitcher Rating: | 34.0 | Pitcher Rank: | 27 |
| Statistics | Starts | PitchPS | SIERA | ERA | K% | BB% | SS% | GB% | FB% | HH% |
| L14 Days | 2 | 90.5 | 4.70 | 6.00 | 13.5% | 5.8% | 5.5% | 47.5% | 37.5% | 33.3% |
| 2016 | 6 | 109.0 | 4.66 | 3.80 | 12.4% | 5.7% | 5.7% | 47.2% | 33.1% | 29.2% |
| 2015 | 5 | 104.0 | 5.08 | 3.50 | 8.7% | 7.4% | 5.2% | 52.0% | 30.1% | 31.5% |
Wilson is making his seventh start of the season. While he has a 3.80 ERA, the rest of his pitching statistics are mediocre at best. In his first six starts, he has a 4.66 SIERA with a very low strikeout rate of 12.4%. Even though the Red Sox offense hasn’t been as good on the road as they have been in Fenway Park, there is no reason for Wilson to be on your radar in what should be one of the highest scoring games on the schedule.
Batter Grind Down
Boston
The Red Sox are ranked first in both runs scored per game and in team wOBA against right-handed pitching. They draw a favorable matchup against , who doesn’t generate many outs by the way of the strikeout. Hitters from both sides of the plate are in play here, as Boston has the eighth highest team total on the board. And, as strange as this sounds, the Red Sox will get overlooked today.
- Red Sox Offense (2016)
Team wOBA vs. RHP — 0.361 (1 of 30)
Team ISO vs. RHP — 0.190 (3 of 30)
Team K% vs. RHP — 18.9% (8 of 30)
Runs Per Game — 5.90 (1 of 30)
Projected Run Total — 4.47 (8 of 30)
Projected Lineup
| # | Player | Bats | wOBA vs. RHP | ISO vs. RHP | wOBA L14 | FD Position | FD Salary | DK Position | DK Salary |
| 1 | | RIGHT | 0.349 | 0.191 | 0.404 | OF | $4,300 | OF | $5,400 |
| 2 | | RIGHT | 0.356 | 0.156 | 0.401 | 2B | $4,000 | 2B | $4,800 |
| 3 | | RIGHT | 0.336 | 0.114 | 0.453 | SS | $4,700 | SS | $5,300 |
| 4 | | LEFT | 0.433 | 0.348 | 0.514 | 1B | $4,800 | 1B | $5,500 |
| 5 | | RIGHT | 0.316 | 0.143 | 0.317 | 1B | $3,900 | 1B | $4,500 |
| 6 | | LEFT | 0.372 | 0.265 | 0.437 | OF | $4,400 | OF | $4,700 |
| 7 | | LEFT | 0.364 | 0.207 | 0.282 | 3B | $3,900 | 1B/3B | $4,500 |
| 8 | | RIGHT | 0.242 | 0.100 | 0.213 | C | $2,400 | C | $3,300 |
| 9 | | SWITCH | 0.314 | 0.132 | 0.278 | C | $2,400 | C/OF | $3,600 |
| | Team Averages | — | 0.342 | 0.184 | 0.367 | — | — | — | — |
Elite Plays – ,
Secondary Plays – , ,
Stackability – GPP
Baltimore
The Orioles are technically favorites today, but this game is basically a pick ‘em. They come in with the seventh highest team total on the board and they are playing in the hitter-friendly Camden Yards. If you look at his splits, you probably won’t want to target hitters against , as he has held both left and right-handed hitters under a .300 wOBA. However, with such a high team total I may look to the Orioles’ hitters in GPPs.
- Orioles Offense (2016)
Team wOBA vs. RHP — 0.338 (5 of 30)
Team ISO vs. RHP — 0.185 (5 of 30)
Team K% vs. RHP — 23.3% (23 of 30)
Runs Per Game — 4.46 (11 of 30)
Projected Run Total — 4.53 (7 of 30)
Projected Lineup
| # | Player | Bats | wOBA vs. RHP | ISO vs. RHP | wOBA L14 | FD Position | FD Salary | DK Position | DK Salary |
| 1 | | RIGHT | 0.334 | 0.198 | 0.203 | OF | $2,900 | OF | $3,300 |
| 2 | Hyun Soo Kim | LEFT | 0.405 | 0.068 | 0.406 | OF | $2,400 | OF | $3,200 |
| 3 | | RIGHT | 0.396 | 0.257 | 0.413 | SS | $4,300 | 3B/SS | $4,900 |
| 4 | | LEFT | 0.397 | 0.322 | 0.264 | 1B | $3,800 | 1B | $4,000 |
| 5 | | RIGHT | 0.337 | 0.185 | 0.341 | OF | $3,700 | OF | $4,100 |
| 6 | | SWITCH | 0.339 | 0.167 | 0.497 | C | $3,300 | C | $3,400 |
| 7 | | RIGHT | 0.359 | 0.240 | 0.312 | 2B | $3,300 | 2B | $3,500 |
| 8 | | LEFT | 0.330 | 0.227 | 0.227 | 3B | $2,800 | 1B | $3,000 |
| 9 | | RIGHT | 0.269 | 0.076 | 0.257 | OF | $2,700 | OF | $3,000 |
| | Team Averages | — | 0.352 | 0.193 | 0.324 | — | — | — | — |
Elite Plays – NONE
Secondary Plays – , Hyun Soo Kim, , ,
Stackability – GPP
St. Louis at Milwaukee – 2:10 PM ET
| St. Louis | Milwaukee |
 | |  | |
| RIGHT | RIGHT |
| Vegas Moneyline | Vegas Over/Under |
| STL -120 | 8.5 |
| Stats | wOBA | HR All. | K% | BB% | Stats | wOBA | HR All. | K% | BB% |
| SP vs. Left | 0.334 | 14 | 20.8% | 10.6% | SP vs. Left | 0.306 | 1 | 24.2% | 14.5% |
| SP vs. Right | 0.263 | 4 | 25.5% | 6.4% | SP vs. Right | 0.292 | 2 | 24.0% | 5.3% |
Pitcher Grind Down
| Carlos Martinez |
 | FanDuel | DraftKings |
| Salary: | $8,900 | Salary: | $7,400 |
| FPPG: | 25.8 | FPPG: | 12.8 |
| Pitcher Rating: | 84.8 | Pitcher Rank: | 7 |
| Statistics | Starts | PitchPS | SIERA | ERA | K% | BB% | SS% | GB% | FB% | HH% |
| L14 Days | 3 | 91.3 | 4.57 | 8.40 | 16.9% | 12.7% | 6.6% | 63.0% | 17.4% | 27.7% |
| 2016 | 9 | 89.2 | 4.21 | 4.25 | 19.0% | 9.1% | 8.1% | 53.9% | 29.6% | 30.3% |
| 2015 | 29 | 98.1 | 3.44 | 3.01 | 24.4% | 8.3% | 10.5% | 54.5% | 25.5% | 27.6% |
Martinez is off to a rocky start this season, posting a 4.21 SIERA with a strikeout rate 19%. His numbers are basically down across the board, but the most glaring could be his swinging strike rate of only 8.1%. At this point, it’s hard to trust him in anything other than a GPP. He draws a favorable matchup today against the Brewers, but he has to face them in the hitter-friendly Miller Park. Even though pitching options are scarce today, Martinez isn’t a pitcher that I will have a lot of exposure to.
| Junior Guerra |
 | FanDuel | DraftKings |
| Salary: | $7,000 | Salary: | $7,300 |
| FPPG: | 36.6 | FPPG: | 19.4 |
| Pitcher Rating: | 62.4 | Pitcher Rank: | 14 |
| Statistics | Starts | PitchPS | SIERA | ERA | K% | BB% | SS% | GB% | FB% | HH% |
| L14 Days | 3 | 93.3 | 3.78 | 1.50 | 29.2% | 12.5% | 13.6% | 42.9% | 42.9% | 33.3% |
| 2016 | 5 | 89.2 | 3.93 | 3.30 | 25.2% | 10.1% | 12.8% | 36.0% | 42.7% | 32.5% |
| 2015 | 0 | 0 | 3.28 | 6.75 | 16.7% | 5.6% | 10.6% | 57.1% | 21.4% | 21.4% |
Guerra is one of the best stories of the season. He spent the most of his career as a catcher, then he moved over to being a pitcher, and now he is a 31 year old rookie that is making a name for himself. In his first five starts, he has a 3.93 SIERA with a strikeout rate of 25.2%. The issue for Guerra today is his matchup against the Cardinals. On the season, St. Louis is ranked second in team wOBA and first in team ISO against right-handed pitching.
Batter Grind Down
St. Louis
The Cardinals may not draw the most favorable matchup on the board, but they get to face a somewhat inexperienced pitcher in the hitter-friendly Miller Park. St. Louis has the tenth highest team total on the board and with a game in Coors Field, they should get overlooked in both cash games and tournaments.
- Cardinals Offense (2016)
Team wOBA vs. RHP — 0.351 (2 of 30)
Team ISO vs. RHP — 0.207 (1 of 30)
Team K% vs. RHP — 19.6% (11 of 30)
Runs Per Game — 5.41 (3 of 30)
Projected Run Total — 4.37 (10 of 30)
Projected Lineup
| # | Player | Bats | wOBA vs. RHP | ISO vs. RHP | wOBA L14 | FD Position | FD Salary | DK Position | DK Salary |
| 1 | | LEFT | 0.398 | 0.205 | 0.801 | 2B | $2,900 | 2B/SS | $3,000 |
| 2 | | RIGHT | 0.400 | 0.261 | 0.217 | SS | $2,900 | SS | $3,900 |
| 3 | | RIGHT | 0.353 | 0.181 | 0.249 | OF | $2,900 | OF | $4,100 |
| 4 | | RIGHT | 0.350 | 0.169 | 0.419 | OF | $3,800 | OF | $5,100 |
| 5 | | LEFT | 0.319 | 0.221 | 0.307 | 1B | $2,900 | 1B/OF | $3,800 |
| 6 | | RIGHT | 0.312 | 0.098 | 0.200 | C | $2,700 | C | $3,500 |
| 7 | | RIGHT | 0.369 | 0.274 | 0.399 | OF | $3,400 | OF | $4,300 |
| 8 | | LEFT | 0.323 | 0.136 | 0.269 | 2B | $2,200 | 2B | $3,700 |
| 9 | | RIGHT | 0.227 | 0.038 | 0.294 | P | $8,900 | P | $7,400 |
| | Team Averages | — | 0.339 | 0.176 | 0.351 | — | — | — | — |
Elite Plays – NONE
Secondary Plays – , , , ,
Stackability – GPP
Milwaukee
The Brewers have been a mediocre offense against right-handed pitching this season, ranking 13th in team wOBA and 17th in team ISO. has dominated right-handed hitters in his career, but he has allowed a .334 wOBA and 14 home runs to left-handed hitters over the last two seasons.
- Brewers Offense (2016)
Team wOBA vs. RHP — 0.317 (13 of 30)
Team ISO vs. RHP — 0.156 (17 of 30)
Team K% vs. RHP — 27.1% (30 of 30)
Runs Per Game — 4.30 (14 of 30)
Projected Run Total — 4.13 (19 of 30)
Projected Lineup
| # | Player | Bats | wOBA vs. RHP | ISO vs. RHP | wOBA L14 | FD Position | FD Salary | DK Position | DK Salary |
| 1 | | SWITCH | 0.323 | 0.083 | 0.376 | SS | $3,900 | SS | $4,900 |
| 2 | | LEFT | 0.305 | 0.133 | 0.216 | 2B | $2,800 | 2B | $3,800 |
| 3 | | RIGHT | 0.349 | 0.170 | 0.332 | C | $3,400 | C | $4,400 |
| 4 | | RIGHT | 0.328 | 0.266 | 0.302 | 1B | $3,000 | 1B | $3,800 |
| 5 | | LEFT | 0.305 | 0.165 | 0.225 | OF | $2,400 | OF | $3,400 |
| 6 | | RIGHT | 0.316 | 0.147 | 0.495 | 3B | $2,700 | 2B/3B | $3,700 |
| 7 | | LEFT | 0.272 | 0.132 | 0.170 | OF | $2,200 | OF | $2,000 |
| 8 | | RIGHT | 0.155 | 0.000 | 0.258 | OF | $2,200 | OF | $3,400 |
| 9 | | RIGHT | 0.000 | 0.000 | 0.000 | P | $7,000 | P | $7,300 |
| | Team Averages | — | 0.261 | 0.122 | 0.264 | — | — | — | — |
Elite Plays – NONE
Secondary Plays – , ,
Stackability – NONE
LA Dodgers at Chicago Cubs – 2:20 PM ET
| LA Dodgers | Chicago Cubs |
 | |  | |
| LEFT | RIGHT |
| Vegas Moneyline | Vegas Over/Under |
| CHC -140 | 7.0 |
| Stats | wOBA | HR All. | K% | BB% | Stats | wOBA | HR All. | K% | BB% |
| SP vs. Left | 0.263 | 2 | 21.5% | 5.1% | SP vs. Left | 0.313 | 8 | 23.0% | 9.7% |
| SP vs. Right | 0.327 | 18 | 18.3% | 8.1% | SP vs. Right | 0.291 | 18 | 24.1% | 4.0% |
Pitcher Grind Down
| Alex Wood |
 | FanDuel | DraftKings |
| Salary: | $8,700 | Salary: | $7,200 |
| FPPG: | 26.2 | FPPG: | 14.3 |
| Pitcher Rating: | 65.3 | Pitcher Rank: | 13 |
| Statistics | Starts | PitchPS | SIERA | ERA | K% | BB% | SS% | GB% | FB% | HH% |
| L14 Days | 2 | 92.0 | 1.86 | 2.25 | 39.1% | 4.4% | 13.6% | 45.8% | 33.3% | 37.5% |
| 2016 | 9 | 93.1 | 3.30 | 4.03 | 25.2% | 7.3% | 9.8% | 54.3% | 26.8% | 31.5% |
| 2015 | 32 | 90.9 | 4.17 | 3.84 | 17.4% | 7.4% | 8.2% | 49.5% | 27.5% | 27.9% |
After a slow start to the season, Wood has picked things up, especially in his last two starts. He now owns a 3.30 SIERA with a strikeout rate over 25%. That doesn’t sound like the that we have gotten used to over the years. While the wind is not blowing out in Wrigley Field, I’m still not a big fan of targeting pitchers against the Cubs. In addition to averaging the second most runs per game, Chicago is ranked fourth in team wOBA against left-handed pitching this season.
| Jason Hammel |
 | FanDuel | DraftKings |
| Salary: | $9,300 | Salary: | $9,700 |
| FPPG: | 30.5 | FPPG: | 15.9 |
| Pitcher Rating: | 94.1 | Pitcher Rank: | 1 |
| Statistics | Starts | PitchPS | SIERA | ERA | K% | BB% | SS% | GB% | FB% | HH% |
| L14 Days | 3 | 99.3 | 3.82 | 2.70 | 23.8% | 8.8% | 12.8% | 47.2% | 35.8% | 33.3% |
| 2016 | 9 | 93.4 | 4.20 | 2.17 | 21.6% | 9.6% | 10.3% | 45.1% | 36.1% | 29.1% |
| 2015 | 31 | 88.7 | 3.45 | 3.74 | 24.2% | 5.6% | 10.9% | 38.3% | 37.2% | 32.9% |
Hammel is a sizable underdog at home in a game that features a low run total. That doesn’t sound too bad. In his first nine starts of the season, he has a 4.20 SIERA with a strikeout rate of 21.6%. He draws a sneaky favorable matchup against the Dodgers, who are ranked 22nd in team wOBA and 26th in team ISO against right-handed pitching this season. With very few reliable options available today, Hammel may be the safest cash game target on the board.
Batter Grind Down
LA Dodgers
The Dodgers have surprisingly struggled against right-handed pitching this season. They come into today’s game with the second lowest team total on the board. They draw a difficult matchup against , who has held both left and right-handed hitters under a .315 wOBA over the last two seasons.
- Dodgers Offense (2016)
Team wOBA vs. RHP — 0.306 (22 of 30)
Team ISO vs. RHP — 0.138 (26 of 30)
Team K% vs. RHP — 20.6% (18 of 30)
Runs Per Game — 4.39 (13 of 30)
Projected Run Total — 3.27 (29 of 30)
Projected Lineup
| # | Player | Bats | wOBA vs. RHP | ISO vs. RHP | wOBA L14 | FD Position | FD Salary | DK Position | DK Salary |
| 1 | | LEFT | 0.324 | 0.156 | 0.359 | 2B | $3,600 | 2B | $4,000 |
| 2 | | LEFT | 0.360 | 0.190 | 0.331 | SS | $3,900 | SS | $3,700 |
| 3 | | RIGHT | 0.353 | 0.173 | 0.324 | 3B | $2,800 | 3B | $2,900 |
| 4 | | LEFT | 0.358 | 0.209 | 0.359 | 1B | $3,200 | 1B | $3,700 |
| 5 | | RIGHT | 0.359 | 0.209 | 0.391 | OF | $2,800 | OF | $2,900 |
| 6 | | LEFT | 0.352 | 0.222 | 0.327 | OF | $3,300 | OF | $3,800 |
| 7 | | RIGHT | 0.313 | 0.115 | 0.387 | 2B | $3,200 | 2B/OF | $3,400 |
| 8 | | SWITCH | 0.321 | 0.180 | 0.191 | C | $2,700 | C | $2,800 |
| 9 | | LEFT | 0.210 | 0.018 | 0.220 | P | $8,700 | P | $7,200 |
| | Team Averages | — | 0.328 | 0.164 | 0.321 | — | — | — | — |
Elite Plays – NONE
Secondary Plays – ,
Stackability – NONE
Chicago Cubs
The Cubs have one of the best offenses in baseball. While the wind is not blowing out like it has the last few days at Wrigley, you can still look to a few hitters in their lineup today against . Over the last two seasons, he has allowed a .327 wOBA and 18 home runs to right-handed hitters.
- Cubs Offense (2016)
Team wOBA vs. LHP — 0.346 (4 of 30)
Team ISO vs. LHP — 0.166 (9 of 30)
Team K% vs. LHP — 19.2% (5 of 30)
Runs Per Game — 5.69 (2 of 30)
Projected Run Total — 3.73 (24 of 30)
Projected Lineup
| # | Player | Bats | wOBA vs. LHP | ISO vs. LHP | wOBA L14 | FD Position | FD Salary | DK Position | DK Salary |
| 1 | | SWITCH | 0.369 | 0.148 | 0.394 | OF | $4,400 | OF | $5,000 |
| 2 | | SWITCH | 0.407 | 0.195 | 0.474 | 2B | $4,300 | 2B | $4,800 |
| 3 | | RIGHT | 0.345 | 0.226 | 0.408 | 3B | $4,500 | 3B/OF | $4,700 |
| 4 | | RIGHT | 0.304 | 0.114 | 0.481 | OF | $2,700 | OF | $3,800 |
| 5 | | RIGHT | 0.338 | 0.245 | 0.423 | OF | $2,200 | OF | $3,100 |
| 6 | | RIGHT | 0.256 | 0.149 | 0.211 | SS | $3,300 | SS | $3,200 |
| 7 | | RIGHT | 0.436 | 0.143 | 0.152 | SS | $2,300 | 3B/SS | $2,900 |
| 8 | | RIGHT | 0.296 | 0.136 | 0.369 | C | $2,700 | C | $2,500 |
| 9 | | RIGHT | 0.176 | 0.000 | 0.356 | P | $9,300 | P | $9,700 |
| | Team Averages | — | 0.325 | 0.151 | 0.363 | — | — | — | — |
Elite Plays – NONE
Secondary Plays – , , ,
Stackability – NONE
Are you an incentives member? Come check out the MLB Expert Chat from 5:30 – 6:00 PM ET.
Jump to Page 1 2 3
