MLB Grind Down: Saturday, July 23 - Page Three

by
Ryan138 Last Updated
2016-07-23 19:54:40 NY Mets at Miami – 7:10 PM ET
| NY Mets | Miami |
 | Jacob deGrom |  | |
| RIGHT | RIGHT |
| Vegas Moneyline | Vegas Over/Under |
| MIA -155 | 6.5 |
| Stats | wOBA | HR All. | K% | BB% | Stats | wOBA | HR All. | K% | BB% |
| SP vs. Left | 0.273 | 15 | 25.5% | 5.0% | SP vs. Left | 0.318 | 8 | 28.2% | 8.8% |
| SP vs. Right | 0.236 | 10 | 27.1% | 5.6% | SP vs. Right | 0.208 | 4 | 41.1% | 4.4% |
Pitcher Grind Down
| Jacob deGrom |
 | FanDuel | DraftKings |
| Salary: | $10,600 | Salary: | $11,400 |
| FPPG: | 32.8 | FPPG: | 18.7 |
| Pitcher Rating: | 80.1 | Pitcher Rank: | 5 |
| Statistics | Starts | PitchPS | SIERA | ERA | K% | BB% | SS% | GB% | FB% | HH% |
| L30 Days | 4 | 101.8 | 3.15 | 0.93 | 26.0% | 4.8% | 8.6% | 53.5% | 29.6% | 26.4% |
| 2016 | 16 | 98.4 | 3.52 | 2.38 | 24.4% | 5.7% | 10.4% | 47.6% | 30.9% | 30.1% |
| 2015 | 30 | 99.2 | 2.99 | 2.54 | 27.3% | 5.1% | 12.7% | 44.4% | 34.7% | 26.3% |
I saw an article that referred to deGrom as, “deGrominant” after his recent complete game shutout against the Phillies. He continues to be on a solid stretch of starts over the last two months. On the season, he has a 3.52 SIERA and a 24.4% strikeout rate and now has a decent matchup against the Marlins, who rank 11th in team wOBA and 28th in ISO against rightes. The rough part of DeGrom today is we have two aces facing each other, which makes predicting the win tough here. This bumps his value down slightly today, but he is still a solid play.
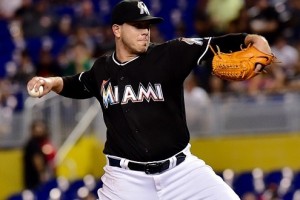
| Jose Fernandez |
 | FanDuel | DraftKings |
| Salary: | $12,100 | Salary: | $13,900 |
| FPPG: | 46.4 | FPPG: | 26.3 |
| Pitcher Rating: | 99.5 | Pitcher Rank: | 1 |
| Statistics | Starts | PitchPS | SIERA | ERA | K% | BB% | SS% | GB% | FB% | HH% |
| L30 Days | 4 | 101.3 | 2.03 | 3.12 | 40.6% | 5.7% | 15.8% | 45.3% | 24.5% | 25.0% |
| 2016 | 18 | 100.3 | 2.48 | 2.53 | 37.7% | 7.4% | 14.8% | 42.5% | 30.0% | 31.5% |
| 2015 | 11 | 90.2 | 2.77 | 2.92 | 29.8% | 5.3% | 13.3% | 40.1% | 31.1% | 29.4% |
On the other side of the ball, we have who is a pitcher to watch every time he takes the mound. He has been electric this season, as he comes into this game with the highest strikeout rate in the majors at 37.7% as well as a solid 2.48 SIERA. He has a great matchup against the Mets, who rank 19th in wOBA against righties and 28th in runs scored per game. With the upside and the matchup for Fernandez, he is 1b to Scherzer tonight for top option.
Batter Grind Down
NY Mets
Jofer is a decent favorite in a game with a total of just six and half runs. This Mets squad has the second-lowest total of the day (2.93 runs) and should be avoided in all formats.
- Mets Offense (2016)
Team wOBA vs. RHP — 0.309 (19 of 30)
Team ISO vs. RHP — 0.175 (9 of 30)
Team K% vs. RHP — 22.6% (24 of 30)
Runs Per Game — 3.74 (28 of 30)
Projected Run Total — 2.93 (29 of 30)
Projected Lineup
| # | Player | Bats | wOBA vs. RHP | ISO vs. RHP | wOBA L14 | FD Position | FD Salary | DK Position | DK Salary |
| 1 | | SWITCH | 0.296 | 0.108 | 0.304 | 3B | $2,200 | 3B | $2,500 |
| 2 | | LEFT | 0.369 | 0.227 | 0.275 | OF | $2,400 | OF | $3,100 |
| 3 | | RIGHT | 0.378 | 0.262 | 0.176 | OF | $3,000 | OF | $3,400 |
| 4 | | SWITCH | 0.325 | 0.170 | 0.160 | 2B | $2,400 | 2B | $2,000 |
| 5 | | LEFT | 0.320 | 0.100 | 0.283 | 1B | $2,100 | 1B | $2,200 |
| 6 | | SWITCH | 0.321 | 0.177 | 0.319 | SS | $2,300 | SS | $2,600 |
| 7 | Travis D’Arnaud | RIGHT | 0.320 | 0.163 | 0.263 | C | $2,000 | C | $2,300 |
| 8 | | LEFT | 0.362 | 0.256 | 0.312 | OF | $2,200 | OF | $2,400 |
| 9 | Jacob deGrom | RIGHT | 0.188 | 0.014 | 0.293 | P | $10,600 | P | $11,400 |
| | Team Averages | — | 0.320 | 0.164 | 0.265 | — | — | — | — |
Elite Plays – None
Secondary Plays – None
Stackability – RED
Miami
This should be a very fun matchup to watch as long as you do not want to see many runs scored. deGrom has kept batters to a wOBA under .287 from both sides of the plate on the year. The Marlins have the third-lowest total (3.57) and should be avoided tonight.
- Marlins Offense (2016)
Team wOBA vs. RHP — 0.318 (11 of 30)
Team ISO vs. RHP — 0.134 (28 of 30)
Team K% vs. RHP — 19.1% (6 of 30)
Runs Per Game — 4.20 (21 of 30)
Projected Run Total — 3.57 (28 of 30)
Projected Lineup
| # | Player | Bats | wOBA vs. RHP | ISO vs. RHP | wOBA L14 | FD Position | FD Salary | DK Position | DK Salary |
| 1 | | RIGHT | 0.317 | 0.123 | 0.277 | C | $2,700 | C | $4,000 |
| 2 | | RIGHT | 0.304 | 0.091 | 0.399 | 3B | $2,500 | 3B | $2,700 |
| 3 | | LEFT | 0.374 | 0.162 | 0.429 | OF | $3,200 | OF | $4,700 |
| 4 | | RIGHT | 0.350 | 0.255 | 0.336 | OF | $3,300 | OF | $4,000 |
| 5 | | RIGHT | 0.308 | 0.141 | 0.264 | OF | $3,200 | OF | $3,100 |
| 6 | | LEFT | 0.370 | 0.183 | 0.171 | 2B | $2,700 | 2B | $2,600 |
| 7 | Chris Johnson | RIGHT | 0.257 | 0.099 | 0.305 | 1B | $2,400 | 1B | $2,000 |
| 8 | | RIGHT | 0.275 | 0.086 | 0.285 | SS | $2,300 | SS | $2,100 |
| 9 | | RIGHT | 0.224 | 0.109 | 0.000 | P | $12,100 | P | $13,900 |
| | Team Averages | — | 0.309 | 0.139 | 0.274 | — | — | — | — |
Elite Plays – None
Secondary Plays – None
Stackability – RED
LA Dodgers at St. Louis – 7:15 PM ET
| LA Dodgers | St. Louis |
 | |  | |
| RIGHT | RIGHT |
| Vegas Moneyline | Vegas Over/Under |
| LAD -118 | 8.0 |
| Stats | wOBA | HR All. | K% | BB% | Stats | wOBA | HR All. | K% | BB% |
| SP vs. Left | 0.291 | 5 | 21.3% | 10.9% | SP vs. Left | 0.314 | 24 | 16.1% | 5.3% |
| SP vs. Right | 0.264 | 6 | 29.4% | 4.3% | SP vs. Right | 0.286 | 13 | 16.4% | 5.1% |
Pitcher Grind Down
| Kenta Maeda |
 | FanDuel | DraftKings |
| Salary: | $8,500 | Salary: | $8,500 |
| FPPG: | 30.4 | FPPG: | 16.4 |
| Pitcher Rating: | 78.7 | Pitcher Rank: | 6 |
| Statistics | Starts | PitchPS | SIERA | ERA | K% | BB% | SS% | GB% | FB% | HH% |
| L30 Days | 5 | 92.4 | 3.25 | 5.13 | 29.7% | 7.2% | 13.4% | 44.1% | 42.6% | 30.9% |
| 2016 | 19 | 92.5 | 3.68 | 3.25 | 25.6% | 7.3% | 12.1% | 43.3% | 37.7% | 28.8% |
Maeda has had a solid rookie season for the Dodgers. He has put up a 3.25 ERA (3.68 SIERA) and a 25.6% strikeout rate after his first 19 starts of his major league career. The matchup tonight is tough, though, against a Cards offense that is ranked second and first in wOBA and ISO against righties. He is priced a bit too high for the matchup tonight.
| Mike Leake |
 | FanDuel | DraftKings |
| Salary: | $7,500 | Salary: | $8,100 |
| FPPG: | 25.7 | FPPG: | 13.1 |
| Pitcher Rating: | 60.7 | Pitcher Rank: | 15 |
| Statistics | Starts | PitchPS | SIERA | ERA | K% | BB% | SS% | GB% | FB% | HH% |
| L30 Days | 5 | 90.6 | 2.78 | 3.99 | 23.0% | 2.4% | 10.8% | 58.1% | 18.3% | 24.5% |
| 2016 | 19 | 90.1 | 3.78 | 4.00 | 17.8% | 3.5% | 7.0% | 52.4% | 26.3% | 33.3% |
| 2015 | 30 | 91.8 | 4.19 | 3.70 | 15.3% | 6.3% | 6.3% | 51.8% | 26.6% | 28.8% |
This may be the game to find some mid-level plays to go along with a stud at two pitcher sites. Leake may be a good option, as he comes into this game with a 3.78 SIERA to go along with his low 17.8% strikeout rate. He has seen a major jump in strikeouts over his last two starts (11 and 10), but that is likely due to his matchups against the Padres and Brewers. While we cannot expect the same strikeout output, he makes a decent mid-level option, though I do like McHugh better at DK and Lackey and McHugh better at FD.
Batter Grind Down
LA Dodgers
The Dodgers are not the greatest right-handed hitting offense, which is surprising based on their lefty-heavy lineup. With that said, they do have some hitters in some solid spots tonight.
- Dodgers Offense (2016)
Team wOBA vs. RHP — 0.317 (14 of 30)
Team ISO vs. RHP — 0.159 (16 of 30)
Team K% vs. RHP — 20.7% (15 of 30)
Runs Per Game — 4.29 (19 of 30)
Projected Run Total — 4.11 (18 of 30)
Projected Lineup
| # | Player | Bats | wOBA vs. RHP | ISO vs. RHP | wOBA L14 | FD Position | FD Salary | DK Position | DK Salary |
| 1 | | LEFT | 0.311 | 0.137 | 0.306 | 2B | $3,000 | 2B | $3,600 |
| 2 | | LEFT | 0.404 | 0.241 | 0.370 | SS | $3,400 | SS | $4,900 |
| 3 | | LEFT | 0.351 | 0.189 | 0.367 | 1B | $3,300 | 1B | $4,200 |
| 4 | | RIGHT | 0.384 | 0.224 | 0.528 | 3B | $3,400 | 3B | $5,000 |
| 5 | | LEFT | 0.346 | 0.225 | 0.098 | OF | $3,200 | OF | $3,500 |
| 6 | | RIGHT | 0.319 | 0.114 | 0.511 | 2B | $2,500 | 2B/OF | $3,400 |
| 7 | | SWITCH | 0.328 | 0.205 | 0.508 | C | $2,900 | C | $3,700 |
| 8 | | LEFT | 0.286 | 0.056 | 0.286 | OF | $2,000 | OF | $2,300 |
| 9 | | RIGHT | 0.126 | 0.130 | 0.000 | P | $8,500 | P | $8,500 |
| | Team Averages | — | 0.317 | 0.169 | 0.330 | — | — | — | — |
Elite Plays –
Secondary Plays – ,
Stackability – ORANGE
St. Louis
The Cardinals are one of the best offenses in baseball against right-handed pitching. With that said, they don’t have the greatest matchups on paper against Maeda, who has kept lefties to a wOBA of .291 and righties .261. The Cards have a projected team total of just 3.89, which is in the bottom third of the totals tonight. They are not an offense I will be targeting much.
- Cardinals Offense (2016)
Team wOBA vs. RHP — 0.346 (2 of 30)
Team ISO vs. RHP — 0.202 (1 of 30)
Team K% vs. RHP — 19.6% (8 of 30)
Runs Per Game — 5.18 (2 of 30)
Projected Run Total — 3.89 (23 of 30)
Projected Lineup
| # | Player | Bats | wOBA vs. RHP | ISO vs. RHP | wOBA L14 | FD Position | FD Salary | DK Position | DK Salary |
| 1 | | RIGHT | 0.382 | 0.272 | 0.429 | OF | $2,900 | OF | $3,100 |
| 2 | | RIGHT | 0.402 | 0.234 | 0.398 | SS | $3,500 | SS | $4,700 |
| 3 | | RIGHT | 0.345 | 0.172 | 0.436 | OF | $3,500 | OF | $3,700 |
| 4 | | RIGHT | 0.348 | 0.171 | 0.388 | OF | $3,300 | OF | $3,200 |
| 5 | | LEFT | 0.314 | 0.190 | 0.317 | 1B | $2,700 | 1B | $2,900 |
| 6 | | RIGHT | 0.300 | 0.093 | 0.444 | C | $2,600 | C | $2,900 |
| 7 | | RIGHT | 0.364 | 0.271 | 0.345 | OF | $2,700 | OF | $4,800 |
| 8 | | RIGHT | 0.308 | 0.188 | 0.545 | 3B | $2,600 | 2B/3B | $4,000 |
| 9 | | RIGHT | 0.166 | 0.145 | 0.452 | P | $7,500 | P | $8,100 |
| | Team Averages | — | 0.325 | 0.193 | 0.417 | — | — | — | — |
Elite Plays -
Secondary Plays –
Stackability – RED
Texas at Kansas City – 7:15 PM ET
| Texas | Kansas City |
 | |  | |
| LEFT | RIGHT |
| Vegas Moneyline | Vegas Over/Under |
| TEX -118 | 8.0 |
| Stats | wOBA | HR All. | K% | BB% | Stats | wOBA | HR All. | K% | BB% |
| SP vs. Left | 0.276 | 5 | 21.1% | 8.7% | SP vs. Left | 0.321 | 16 | 20.9% | 9.9% |
| SP vs. Right | 0.305 | 33 | 24.6% | 7.6% | SP vs. Right | 0.305 | 11 | 19.7% | 7.4% |
Pitcher Grind Down
| Cole Hamels |
 | FanDuel | DraftKings |
| Salary: | $9,300 | Salary: | $9,400 |
| FPPG: | 37.3 | FPPG: | 19.2 |
| Pitcher Rating: | 71.2 | Pitcher Rank: | 8 |
| Statistics | Starts | PitchPS | SIERA | ERA | K% | BB% | SS% | GB% | FB% | HH% |
| L30 Days | 5 | 94.2 | 4.27 | 3.38 | 22.7% | 9.4% | 11.0% | 40.2% | 36.8% | 29.9% |
| 2016 | 19 | 101.2 | 4.11 | 3.00 | 22.8% | 9.3% | 12.3% | 49.1% | 31.4% | 29.1% |
| 2015 | 32 | 104.5 | 3.45 | 3.65 | 24.4% | 7.1% | 13.3% | 47.7% | 31.4% | 27.0% |
Hamels comes into this season with a 3.00 ERA (4.11 SIERA) to go along with a solid 22.8% strikeout rate. He gets a decent matchup against the Royals, who are ranked eighth in wOBA and 20th in ISO against lefties. With Hamels priced under $10k at the two major sites, he could be used as a cheaper option tonight, but there is a bit of risk fading both Scherzer and Fernandez.
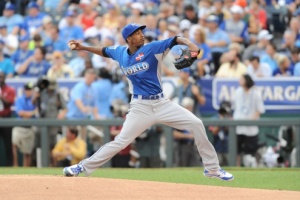
| Yordano Ventura |
 | FanDuel | DraftKings |
| Salary: | $7,700 | Salary: | $5,400 |
| FPPG: | 24.1 | FPPG: | 11.2 |
| Pitcher Rating: | 58.7 | Pitcher Rank: | 17 |
| Statistics | Starts | PitchPS | SIERA | ERA | K% | BB% | SS% | GB% | FB% | HH% |
| L30 Days | 4 | 82.3 | 3.75 | 6.55 | 16.8% | 5.3% | 10.9% | 56.9% | 18.1% | 35.6% |
| 2016 | 18 | 91.4 | 4.79 | 4.97 | 16.9% | 9.2% | 8.3% | 48.6% | 32.1% | 31.2% |
| 2015 | 28 | 94.7 | 3.69 | 4.08 | 22.5% | 8.4% | 10.4% | 52.2% | 27.2% | 29.8% |
Ventura has been very inconsistent this year, which has resulted in a 4.97 ERA (4.79 SIERA). His very low strikeout rate of 16.9% this year does not make up for his poor pitching at times, making him a tough start in all formats against a Rangers team that is ranked 11th in wOBA and 14th in ISO. He is an easy avoid due to his low upside.
Batter Grind Down
Texas
Ventura is attackable from both sides of the plate this year, as he has allowed a .324 wOBA to lefties and .320 to righties. The Rangers have a projected run total of 4.11, which is in the middle of the pack today. They have some decent bats that come cheap tonight, making them a value source against Ventura.
- Rangers Offense (2016)
Team wOBA vs. RHP — 0.318 (11 of 30)
Team ISO vs. RHP — 0.168 (14 of 30)
Team K% vs. RHP — 19.4% (7 of 30)
Runs Per Game — 4.82 (8 of 30)
Projected Run Total — 4.11 (18 of 30)
Projected Lineup
| # | Player | Bats | wOBA vs. RHP | ISO vs. RHP | wOBA L14 | FD Position | FD Salary | DK Position | DK Salary |
| 1 | | SWITCH | 0.394 | 0.189 | 0.320 | 2B | $2,500 | 2B/3B | $3,500 |
| 2 | | RIGHT | 0.316 | 0.170 | 0.421 | OF | $3,500 | OF | $4,400 |
| 3 | | LEFT | 0.328 | 0.214 | 0.322 | 2B | $3,000 | 2B | $4,200 |
| 4 | | RIGHT | 0.306 | 0.139 | 0.307 | 3B | $3,100 | 3B | $3,000 |
| 5 | | LEFT | 0.349 | 0.219 | 0.449 | 1B | $2,600 | 1B | $3,100 |
| 6 | | RIGHT | 0.284 | 0.153 | 0.223 | OF | $2,900 | 1B/OF | $3,000 |
| 7 | | LEFT | 0.348 | 0.167 | 0.275 | OF | $2,800 | OF | $3,100 |
| 8 | | RIGHT | 0.286 | 0.087 | 0.408 | SS | $2,900 | SS | $3,200 |
| 9 | | RIGHT | 0.323 | 0.232 | 0.398 | C | $2,800 | C | $3,300 |
| | Team Averages | — | 0.326 | 0.174 | 0.347 | — | — | — | — |
Elite Plays – ,
Secondary Plays – ,
Stackability – ORANGE
Kansas City
Kansas City comes into this game with a 3.89 projected team run total, which is in the bottom third of the totals tonight. They have a tough matchup against Hamels, who has kept lefties to a .248 wOBA, while righties have been somewhat better with a .322 wOBA against him.
- Royals Offense (2016)
Team wOBA vs. LHP — 0.332 (8 of 30)
Team ISO vs. LHP — 0.160 (20 of 30)
Team K% vs. LHP — 17.6% (4 of 30)
Runs Per Game — 4.02 (26 of 30)
Projected Run Total — 3.89 (23 of 30)
Projected Lineup
| # | Player | Bats | wOBA vs. LHP | ISO vs. LHP | wOBA L14 | FD Position | FD Salary | DK Position | DK Salary |
| 1 | | RIGHT | 0.370 | 0.143 | 0.243 | 2B | $2,500 | 2B/OF | $3,200 |
| 2 | | RIGHT | 0.268 | 0.137 | 0.355 | C | $3,000 | C | $3,200 |
| 3 | | SWITCH | 0.347 | 0.148 | 0.224 | 1B | $2,700 | 1B/OF | $3,100 |
| 4 | | LEFT | 0.325 | 0.151 | 0.268 | 1B | $2,800 | 1B | $3,100 |
| 5 | | RIGHT | 0.475 | 0.304 | 0.356 | OF | $2,000 | OF | $3,100 |
| 6 | | RIGHT | 0.320 | 0.194 | 0.419 | 3B | $2,900 | 3B | $3,100 |
| 7 | | LEFT | 0.327 | 0.124 | 0.331 | OF | $2,500 | OF | $2,100 |
| 8 | | RIGHT | 0.267 | 0.063 | 0.208 | SS | $3,100 | SS | $2,000 |
| 9 | | RIGHT | 0.313 | 0.129 | 0.246 | OF | $2,200 | OF | $2,500 |
| | Team Averages | — | 0.335 | 0.155 | 0.294 | — | — | — | — |
Elite Plays – None
Secondary Plays –
Stackability – RED
Atlanta at Colorado – 8:10 PM ET
| Atlanta | Colorado |
 | |  | |
| RIGHT | LEFT |
| Vegas Moneyline | Vegas Over/Under |
| COL -190 | 11.5 |
| Stats | wOBA | HR All. | K% | BB% | Stats | wOBA | HR All. | K% | BB% |
| SP vs. Left | 0.384 | 20 | 11.9% | 10.9% | SP vs. Left | 0.266 | 0 | 19.1% | 14.3% |
| SP vs. Right | 0.285 | 14 | 21.2% | 3.9% | SP vs. Right | 0.327 | 4 | 20.2% | 2.2% |
Pitcher Grind Down
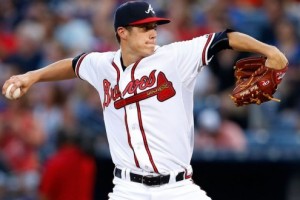
| Matt Wisler |
 | FanDuel | DraftKings |
| Salary: | $6,700 | Salary: | $4,100 |
| FPPG: | 24.4 | FPPG: | 12.1 |
| Pitcher Rating: | 24.0 | Pitcher Rank: | 30 |
| Statistics | Starts | PitchPS | SIERA | ERA | K% | BB% | SS% | GB% | FB% | HH% |
| L30 Days | 5 | 97.8 | 4.60 | 5.97 | 18.7% | 7.5% | 11.3% | 36.5% | 42.7% | 34.7% |
| 2016 | 18 | 96.1 | 4.61 | 4.67 | 17.8% | 6.7% | 9.0% | 37.6% | 43.0% | 37.3% |
| 2015 | 19 | 93.3 | 4.98 | 4.71 | 15.1% | 8.4% | 8.1% | 33.6% | 43.2% | 28.2% |
Wisler is not a pitcher we want to target in any format or any park. He has a 4.67 ERA (4.59 SIERA) to go along with his low 17.8% strikeout rate. In Coors, he is an easy avoid.
| Tyler Anderson |
 | FanDuel | DraftKings |
| Salary: | $6,300 | Salary: | $5,700 |
| FPPG: | 25.9 | FPPG: | 13.5 |
| Pitcher Rating: | 69.0 | Pitcher Rank: | 12 |
| Statistics | Starts | PitchPS | SIERA | ERA | K% | BB% | SS% | GB% | FB% | HH% |
| L30 Days | 5 | 97.6 | 3.72 | 3.90 | 19.2% | 6.2% | 11.5% | 59.1% | 22.6% | 27.4% |
| 2016 | 7 | 97.4 | 3.50 | 3.43 | 19.9% | 5.1% | 10.9% | 59.1% | 22.0% | 27.7% |
What is going on with the Rockies starters when we see two guys pitch in a row that we don’t want to send a full stack against. Anderson has been solid this year, as he sports a 3.49 SIERA and 19.9% strikeout rate. While it is always tough to use a pitcher in Coors, he is very cheap and gets such a good matchup against the Braves that you would not look crazy for putting him in a tournament lineup.
Batter Grind Down
Atlanta
The lefty Anderson has kept opposing lefties at bay with a .266 wOBA allowed on the year. He has allowed a .327 wOBA to righties on the year, and this Braves squad comes into this matchup with the third-highest projected run total on the day. The Braves fade worked last night and could fully work again tonight. If you do want to play some Braves, the righties that hit high up in the order are in play along with Freeman.
- Braves Offense (2016)
Team wOBA vs. LHP — 0.282 (29 of 30)
Team ISO vs. LHP — 0.104 (30 of 30)
Team K% vs. LHP — 20.7% (11 of 30)
Runs Per Game — 3.40 (30 of 30)
Projected Run Total — 5.23 (3 of 30)
Projected Lineup
| # | Player | Bats | wOBA vs. LHP | ISO vs. LHP | wOBA L14 | FD Position | FD Salary | DK Position | DK Salary |
| 1 | | RIGHT | 0.298 | 0.142 | 0.308 | 2B | $3,900 | 2B/3B | $3,700 |
| 2 | | RIGHT | 0.340 | 0.171 | 0.422 | 3B | $3,400 | 3B | $3,900 |
| 3 | | LEFT | 0.344 | 0.156 | 0.297 | 1B | $3,900 | 1B | $4,600 |
| 4 | | LEFT | 0.278 | 0.058 | 0.331 | OF | $3,700 | OF | $3,300 |
| 5 | | RIGHT | 0.305 | 0.141 | 0.289 | OF | $3,300 | OF | $4,600 |
| 6 | | LEFT | 0.247 | 0.049 | 0.342 | OF | $3,300 | OF | $3,900 |
| 7 | | RIGHT | 0.329 | 0.231 | 0.392 | C | $3,100 | C | $3,100 |
| 8 | | SWITCH | 0.239 | 0.050 | 0.150 | SS | $3,000 | SS | $2,900 |
| 9 | | RIGHT | 0.076 | 0.000 | 0.000 | P | $6,700 | P | $4,100 |
| | Team Averages | — | 0.273 | 0.111 | 0.281 | — | — | — | — |
Elite Plays – , ,
Secondary Plays – ,
Stackability – YELLOW
Colorado
This Colorado offense has the highest projected run total of the entire day at 6.27 runs. They get a great matchup against Wisler, who has allowed lefties a wOBA of .353 on the year. Both righties and lefties are in play for the Rockies, but the lefties are in a truly great spot tonight.
- Rockies Offense (2016)
Team wOBA vs. RHP — 0.339 (4 of 30)
Team ISO vs. RHP — 0.184 (6 of 30)
Team K% vs. RHP — 20.1% (11 of 30)
Runs Per Game — 5.13 (4 of 30)
Projected Run Total — 6.27 (1 of 30)
Projected Lineup
| # | Player | Bats | wOBA vs. RHP | ISO vs. RHP | wOBA L14 | FD Position | FD Salary | DK Position | DK Salary |
| 1 | | LEFT | 0.364 | 0.184 | 0.328 | OF | $4,100 | OF | $5,100 |
| 2 | | RIGHT | 0.340 | 0.110 | 0.299 | 2B | $3,900 | 2B | $4,000 |
| 3 | | RIGHT | 0.383 | 0.301 | 0.306 | 3B | $4,700 | 3B | $4,600 |
| 4 | | LEFT | 0.411 | 0.292 | 0.388 | OF | $4,200 | OF | $5,200 |
| 5 | | RIGHT | 0.354 | 0.278 | 0.416 | SS | $4,000 | SS | $5,500 |
| 6 | | RIGHT | 0.329 | 0.176 | 0.247 | 1B | $3,500 | 1B | $4,700 |
| 7 | | LEFT | 0.313 | 0.133 | 0.343 | 2B | $3,100 | 1B/OF | $3,400 |
| 8 | | RIGHT | 0.347 | 0.172 | 0.252 | C | $3,100 | C | $3,600 |
| 9 | | LEFT | 0.289 | 0.300 | 0.579 | P | $6,300 | P | $5,700 |
| | Team Averages | — | 0.348 | 0.216 | 0.351 | — | — | — | — |
Elite Plays – , , ,
Secondary Plays – , ,
Stackability – GREEN
Tampa Bay at Oakland – 9:05 PM ET
| Tampa Bay | Oakland |
 | |  | |
| LEFT | RIGHT |
| Vegas Moneyline | Vegas Over/Under |
| OAK -105 | 8.5 |
| Stats | wOBA | HR All. | K% | BB% | Stats | wOBA | HR All. | K% | BB% |
| SP vs. Left | 0.289 | 4 | 36.0% | 5.3% | SP vs. Left | 0.343 | 10 | 15.8% | 9.8% |
| SP vs. Right | 0.340 | 28 | 23.2% | 7.1% | SP vs. Right | 0.324 | 18 | 14.5% | 4.8% |
Pitcher Grind Down
| Drew Smyly |
 | FanDuel | DraftKings |
| Salary: | $7,700 | Salary: | $5,900 |
| FPPG: | 26.4 | FPPG: | 13.8 |
| Pitcher Rating: | 60.5 | Pitcher Rank: | 16 |
| Statistics | Starts | PitchPS | SIERA | ERA | K% | BB% | SS% | GB% | FB% | HH% |
| L30 Days | 4 | 100.0 | 5.10 | 9.15 | 16.5% | 9.7% | 10.3% | 36.1% | 37.5% | 30.3% |
| 2016 | 18 | 98.4 | 3.83 | 5.64 | 24.5% | 6.4% | 11.2% | 33.1% | 46.4% | 32.2% |
| 2015 | 12 | 94.7 | 3.25 | 3.10 | 28.0% | 7.3% | 11.4% | 36.8% | 44.3% | 31.6% |
Smyly’s recent game logs are not pretty, as he has allowed at least four earned runs in eight of his last ten starts. He has really struggled this year and has a 5.64 ERA to show for it. His SIERA of 3.82 shows some major improvements should be made over the second half of the season, and Smyly is always someone we should keep an eye on, as he does have a solid 24.5% strikeout rate. Tonight, he is hard to trust until we see those improvements start to be made, unless you want to take a GPP flyer at his cheap price.
| Kendall Graveman |
 | FanDuel | DraftKings |
| Salary: | $6,600 | Salary: | $7,900 |
| FPPG: | 23.9 | FPPG: | 11.1 |
| Pitcher Rating: | 45.9 | Pitcher Rank: | 24 |
| Statistics | Starts | PitchPS | SIERA | ERA | K% | BB% | SS% | GB% | FB% | HH% |
| L30 Days | 5 | 96.0 | 4.71 | 2.97 | 11.0% | 4.4% | 6.0% | 54.9% | 31.0% | 31.6% |
| 2016 | 18 | 89.7 | 4.63 | 4.25 | 15.0% | 7.3% | 8.4% | 52.2% | 29.3% | 31.5% |
| 2015 | 21 | 90.4 | 4.43 | 4.05 | 15.3% | 7.6% | 7.6% | 50.0% | 28.6% | 28.3% |
Graveman is an easy avoid tonight. He sports a 4.52 SIERA, but more importantly, a very low 15.2% strikeout rate. Even in a decent matchup, his upside is not there, and we do not need to focus much attention on him in any format.
Batter Grind Down
Tampa Bay
Graveman can be attacked from both sides of the plate, as he has allowed a .364 wOBA to lefties and .302 wOBA to righties on the year. The Rays can be used for value lefties in the front of the order.
- Rays Offense (2016)
Team wOBA vs. RHP — 0.305 (24 of 30)
Team ISO vs. RHP — 0.180 (8 of 30)
Team K% vs. RHP — 24.4% (28 of 30)
Runs Per Game — 4.05 (24 of 30)
Projected Run Total — 4.22 (17 of 30)
Projected Lineup
| # | Player | Bats | wOBA vs. RHP | ISO vs. RHP | wOBA L14 | FD Position | FD Salary | DK Position | DK Salary |
| 1 | | RIGHT | 0.325 | 0.118 | 0.300 | 2B | $3,700 | 2B | $3,100 |
| 2 | | LEFT | 0.338 | 0.204 | 0.336 | SS | $3,500 | SS | $3,900 |
| 3 | | RIGHT | 0.327 | 0.192 | 0.494 | 3B | $3,700 | 3B | $4,400 |
| 4 | | RIGHT | 0.341 | 0.207 | 0.482 | OF | $3,400 | 1B/2B | $2,900 |
| 5 | | RIGHT | 0.311 | 0.167 | 0.149 | OF | $2,800 | OF | $2,800 |
| 6 | | LEFT | 0.356 | 0.271 | 0.395 | OF | $3,500 | OF | $3,500 |
| 7 | | RIGHT | 0.285 | 0.117 | 0.277 | OF | $3,100 | OF | $2,300 |
| 8 | | RIGHT | 0.290 | 0.227 | 0.211 | C | $2,600 | C | $2,000 |
| 9 | | LEFT | 0.318 | 0.180 | 0.242 | OF | $2,500 | OF | $3,200 |
| | Team Averages | — | 0.321 | 0.187 | 0.321 | — | — | — | — |
Elite Plays – ,
Secondary Plays – , ,
Stackability – ORANGE
Oakland
Smyly has allowed batters from both sides a wOBA of at least .325 on the year. Oakland has a 4.28 projected run total tonight, which is in the middle of the pack for teams playing today. Use them as value plays tonight.
- Athletics Offense (2016)
Team wOBA vs. LHP — 0.313 (21 of 30)
Team ISO vs. LHP — 0.166 (14 of 30)
Team K% vs. LHP — 18.3% (5 of 30)
Runs Per Game — 4.13 (23 of 30)
Projected Run Total — 4.28 (15 of 30)
Projected Lineup
| # | Player | Bats | wOBA vs. LHP | ISO vs. LHP | wOBA L14 | FD Position | FD Salary | DK Position | DK Salary |
| 1 | | RIGHT | 0.385 | 0.244 | 0.306 | SS | $2,900 | SS | $4,700 |
| 2 | | SWITCH | 0.332 | 0.135 | 0.272 | 2B | $2,700 | 2B | $2,600 |
| 3 | | LEFT | 0.262 | 0.098 | 0.394 | OF | $3,300 | OF | $3,400 |
| 4 | | RIGHT | 0.386 | 0.196 | 0.249 | 3B | $3,100 | 3B | $4,300 |
| 5 | | RIGHT | 0.310 | 0.229 | 0.290 | OF | $3,300 | OF | $4,300 |
| 6 | | RIGHT | 0.320 | 0.146 | 0.376 | 1B | $2,500 | 1B | $3,500 |
| 7 | | LEFT | 0.277 | 0.107 | 0.539 | C | $3,300 | C | $3,900 |
| 8 | | RIGHT | 0.404 | 0.279 | 0.411 | OF | $2,600 | OF | $3,400 |
| 9 | | | 1.256 | 1.000 | 1.068 | P | $6,000 | 0 | $0 |
| | Team Averages | — | 0.437 | 0.270 | 0.434 | — | — | — | — |
Elite Plays – ,
Secondary Plays – ,
Stackability – ORANGE
Jump to Page 1 2 3
