MLB Grind Down: Saturday, May 20th

Jump to Page 1 2 3
The RotoGrinders MLB Grind Down will give you an in-depth analysis into the upcoming MLB schedule. This article will break down the numbers for every single game and give you analysis on which trends you can exploit. While matchups are a major factor in daily fantasy baseball, there are plenty of other factors to consider such as injuries, weather, and salaries.
The analysis should point you in the right direction, but it is still up to you to decipher the information and make your own selections. No sport has more variance than baseball. The best choice is not always the right choice but following the trends will win you money over time.
Note: As always, if you want to try a new DFS site, be sure to click through a RotoGrinders link and use our DraftKings promo code, FanDuel promo code, and FantasyDraft promo code to receive the best perks in the industry.
Stackability Rating System:
GREEN – A viable full stack in cash games and GPPs.
YELLOW – A viable mini-stack in cash games and full stack in GPPs.
ORANGE – A viable stack in large field GPPs.
RED – Not a recommended stack for cash games or GPPs.
Kansas City at Minnesota – 2:10 PM ET
| Kansas City | Minnesota | ||||||||||||||
 | Ian Kennedy |  | Adalberto Mejia | ||||||||||||
| RIGHT | LEFT | ||||||||||||||
| Vegas Moneyline | Vegas Over/Under | ||||||||||||||
| MIN-107 | 9.0 | ||||||||||||||
| Stats | wOBA | xwOBA | HC% | BB% | K% | GB% | Stats | wOBA | xwOBA | HC% | BB% | K% | GB% | ||
|---|---|---|---|---|---|---|---|---|---|---|---|---|---|---|---|
| SP vs. Left (2016-17) | 0.298 | 0.319 | 36.0% | 8.8% | 21.0% | 30.4% | SP vs. Left (2016-17) | 1.060 | 0.736 | 50.0% | 0.0% | 0.0% | 0.0% | ||
| SP vs. Right (2016-17) | 0.315 | 0.324 | 36.7% | 8.1% | 24.0% | 37.9% | SP vs. Right (2016-17) | 0.422 | 0.360 | 29.7% | 15.8% | 17.5% | 37.8% | ||
Pitcher Grind Down
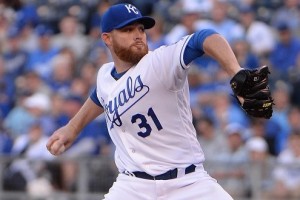
| Ian Kennedy | |||||||||
 | FanDuel | DraftKings | FantasyDraft | ||||||
| Salary: | $8,000 | Salary: | $8,400 | Salary: | $16,400 | ||||
| Salary Rank: | 10 of 30 | Salary Rank: | 10 of 30 | Salary Rank: | 10 of 30 | ||||
| Stats | Starts | SIERA | ERA | K% | BB% | GB% | HC% | SC% | |
|---|---|---|---|---|---|---|---|---|---|
| 2016 | 33 | 4.27 | 3.68 | 22.5% | 8.1% | 33.2% | 36.4% | 18.6% | |
| 2017 | 6 | 4.53 | 3.03 | 21.8% | 10.6% | 38.9% | 35.8% | 17.9% | |
Greetings Grinders! Just like most Saturdays, we have a full 15-game slate on the menu. The schedule is divided almost perfectly in half with eight games on the early slate and seven games on the late slate. Sadly, pitching is not divided nearly as evenly. Most of the better pitchers are in the early slate while we’ll have to take on some risk later. That’s fine though, we all get the same player pool and salary cap to work with.
We’ll kick things off with Ian Kennedy against the Twins. Kennedy has a 21.8% K rate, 10.6% BB rate and 35.8% hard contact this season. He doesn’t get nearly enough ground balls to really feel safe here. He’s also taking on a Twins offense that leads the league in BB rate against RH pitching at 11% with a K rate of just 21%.
Quick Breakdown: – Kennedy is close to being a pitcher that we can use but a 49.5% fly ball rate coupled with 35.8% hard contact means we would be taking on considerable risk. Kennedy is a fringe SP2 on multi-pitcher sites.
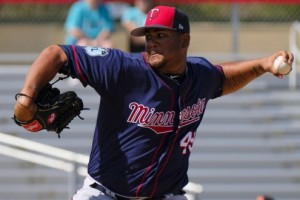
| Adalberto Mejia | |||||||||
 | FanDuel | DraftKings | FantasyDraft | ||||||
| Salary: | $5,500 | Salary: | $6,000 | Salary: | $12,000 | ||||
| Salary Rank: | 29 of 30 | Salary Rank: | 25 of 30 | Salary Rank: | 24 of 30 | ||||
| Stats | Starts | SIERA | ERA | K% | BB% | GB% | HC% | SC% | |
|---|---|---|---|---|---|---|---|---|---|
| 2016 | 0 | 7.02 | 7.71 | 0.0% | 7.7% | 33.3% | 41.7% | 8.3% | |
| 2017 | 3 | 5.52 | 5.79 | 21.7% | 17.4% | 37.0% | 25.9% | 33.3% | |
We don’t have much of a major league sample to work with regarding Adalberto Mejia. What we do have does not look great though. In three starts this year he’s walking 17.4% of batters with a K rate of just 21.4%. The Royals are one of the worst offenses in the league against LH pitching with a .265 wOBA and a 61 wRC+. That said, they really don’t strikeout all that much with a 19.5% K rate.
Quick Breakdown: – Even though the Royals lack firepower, the walks are concerning enough that we can safely avoid Adalberto Mejia today.
Batter Grind Down
Kansas City
So far this season, Adalberto Mejia has faced 46 RH batters and zero LH batters. That somewhat skews the chart above. Even if we look at career numbers (two years) Mejia has only faced two LH batters. What we do know is that Meija is allowing plenty of fly balls at 48% this season. Any of the Royals that have decent power are playable. In fact, some of the cheaper options could work as well if you simply want to snag a walk or two and maybe a run scored. Lorenzo Cain (.375 wOBA vs. LH), Jorge Soler (.355 wOBA vs. LH), and Whit Merrifield (.377 wOBA vs. LH) are the most interesting options.
Projected Lineup (Splits vs. LH Pitching)
| # | Player | Bats | wOBA | xwOBA | ISO | HC% | BB% | K% | GB% | FD Pos. | FD Sal. | DK Pos. | DK Sal. | FDRFT Pos. | FDRFT Sal. |
|---|---|---|---|---|---|---|---|---|---|---|---|---|---|---|---|
| 1 | Alcides Escobar | RIGHT | 0.254 | 0.261 | 0.097 | 26.1% | 4.0% | 13.4% | 51.6% | SS | $2,200 | SS | $2,900 | SS | $5,600 |
| 2 | Mike Moustakas | LEFT | 0.250 | 0.285 | 0.167 | 33.3% | 1.8% | 21.8% | 47.6% | 3B | $3,700 | 3B | $3,800 | 3B | $7,500 |
| 3 | Lorenzo Cain | RIGHT | 0.375 | 0.365 | 0.187 | 29.9% | 12.0% | 12.7% | 38.3% | OF | $3,200 | OF | $3,900 | CF | $7,600 |
| 4 | Eric Hosmer | LEFT | 0.284 | 0.306 | 0.141 | 29.2% | 5.6% | 19.9% | 61.4% | 1B | $3,300 | 1B | $3,800 | 1B | $7,600 |
| 5 | Salvador Perez | RIGHT | 0.292 | 0.293 | 0.184 | 31.5% | 5.6% | 21.8% | 31.5% | C | $3,100 | C | $3,600 | C | $7,200 |
| 6 | Jorge Bonifacio | RIGHT | 0.211 | 0.316 | 0.000 | 23.1% | 5.0% | 30.0% | 38.5% | OF | $2,400 | OF | $3,200 | RF | $6,400 |
| 7 | Jorge Soler | RIGHT | 0.355 | 0.366 | 0.214 | 35.5% | 10.4% | 22.9% | 37.1% | OF | $2,700 | OF | $3,600 | RF | $7,200 |
| 8 | Alex Gordon | LEFT | 0.280 | 0.314 | 0.113 | 32.2% | 10.2% | 27.2% | 46.3% | OF | $2,600 | OF | $3,200 | LF | $6,400 |
| 9 | Whit Merrifield | RIGHT | 0.377 | 0.336 | 0.140 | 46.2% | 9.0% | 20.7% | 44.7% | 2B | $2,700 | 2B | $3,800 | IF/OF | $7,500 |
Elite Plays – Lorenzo Cain
Secondary Plays – Jorge Soler and Whit Merrifield
Stackability – YELLOW – A viable mini-stack in cash games and full stack in GPPs.
Minnesota
Ian Kennedy is one of the better pitchers on the early slate in terms of real life talent. The best strategy here is to try and find a home run with Kennedy’s elevated hard hit rate and fly ball rate. I suppose that would lead us to Miguel Sano here. He has a .353 wOBA vs. RH pitching and a 43.3% hard contact rate. Even Brian Dozier and Max Kepler hit RH pitching well with quite a bit of hard contact. That’s about as far as I would go here though.
Projected Lineup (Splits vs. RH Pitching)
| # | Player | Bats | wOBA | xwOBA | ISO | HC% | BB% | K% | GB% | FD Pos. | FD Sal. | DK Pos. | DK Sal. | FDRFT Pos. | FDRFT Sal. |
|---|---|---|---|---|---|---|---|---|---|---|---|---|---|---|---|
| 1 | Brian Dozier | RIGHT | 0.356 | 0.326 | 0.247 | 32.6% | 9.3% | 19.5% | 39.1% | 2B | $3,700 | 2B | $4,600 | 2B | $8,800 |
| 2 | Joe Mauer | LEFT | 0.338 | 0.389 | 0.133 | 33.5% | 13.8% | 14.5% | 47.5% | 1B | $2,800 | 1B | $3,800 | 1B | $7,500 |
| 3 | Miguel Sano | RIGHT | 0.353 | 0.351 | 0.245 | 43.3% | 12.2% | 36.7% | 33.1% | 3B | $3,800 | 3B | $4,800 | IF/OF | $9,200 |
| 4 | Kennys Vargas | SWITCH | 0.318 | 0.293 | 0.252 | 33.7% | 11.1% | 34.0% | 33.7% | 1B | $2,700 | 1B | $3,800 | 1B | $7,600 |
| 5 | Max Kepler | LEFT | 0.342 | 0.320 | 0.210 | 34.9% | 10.8% | 18.9% | 43.8% | OF | $2,900 | OF | $3,900 | RF | $7,800 |
| 6 | Jorge Polanco | SWITCH | 0.311 | 0.305 | 0.116 | 23.7% | 7.9% | 12.6% | 35.2% | SS | $2,900 | SS | $3,600 | SS | $7,200 |
| 7 | Chris Gimenez | RIGHT | 0.253 | 0.261 | 0.083 | 30.8% | 7.4% | 24.4% | 47.1% | C | $2,000 | C | $2,900 | C | $5,700 |
| 8 | Eddie Rosario | LEFT | 0.316 | 0.283 | 0.185 | 32.3% | 3.4% | 23.4% | 45.1% | OF | $2,600 | OF | $3,400 | LF | $6,800 |
| 9 | Byron Buxton | RIGHT | 0.285 | 0.235 | 0.176 | 23.2% | 6.0% | 36.2% | 36.2% | OF | $2,900 | OF | $3,600 | CF | $7,200 |
Elite Plays – Miguel Sano
Secondary Plays – Brian Dozier and Max Kepler
Stackability – ORANGE – A viable stack in large field GPPs.
Milwaukee at Chicago Cubs – 2:20 PM ET
| Milwaukee | Chicago Cubs | ||||||||||||||
 | Chase Anderson |  | Jake Arrieta | ||||||||||||
| RIGHT | RIGHT | ||||||||||||||
| Vegas Moneyline | Vegas Over/Under | ||||||||||||||
| CHC-200 | 7.5 | ||||||||||||||
| Stats | wOBA | xwOBA | HC% | BB% | K% | GB% | Stats | wOBA | xwOBA | HC% | BB% | K% | GB% | ||
|---|---|---|---|---|---|---|---|---|---|---|---|---|---|---|---|
| SP vs. Left (2016-17) | 0.300 | 0.310 | 34.5% | 8.3% | 19.8% | 33.2% | SP vs. Left (2016-17) | 0.295 | 0.327 | 29.3% | 13.1% | 24.3% | 47.9% | ||
| SP vs. Right (2016-17) | 0.376 | 0.352 | 38.2% | 8.2% | 18.4% | 37.9% | SP vs. Right (2016-17) | 0.267 | 0.266 | 24.5% | 5.4% | 24.0% | 51.8% | ||
Pitcher Grind Down
| Chase Anderson | |||||||||
 | FanDuel | DraftKings | FantasyDraft | ||||||
| Salary: | $7,800 | Salary: | $6,400 | Salary: | $12,600 | ||||
| Salary Rank: | 13 of 30 | Salary Rank: | 22 of 30 | Salary Rank: | 23 of 30 | ||||
| Stats | Starts | SIERA | ERA | K% | BB% | GB% | HC% | SC% | |
|---|---|---|---|---|---|---|---|---|---|
| 2016 | 30 | 4.68 | 4.39 | 18.6% | 8.2% | 36.1% | 36.6% | 17.2% | |
| 2017 | 8 | 4.40 | 3.43 | 20.4% | 8.4% | 35.4% | 37.0% | 17.0% | |
With greater than an 80% chance of rain, this game is a candidate to get rained out. It’s highly unlikely that we’ll get a large enough window to target pitchers here but I’ll go ahead and break down these two pitchers in case you want to take the risk. Chase Anderson doesn’t offer nearly enough upside to fire him up against one of the best offenses in baseball. He has a 20.4% K rate and 35.4% hard contact rate. His .376 wOBA against RH hitters is especially concerning.
Quick Breakdown: – The combination of a possible rain out and tough matchup make Chase Anderson any easy name to cross off the list today.
| Jake Arrieta | |||||||||
 | FanDuel | DraftKings | FantasyDraft | ||||||
| Salary: | $9,700 | Salary: | $9,400 | Salary: | $18,000 | ||||
| Salary Rank: | 2 of 30 | Salary Rank: | 6 of 30 | Salary Rank: | 6 of 30 | ||||
| Stats | Starts | SIERA | ERA | K% | BB% | GB% | HC% | SC% | |
|---|---|---|---|---|---|---|---|---|---|
| 2016 | 31 | 3.94 | 3.10 | 23.9% | 9.6% | 52.6% | 25.2% | 22.9% | |
| 2017 | 8 | 3.60 | 5.44 | 25.0% | 6.6% | 40.2% | 31.8% | 23.5% | |
Jake Arrieta really hasn’t been himself this season. He has a 5.44 ERA right now and seems to have forgotten how to generate ground balls. With ground balls down to 40% this season, we’ve seen fly balls increase to 37.9% and hard contact up to 31.8%. This is still a matchup with the Brewers though who own a 24.2% K rate against RH pitching. Maybe mother nature is doing us a favor here. I would certainly have some interest in Arrieta in tournaments if Kevin Roth gives us a green light for pitchers.
Quick Breakdown: – Arrieta is a viable tournament option today given the Brewers aptitude for striking out. That said, weather concerns end up bumping Arrieta pretty far down the list.
Batter Grind Down
Milwaukee
Even though Arrieta has struggled this year, targeting him with Brewers bats is not a smart strategy. If you insist on going here , LH batters have traditionally done the most damage against Arrieta. They have a 13.1% walk rate but still own a lowly .295 wOBA. Eric Thames would be the ideal option with his .426 wOBA vs. RH but we’re not getting any kind of discount.
Projected Lineup (Splits vs. RH Pitching)
| # | Player | Bats | wOBA | xwOBA | ISO | HC% | BB% | K% | GB% | FD Pos. | FD Sal. | DK Pos. | DK Sal. | FDRFT Pos. | FDRFT Sal. |
|---|---|---|---|---|---|---|---|---|---|---|---|---|---|---|---|
| 1 | Jonathan Villar | SWITCH | 0.329 | 0.303 | 0.142 | 35.4% | 10.9% | 26.0% | 60.6% | 2B | $2,800 | 2B | $3,900 | 2B | $7,600 |
| 2 | Eric Thames | LEFT | 0.426 | 0.367 | 0.323 | 45.7% | 15.5% | 22.4% | 39.1% | 1B | $3,600 | 1B | $4,500 | 1B | $8,700 |
| 3 | Hernan Perez | RIGHT | 0.317 | 0.293 | 0.160 | 30.6% | 5.1% | 19.2% | 48.4% | OF | $2,800 | 3B/OF | $3,600 | IF/OF | $7,200 |
| 4 | Travis Shaw | LEFT | 0.333 | 0.334 | 0.199 | 35.6% | 8.4% | 23.0% | 38.4% | 3B | $3,500 | 3B | $4,000 | 3B | $7,800 |
| 5 | Domingo Santana | RIGHT | 0.336 | 0.338 | 0.181 | 34.9% | 10.8% | 31.9% | 46.4% | OF | $2,900 | OF | $3,400 | RF | $6,800 |
| 6 | Manny Pina | RIGHT | 0.369 | 0.334 | 0.221 | 27.5% | 7.7% | 15.4% | 31.6% | C | $2,700 | C | $2,700 | C | $5,200 |
| 7 | Keon Broxton | RIGHT | 0.323 | 0.293 | 0.179 | 38.4% | 10.7% | 36.4% | 43.0% | OF | $3,000 | OF | $3,500 | CF | $6,800 |
| 8 | Orlando Arcia | RIGHT | 0.256 | 0.244 | 0.138 | 25.8% | 5.4% | 21.8% | 53.4% | SS | $2,500 | SS | $2,800 | SS | $5,400 |
| 9 | Chase Anderson | RIGHT | 0.097 | 0.117 | 0.000 | 17.9% | 0.0% | 49.1% | 68.2% | P | $7,800 | P | $6,400 | P | $12,600 |
Elite Plays – None
Secondary Plays – None
Stackability – RED – Not a recommended stack for cash games or GPPs.
Chicago Cubs
As long as there is a large enough window to get the game in, the Cubs hitters are in a good spot today. Chase Anderson has a .346 wOBA vs RH and .326 wOBA vs. LH this season. Left-handed hitters also have a 45% fly ball rate and 43% hard contact rate. We should be able to target Cubs from either side of the plate here. Kyle Schwarber has struggled this season with a .299 wOBA vs. RH but his xwOBA of .368 says he’s been getting a little bit unlucky. Assuming that Ian Happ makes the lineup again today he’s a strong option. So is Kris Bryant, “(player-popup), Anthony Rizzo, Ben Zobrist and just about any other Cub that make the lineup. A full stack is definitely in play here but just be sure to check the weather.
Projected Lineup (Splits vs. RH Pitching)
| # | Player | Bats | wOBA | xwOBA | ISO | HC% | BB% | K% | GB% | FD Pos. | FD Sal. | DK Pos. | DK Sal. | FDRFT Pos. | FDRFT Sal. |
|---|---|---|---|---|---|---|---|---|---|---|---|---|---|---|---|
| 1 | Kyle Schwarber | LEFT | 0.299 | 0.368 | 0.188 | 35.4% | 13.0% | 25.2% | 44.9% | OF | $3,400 | OF | $4,300 | IF/OF | $8,400 |
| 2 | Kris Bryant | RIGHT | 0.378 | 0.351 | 0.230 | 37.6% | 10.0% | 22.9% | 31.3% | 3B | $4,300 | 3B | $5,400 | IF/OF | $10,400 |
| 3 | Anthony Rizzo | LEFT | 0.389 | 0.377 | 0.254 | 36.8% | 11.9% | 16.7% | 36.8% | 1B | $4,200 | 1B | $5,000 | 1B | $9,600 |
| 4 | Ben Zobrist | SWITCH | 0.351 | 0.362 | 0.170 | 32.8% | 15.6% | 12.0% | 46.8% | OF | $3,000 | 2B/OF | $3,900 | IF/OF | $7,600 |
| 5 | Addison Russell | RIGHT | 0.301 | 0.298 | 0.150 | 27.1% | 7.6% | 21.5% | 42.6% | SS | $3,200 | SS | $3,800 | SS | $7,500 |
| 6 | Miguel Montero | LEFT | 0.319 | 0.311 | 0.175 | 31.9% | 13.3% | 21.4% | 46.8% | C | $2,500 | C | $3,200 | C | $6,400 |
| 7 | Jason Heyward | LEFT | 0.298 | 0.314 | 0.107 | 27.0% | 8.7% | 13.7% | 46.6% | OF | $2,700 | OF | $3,400 | RF | $6,800 |
| 8 | Jake Arrieta | RIGHT | 0.250 | 0.263 | 0.153 | 35.3% | 3.3% | 41.0% | 39.4% | P | $9,700 | P | $9,400 | P | $18,000 |
| 9 | Javier Baez | RIGHT | 0.301 | 0.265 | 0.164 | 28.6% | 1.5% | 26.0% | 44.8% | 2B | $2,800 | 2B/SS | $4,000 | 2B | $7,800 |
Elite Plays – Kyle Schwarber and Kris Bryant
Secondary Plays – Anthony Rizzo, Ben Zobrist and Ian Happ
Stackability – GREEN – A viable full stack in cash games and GPPs.
Boston at Oakland – 4:05 PM ET
| Boston | Oakland | ||||||||||||||
 | Drew Pomeranz |  | Sean Manaea | ||||||||||||
| LEFT | LEFT | ||||||||||||||
| Vegas Moneyline | Vegas Over/Under | ||||||||||||||
| OAK-105 | 8.5 | ||||||||||||||
| Stats | wOBA | xwOBA | HC% | BB% | K% | GB% | Stats | wOBA | xwOBA | HC% | BB% | K% | GB% | ||
|---|---|---|---|---|---|---|---|---|---|---|---|---|---|---|---|
| SP vs. Left (2016-17) | 0.317 | 0.298 | 34.2% | 9.8% | 24.0% | 42.0% | SP vs. Left (2016-17) | 0.224 | 0.271 | 29.4% | 5.2% | 25.0% | 56.7% | ||
| SP vs. Right (2016-17) | 0.290 | 0.284 | 31.3% | 9.1% | 27.2% | 46.1% | SP vs. Right (2016-17) | 0.321 | 0.331 | 34.5% | 8.0% | 21.2% | 44.5% | ||
Pitcher Grind Down
| Drew Pomeranz | |||||||||
 | FanDuel | DraftKings | FantasyDraft | ||||||
| Salary: | $8,000 | Salary: | $8,300 | Salary: | $16,000 | ||||
| Salary Rank: | 10 of 30 | Salary Rank: | 11 of 30 | Salary Rank: | 11 of 30 | ||||
| Stats | Starts | SIERA | ERA | K% | BB% | GB% | HC% | SC% | |
|---|---|---|---|---|---|---|---|---|---|
| 2016 | 30 | 3.80 | 3.32 | 26.5% | 9.3% | 46.2% | 31.5% | 19.1% | |
| 2017 | 7 | 3.82 | 5.29 | 26.0% | 9.3% | 39.6% | 35.1% | 23.7% | |
Drew Pomeranz is probably our best SP2 option today (and even a possible GPP option on FD). Pomeranz has elite strikeout stuff at 26%. His ERA of 5.29 isn’t elite even though he’s been a little unlucky. The Athletics are one of the worst offenses against LH pitching with a 24.7% K rate, .299 wOBA and and 91 wRC+. The concern with Pomeranz is whether or not he’ll be able to last deep into the game. He’s made it to the sixth inning in just two of seven starts this season. That makes getting a QS on FD a bit risky but we’ll live with the strikeout upside on multi-pitcher sites as an SP2.
Quick Breakdown: – There are red flags with just about any SP2 option today. Considering the matchup with Oakand, Pomeranz is one of the safer ways to go.
| Sean Manaea | |||||||||
 | FanDuel | DraftKings | FantasyDraft | ||||||
| Salary: | $7,300 | Salary: | $8,000 | Salary: | $15,600 | ||||
| Salary Rank: | 19 of 30 | Salary Rank: | 13 of 30 | Salary Rank: | 13 of 30 | ||||
| Stats | Starts | SIERA | ERA | K% | BB% | GB% | HC% | SC% | |
|---|---|---|---|---|---|---|---|---|---|
| 2016 | 24 | 4.04 | 3.86 | 20.9% | 6.2% | 44.2% | 33.6% | 18.4% | |
| 2017 | 6 | 4.06 | 5.52 | 26.8% | 13.4% | 62.0% | 33.3% | 23.6% | |
Sean Manaea is interesting today. His K rate is up to 26.8% this season after posting a 20% rate last year. That’s backed by a SwStr% of 14.8%. Sadly, Manaea faces a Red Sox team that is last in the league in K% vs. LH pitching at 14.5%. I’m personally not a believer in Manaea’s increased strikeout ability though and there’s nothing about this matchup that makes me want to take the risk.
Quick Breakdown: – This is a good spot to take the wait-and-see approach with Maneae. If he can get through this matchup cleanly we’ll add him to the list of possible options in the future when he has a better matchup.
Batter Grind Down
Maneae has shown pretty drastic splits this season with a .197 wOBA to LH hitters and .311 to RH. His career numbers aren’t that drastic but do show the same trend. Red Sox RH batters are firmly in play here. That starts with Dustin Pedroia, Xander Bogaerts, and Hanley Ramirez. You could certainly even get away with Mookie Betts.
Boston
Projected Lineup (Splits vs. LH Pitching)
| # | Player | Bats | wOBA | xwOBA | ISO | HC% | BB% | K% | GB% | FD Pos. | FD Sal. | DK Pos. | DK Sal. | FDRFT Pos. | FDRFT Sal. |
|---|---|---|---|---|---|---|---|---|---|---|---|---|---|---|---|
| 1 | Mookie Betts | RIGHT | 0.340 | 0.340 | 0.248 | 34.6% | 5.6% | 9.4% | 38.5% | OF | $4,400 | OF | $5,200 | RF | $10,200 |
| 2 | Dustin Pedroia | RIGHT | 0.354 | 0.351 | 0.104 | 31.6% | 14.5% | 11.9% | 41.4% | 2B | $3,400 | 2B | $3,700 | 2B | $7,200 |
| 3 | Xander Bogaerts | RIGHT | 0.374 | 0.346 | 0.159 | 34.5% | 11.4% | 16.3% | 44.5% | SS | $3,700 | SS | $4,100 | SS | $8,000 |
| 4 | Andrew Benintendi | LEFT | 0.254 | 0.234 | 0.019 | 25.0% | 11.1% | 25.4% | 52.6% | OF | $3,500 | OF | $3,700 | LF | $7,200 |
| 5 | Hanley Ramirez | RIGHT | 0.433 | 0.405 | 0.300 | 38.4% | 11.9% | 17.5% | 42.0% | 1B | $3,100 | 1B | $4,100 | IF/OF | $8,000 |
| 6 | Mitch Moreland | LEFT | 0.346 | 0.349 | 0.181 | 38.1% | 8.6% | 25.0% | 50.0% | 1B | $3,200 | 1B | $3,500 | 1B | $6,900 |
| 7 | Chris Young | RIGHT | 0.382 | 0.337 | 0.217 | 33.8% | 11.4% | 20.0% | 22.5% | P | $5,500 | P | $5,000 | P | $9,900 |
| 8 | Christian Vazquez | RIGHT | 0.332 | 0.344 | 0.146 | 20.6% | 10.9% | 15.2% | 47.1% | C | $2,300 | C | $2,600 | C | $5,100 |
| 9 | Deven Marrero | RIGHT | 0.201 | 0.311 | 0.077 | 25.0% | 7.1% | 35.7% | 37.5% | SS | $2,000 | 3B | $2,300 | 3B | $4,400 |
Elite Plays – Dustin Pedroia and Xander Bogaerts
Secondary Plays – Mookie Betts and Hanley Ramirez
Stackability – YELLOW – A viable mini-stack in cash games and full stack in GPPs.
Oakland
I’m not going out of my way to pick on Drew Pomeranz today (since I’m probably using him). In his career, Pomeranz has a .320 wOBA vs RH and .265 to LH batters. This season, Pomeranz has oddly displayed reverse splits but that could just be noise with a small sample. He’s allowing a .492 wOBA to LH batters (only faced 36). Khris Davis and Ryon Healy both hit LH pitching well though I find myself unlikely to go here.
Projected Lineup (Splits vs. LH Pitching)
| # | Player | Bats | wOBA | xwOBA | ISO | HC% | BB% | K% | GB% | FD Pos. | FD Sal. | DK Pos. | DK Sal. | FDRFT Pos. | FDRFT Sal. |
|---|---|---|---|---|---|---|---|---|---|---|---|---|---|---|---|
| 1 | Rajai Davis | RIGHT | 0.282 | 0.274 | 0.130 | 25.5% | 7.5% | 22.6% | 40.0% | OF | $3,000 | OF | $3,500 | CF | $6,800 |
| 2 | Jed Lowrie | SWITCH | 0.291 | 0.328 | 0.035 | 27.7% | 7.3% | 16.3% | 41.5% | 2B | $2,300 | 2B | $3,500 | 2B | $6,800 |
| 3 | Khris Davis | RIGHT | 0.355 | 0.406 | 0.259 | 40.0% | 9.9% | 26.0% | 41.7% | OF | $3,300 | OF | $3,900 | LF | $7,600 |
| 4 | Ryon Healy | RIGHT | 0.419 | 0.372 | 0.284 | 36.6% | 3.8% | 18.9% | 37.8% | 1B | $3,000 | 1B/3B | $3,300 | 3B | $6,600 |
| 5 | Trevor Plouffe | RIGHT | 0.324 | 0.332 | 0.164 | 39.0% | 8.9% | 24.2% | 50.0% | 3B | $2,900 | 3B | $3,600 | 3B | $7,200 |
| 6 | Mark Canha | RIGHT | 0.266 | 0.273 | 0.294 | 27.3% | 0.0% | 35.3% | 36.4% | OF | $2,300 | OF | $3,000 | IF/OF | $6,000 |
| 7 | Chad Pinder | RIGHT | 0.309 | 0.310 | 0.178 | 48.5% | 2.2% | 26.1% | 42.4% | 2B | $2,600 | 2B/SS | $2,200 | 2B | $4,000 |
| 8 | Adam Rosales | RIGHT | 0.362 | 0.311 | 0.242 | 39.2% | 13.6% | 36.1% | 35.6% | 2B | $2,800 | SS | $2,300 | 3B | $4,400 |
| 9 | Josh Phegley | RIGHT | 0.261 | 0.343 | 0.123 | 38.8% | 4.9% | 13.1% | 40.8% | C | $2,400 | C | $2,900 | C | $5,700 |
Elite Plays – None
Secondary Plays – Khris Davis and Ryon Healy
Stackability – ORANGE – A viable stack in large field GPPs.
Philadelphia at Pittsburgh – 4:05 PM ET
| Philadelphia | Pittsburgh | ||||||||||||||
 | Vince Velasquez |  | Ivan Nova | ||||||||||||
| RIGHT | RIGHT | ||||||||||||||
| Vegas Moneyline | Vegas Over/Under | ||||||||||||||
| PIT-125 | 8.5 | ||||||||||||||
| Stats | wOBA | xwOBA | HC% | BB% | K% | GB% | Stats | wOBA | xwOBA | HC% | BB% | K% | GB% | ||
|---|---|---|---|---|---|---|---|---|---|---|---|---|---|---|---|
| SP vs. Left (2016-17) | 0.347 | 0.331 | 32.9% | 10.6% | 25.4% | 37.5% | SP vs. Left (2016-17) | 0.351 | 0.367 | 37.1% | 3.5% | 12.3% | 45.7% | ||
| SP vs. Right (2016-17) | 0.316 | 0.309 | 33.2% | 7.0% | 27.9% | 36.4% | SP vs. Right (2016-17) | 0.293 | 0.286 | 31.0% | 3.6% | 22.2% | 58.6% | ||
Pitcher Grind Down
| Vince Velasquez | |||||||||
 | FanDuel | DraftKings | FantasyDraft | ||||||
| Salary: | $7,900 | Salary: | $9,200 | Salary: | $17,600 | ||||
| Salary Rank: | 12 of 30 | Salary Rank: | 7 of 30 | Salary Rank: | 7 of 30 | ||||
| Stats | Starts | SIERA | ERA | K% | BB% | GB% | HC% | SC% | |
|---|---|---|---|---|---|---|---|---|---|
| 2016 | 24 | 3.62 | 4.12 | 27.6% | 8.2% | 34.8% | 32.6% | 18.4% | |
| 2017 | 7 | 4.25 | 5.63 | 23.5% | 10.8% | 43.9% | 34.6% | 14.0% | |
Vince Velasquez is a tough pitcher to break down. Velasquez’ K rate is down to 23.5% this season however his SwStr% is holding steady 10.2%. The big concern here is Velasquez still has a 10.8% BB rate. The Pirates are not a terrible matchup for RH pitchers as they own 78 wRC+ and a .278 wOBA however they own a K rate of just 18.1% which is second to last. That puts Velasquez in an odd spot. There’s not enough strikeout upside to comfortably roll him out but we also don’t necessarily want to stack Pirates against him either.
Quick Breakdown: – You could possibly get away with Velasquez as an SP2 however you’re paying for the strikeout upside with the matchup negates it. The increased walks this season are also concerning enough to make me look elsewhere.
| Ivan Nova | |||||||||
 | FanDuel | DraftKings | FantasyDraft | ||||||
| Salary: | $8,500 | Salary: | $8,700 | Salary: | $16,800 | ||||
| Salary Rank: | 8 of 30 | Salary Rank: | 9 of 30 | Salary Rank: | 9 of 30 | ||||
| Stats | Starts | SIERA | ERA | K% | BB% | GB% | HC% | SC% | |
|---|---|---|---|---|---|---|---|---|---|
| 2016 | 26 | 3.76 | 4.17 | 18.6% | 4.1% | 53.6% | 34.4% | 18.5% | |
| 2017 | 8 | 3.98 | 2.48 | 15.4% | 1.9% | 49.1% | 32.4% | 15.3% | |
Ivan Nova takes on a Phillies offense that owns a K rate of 22.2% (9th) against RH pitching. Based on wOBA (.322) and wRC+ (99) this is an otherwise average offense. Nova doesn’t have much strikeout upside as his 15.4% K rate is close to his career average of 17.3. He does have excellent control with a 1.9% BB rate and 49.1% ground ball rate.
Quick Breakdown: – If you are looking for a “safe” SP2, Ivan Nova is your man. He’s a safe bet to pitch deep into this game and the Phillies seem unlikely to do much damage. The only downside is that the strikeouts won’t be here if Nova does let a few runs across.
Batter Grind Down
Philadelphia
If you want to target Phillies here, LH batters are preferred as they own a 44.3% GB rate and 35.9% hard hit rate this season. I suppose that would lead to Tommy Joseph (.324 wOBA vs. RH) or Cesar Hernandez. You could also take a chance on someone like Odubel Herrera though I’ll honestly just be using Philly bats to fill in as needed.
Projected Lineup (Splits vs. RH Pitching)
| # | Player | Bats | wOBA | xwOBA | ISO | HC% | BB% | K% | GB% | FD Pos. | FD Sal. | DK Pos. | DK Sal. | FDRFT Pos. | FDRFT Sal. |
|---|---|---|---|---|---|---|---|---|---|---|---|---|---|---|---|
| 1 | Cesar Hernandez | SWITCH | 0.339 | 0.310 | 0.113 | 25.9% | 11.2% | 19.0% | 52.8% | 2B | $3,000 | 2B | $3,900 | 2B | $7,600 |
| 2 | Odubel Herrera | LEFT | 0.341 | 0.305 | 0.152 | 28.2% | 9.0% | 20.9% | 43.3% | OF | $2,900 | OF | $3,600 | IF/OF | $7,200 |
| 3 | Aaron Altherr | RIGHT | 0.308 | 0.299 | 0.151 | 32.6% | 10.4% | 31.9% | 50.0% | OF | $3,700 | OF | $4,300 | LF | $8,400 |
| 4 | Tommy Joseph | RIGHT | 0.324 | 0.321 | 0.205 | 36.8% | 5.7% | 23.2% | 41.1% | 1B | $3,700 | 1B | $4,200 | 1B | $8,100 |
| 5 | Michael Saunders | LEFT | 0.326 | 0.327 | 0.189 | 38.0% | 10.4% | 26.7% | 38.9% | OF | $2,800 | OF | $3,900 | RF | $7,600 |
| 6 | Maikel Franco | RIGHT | 0.296 | 0.323 | 0.155 | 29.4% | 6.8% | 16.2% | 44.4% | 3B | $3,400 | 3B | $4,000 | 3B | $7,600 |
| 7 | Cameron Rupp | RIGHT | 0.306 | 0.321 | 0.174 | 33.0% | 6.7% | 28.4% | 46.6% | C | $2,700 | C | $3,200 | C | $6,300 |
| 8 | Freddy Galvis | SWITCH | 0.306 | 0.274 | 0.178 | 27.8% | 5.2% | 21.5% | 40.3% | SS | $2,800 | SS | $3,200 | SS | $6,300 |
| 9 | Vince Velasquez | RIGHT | 0.167 | 0.149 | 0.000 | 6.7% | 2.3% | 29.5% | 61.5% | P | $7,900 | P | $9,200 | P | $17,600 |
Elite Plays – None
Secondary Plays – Tommy Joseph
Stackability – ORANGE – A viable stack in large field GPPs.
Pittsburgh
As I mentioned above, Vince Velasquez isn’t someone we are going out of our way to target today. In his career he does own a .332 wOBA vs LH and .323 wOBA vs. RH batters. This season, the splits are .396 to LH and .297 to RH batters. Velasquez is however getting tagged by RH batters for a 41.1% fly ball rate and 37.5% hard contact rate. We can pick and choose a couple of Pirates bats here staring with Josh Bell (.352 wOBA vs. RH). The rest of the Pirates such as Andrew McCutchen, John Jaso and Adam Frazier can be used as value plays where needed.
Projected Lineup (Splits vs. RH Pitching)
| # | Player | Bats | wOBA | xwOBA | ISO | HC% | BB% | K% | GB% | FD Pos. | FD Sal. | DK Pos. | DK Sal. | FDRFT Pos. | FDRFT Sal. |
|---|---|---|---|---|---|---|---|---|---|---|---|---|---|---|---|
| 1 | Adam Frazier | LEFT | 0.332 | 0.335 | 0.138 | 31.9% | 7.4% | 15.8% | 42.4% | OF | $3,100 | 2B/OF | $3,500 | IF/OF | $6,800 |
| 2 | Josh Harrison | RIGHT | 0.299 | 0.273 | 0.105 | 27.1% | 3.6% | 14.7% | 43.9% | 3B | $2,900 | 2B/3B | $3,700 | 2B | $7,200 |
| 3 | Andrew McCutchen | RIGHT | 0.311 | 0.330 | 0.158 | 34.8% | 9.3% | 21.4% | 36.6% | OF | $3,300 | OF | $4,100 | RF | $8,000 |
| 4 | Josh Bell | SWITCH | 0.352 | 0.353 | 0.171 | 31.7% | 12.9% | 16.5% | 50.0% | 1B | $3,000 | 1B | $4,000 | IF/OF | $7,800 |
| 5 | John Jaso | LEFT | 0.335 | 0.334 | 0.155 | 31.1% | 10.4% | 17.2% | 48.5% | 1B | $2,600 | 1B/OF | $2,900 | 1B | $5,700 |
| 6 | David Freese | RIGHT | 0.321 | 0.324 | 0.133 | 32.6% | 8.7% | 27.6% | 58.9% | 3B | $2,400 | 3B | $3,400 | 3B | $6,800 |
| 7 | Jordy Mercer | RIGHT | 0.286 | 0.295 | 0.091 | 25.4% | 8.7% | 14.4% | 49.5% | SS | $2,400 | SS | $2,900 | SS | $5,600 |
| 8 | Francisco Cervelli | RIGHT | 0.307 | 0.319 | 0.099 | 28.0% | 12.7% | 19.1% | 53.4% | C | $2,900 | C | $3,100 | C | $6,000 |
| 9 | Ivan Nova | RIGHT | 0.082 | 0.061 | 0.000 | 0.0% | 0.0% | 64.9% | 42.9% | P | $8,500 | P | $8,700 | P | $16,800 |
Elite Plays – Josh Bell
Secondary Plays – Andrew McCutchen and Adam Frazier
Stackability – YELLOW – A viable mini-stack in cash games and full stack in GPPs.
Washington at Atlanta – 4:10 PM ET
| Washington | Atlanta | ||||||||||||||
 | Max Scherzer |  | Bartolo Colon | ||||||||||||
| RIGHT | RIGHT | ||||||||||||||
| Vegas Moneyline | Vegas Over/Under | ||||||||||||||
| WAS-170 | 9.0 | ||||||||||||||
| Stats | wOBA | xwOBA | HC% | BB% | K% | GB% | Stats | wOBA | xwOBA | HC% | BB% | K% | GB% | ||
|---|---|---|---|---|---|---|---|---|---|---|---|---|---|---|---|
| SP vs. Left (2016-17) | 0.324 | 0.297 | 29.6% | 9.0% | 25.0% | 32.3% | SP vs. Left (2016-17) | 0.339 | 0.347 | 37.0% | 5.6% | 15.6% | 36.1% | ||
| SP vs. Right (2016-17) | 0.202 | 0.223 | 28.5% | 3.2% | 39.0% | 33.8% | SP vs. Right (2016-17) | 0.307 | 0.303 | 34.4% | 3.1% | 16.0% | 48.3% | ||
Pitcher Grind Down
| Max Scherzer | |||||||||
 | FanDuel | DraftKings | FantasyDraft | ||||||
| Salary: | $11,600 | Salary: | $12,600 | Salary: | $24,600 | ||||
| Salary Rank: | 1 of 30 | Salary Rank: | 1 of 30 | Salary Rank: | 1 of 30 | ||||
| Stats | Starts | SIERA | ERA | K% | BB% | GB% | HC% | SC% | |
|---|---|---|---|---|---|---|---|---|---|
| 2016 | 34 | 3.05 | 2.96 | 31.5% | 6.2% | 33.0% | 30.1% | 22.2% | |
| 2017 | 8 | 2.84 | 2.80 | 32.6% | 6.1% | 33.1% | 24.8% | 20.9% | |
Max Scherzer stands head and shoulders above the rest of the pitching options today, especially against a Braves offense that is without Freddie Freeman. On the season, Freeman accounted for roughly 17% of the Braves offense. Scherzer has a ridiculous 32.6% K rate to go with a 6.1% BB rate. The Braves check in at 20.4% K rate against RH pitching but that doesn’t matter with an elite strikeout arm like Scherzer.
Quick Breakdown: – Scherzer will easily be the highest-owned pitcher in both cash games and tournaments. He’s a tough fade though as he stands head and shoulders above the rest of the options.
| Bartolo Colon | |||||||||
 | FanDuel | DraftKings | FantasyDraft | ||||||
| Salary: | $6,600 | Salary: | $5,900 | Salary: | $11,600 | ||||
| Salary Rank: | 25 of 30 | Salary Rank: | 26 of 30 | Salary Rank: | 27 of 30 | ||||
| Stats | Starts | SIERA | ERA | K% | BB% | GB% | HC% | SC% | |
|---|---|---|---|---|---|---|---|---|---|
| 2016 | 33 | 4.37 | 3.43 | 16.2% | 4.1% | 43.2% | 35.4% | 16.2% | |
| 2017 | 8 | 4.89 | 6.80 | 14.2% | 5.8% | 37.8% | 37.1% | 20.5% | |
Bartolo Colon just keeps grinding along, even at 43 years old. Colon only throws three pitches with the bulk (83%) being fastballs. He owns a 14.2% K rate on the season and 6.8 ERA. In terms of wOBA (.347) and wRC+ (111) the Nationals are a top five offense. We obviously aren’t using Colon in this spot but we can stack up some Nationals batters.
Quick Breakdown: – There are certainly better options than Bartolo Colon in a tough matchup.
Batter Grind Down
Washington
The Nationals have the highest implied team total on the early slate. Bartolo Colon owns a .339 wOBA vs. LH and .307 wOBA vs. RH over the past two seasons. They won’t come cheap but we’ll want some Nationals exposure. That starts with Trea Turner who is way under-priced on FD at $3,600. He owns a .388 wOBA vs. RH pitching. Obviously, I don’t need to tell you that Bryce Harper and Daniel Murphy are firmly in play if you can fit them. A full Nationals stack is also an option as Colon’s numbers to either side of the plate shouldn’t scare us off anyone.
Projected Lineup (Splits vs. RH Pitching)
| # | Player | Bats | wOBA | xwOBA | ISO | HC% | BB% | K% | GB% | FD Pos. | FD Sal. | DK Pos. | DK Sal. | FDRFT Pos. | FDRFT Sal. |
|---|---|---|---|---|---|---|---|---|---|---|---|---|---|---|---|
| 1 | Trea Turner | RIGHT | 0.388 | 0.339 | 0.249 | 33.3% | 4.7% | 19.8% | 42.6% | SS | $3,600 | SS | $5,000 | IF/OF | $9,600 |
| 2 | Jayson Werth | RIGHT | 0.313 | 0.320 | 0.146 | 32.5% | 11.2% | 24.6% | 41.7% | OF | $3,500 | OF | $4,400 | LF | $8,700 |
| 3 | Bryce Harper | LEFT | 0.387 | 0.397 | 0.242 | 35.5% | 19.0% | 15.6% | 39.4% | OF | $4,800 | OF | $5,500 | RF | $10,800 |
| 4 | Ryan Zimmerman | RIGHT | 0.327 | 0.337 | 0.196 | 36.1% | 5.5% | 22.8% | 45.4% | 1B | $3,800 | 1B | $4,800 | 1B | $9,300 |
| 5 | Daniel Murphy | LEFT | 0.412 | 0.399 | 0.249 | 38.9% | 7.0% | 9.4% | 35.3% | 2B | $3,900 | 2B | $4,800 | 2B | $9,200 |
| 6 | Anthony Rendon | RIGHT | 0.338 | 0.344 | 0.180 | 35.0% | 8.9% | 18.5% | 37.7% | 3B | $3,300 | 3B | $4,100 | 3B | $8,000 |
| 7 | Matt Wieters | SWITCH | 0.313 | 0.323 | 0.169 | 33.1% | 7.0% | 18.0% | 37.3% | C | $2,800 | C | $3,500 | C | $6,900 |
| 8 | Michael Taylor | RIGHT | 0.274 | 0.265 | 0.141 | 31.2% | 5.5% | 31.4% | 43.7% | OF | $3,000 | OF | $3,900 | CF | $7,600 |
| 9 | Max Scherzer | RIGHT | 0.187 | 0.161 | 0.014 | 23.7% | 2.3% | 30.7% | 73.9% | P | $11,600 | P | $12,600 | P | $24,600 |
Elite Plays – Trea Turner, Bryce Harper and Daniel Murphy
Secondary Plays – Ryan Zimmerman and Jayson Werth
Stackability – GREEN – A viable full stack in cash games and GPPs.
Atlanta
We don’t need to waste any time here. The Braves are without Freddie Freeman and facing Max Scherzer. Obviously, we aren’t predicting a no-hitter for Scherzer but it’s hard to accurate predict which Brave might get a hit. Even in tournaments, I’ll be staying away from the Braves.
Projected Lineup (Splits vs. RH Pitching)
| # | Player | Bats | wOBA | xwOBA | ISO | HC% | BB% | K% | GB% | FD Pos. | FD Sal. | DK Pos. | DK Sal. | FDRFT Pos. | FDRFT Sal. |
|---|---|---|---|---|---|---|---|---|---|---|---|---|---|---|---|
| 1 | Ender Inciarte | LEFT | 0.315 | 0.293 | 0.115 | 27.0% | 8.6% | 14.0% | 44.0% | OF | $2,700 | OF | $3,700 | CF | $7,200 |
| 2 | Brandon Phillips | RIGHT | 0.325 | 0.302 | 0.122 | 28.5% | 3.0% | 12.0% | 47.7% | 2B | $2,300 | 2B | $3,600 | 2B | $7,200 |
| 3 | Matt Kemp | RIGHT | 0.336 | 0.351 | 0.220 | 36.7% | 5.2% | 23.8% | 39.8% | OF | $3,400 | OF | $4,100 | LF | $8,100 |
| 4 | Nick Markakis | LEFT | 0.344 | 0.365 | 0.143 | 33.6% | 11.9% | 16.6% | 40.9% | OF | $2,900 | OF | $3,600 | RF | $7,200 |
| 5 | Tyler Flowers | RIGHT | 0.362 | 0.347 | 0.132 | 41.8% | 8.9% | 26.2% | 44.0% | C | $2,500 | C | $3,100 | C | $6,000 |
| 6 | Jace Peterson | LEFT | 0.320 | 0.332 | 0.122 | 25.5% | 13.3% | 17.0% | 58.0% | 2B | $2,300 | 2B/OF | $3,100 | 2B | $6,000 |
| 7 | Dansby Swanson | RIGHT | 0.272 | 0.288 | 0.086 | 31.1% | 9.6% | 26.0% | 45.6% | SS | $2,400 | SS | $2,900 | SS | $5,600 |
| 8 | Rio Ruiz | LEFT | 0.350 | 0.410 | 0.286 | 60.0% | 0.0% | 28.6% | 20.0% | 1B | $2,000 | 3B | $2,600 | 3B | $5,200 |
| 9 | Bartolo Colon | RIGHT | 0.081 | 0.057 | 0.078 | 10.0% | 0.0% | 63.0% | 53.8% | P | $6,600 | P | $5,900 | P | $11,600 |