MLB Grind Down: Tuesday, July 31st

Jump to Page 1 2 3
The RotoGrinders MLB Grind Down will give you an in-depth analysis into the upcoming MLB schedule. This article will break down the numbers for every single game and give you analysis on which trends you can exploit. While matchups are a major factor in daily fantasy baseball, there are plenty of other factors to consider such as injuries, weather, and salaries.
The analysis should point you in the right direction, but it is still up to you to decipher the information and make your own selections. No sport has more variance than baseball. The best choice is not always the right choice but following the trends will win you money over time.
Note: As always, if you want to try a new DFS site, be sure to click through a RotoGrinders link and use our DraftKings promo code, FanDuel promo code, and FantasyDraft promo code to receive the best perks in the industry.

Stackability Rating System:
GREEN – A viable full stack in cash games and GPPs.
YELLOW – A viable mini-stack in cash games and full stack in GPPs.
ORANGE – A viable stack in large field GPPs.
RED – Not a recommended stack for cash games or GPPs.
Implied Run Totals
Ballpark Ratings
San Francisco at San Diego – 4:10 PM ET
| San Francisco | San Diego | ||||||||||||||
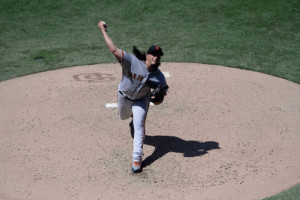
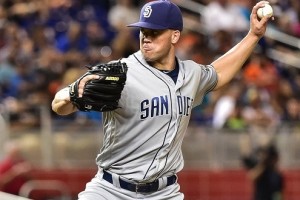
 | Dereck Rodriguez |  | Clayton Richard | ||||||||||||
| RIGHT | LEFT | ||||||||||||||
| Vegas Moneyline | Vegas Over/Under | ||||||||||||||
| SD -100 | 8.0 | ||||||||||||||
| Stats | wOBA | xwOBA | HC% | HR/9 | K% | GB% | Stats | wOBA | xwOBA | HC% | HR/9 | K% | GB% | ||
|---|---|---|---|---|---|---|---|---|---|---|---|---|---|---|---|
| SP vs. Left (2016-17) | 0.322 | 0.350 | 45.9% | 0.68 | 16.1% | 36.6% | SP vs. Left (2016-17) | 0.281 | 0.306 | 31.0% | 0.31 | 18.6% | 75.3% | ||
| SP vs. Right (2016-17) | 0.280 | 0.286 | 39.0% | 0.56 | 21.5% | 44.1% | SP vs. Right (2016-17) | 0.335 | 0.359 | 42.1% | 1.05 | 16.6% | 52.6% | ||
Pitcher Grind Down
| Dereck Rodriguez | |||||||||||
 | FanDuel | DraftKings | FantasyDraft | ||||||||
| Salary: | $8,700 | Salary: | Salary: | ||||||||
| Salary Rank: | 6 of 29 | Salary Rank: | of 29 | Salary Rank: | |||||||
| Stats | Starts | SIERA | ERA | K% | BB% | GB% | HC% | SC% | aFV | SwS% | |
|---|---|---|---|---|---|---|---|---|---|---|---|
| 2018 | 9 | 4.25 | 2.75 | 19.0% | 6.1% | 40.6% | 42.2% | 12.8% | 92.1 | 8.8% | |
| L14 | 2 | 4.03 | 2.19 | 20.4% | 4.1% | 29.4% | 57.1% | 8.6% | 91.7 | 6.5% | |
This is the only early game on the schedule, so if you are reading this, you are likely playing in the showdown slate. That’s good news because this game would be an easy fade if it was included in the main slate. Rodriguez is a talented young pitcher with decent numbers in his first nine major league starts, posting a 4.25 SIERA with a strikeout rate of 19% and a walk rate of 6%. He is playing in a pitcher-friendly ballpark and facing a strikeout-happy Padres’ offense. San Diego’s projected lineup has an average xwOBA of .304 with a strikeout rate of 25% against righties this season.
Quick Breakdown: Rodriguez is viable in the showdown slate, but avoid him if you are playing the all-day slate.
| Clayton Richard | |||||||||||
 | FanDuel | DraftKings | FantasyDraft | ||||||||
| Salary: | $7,100 | Salary: | Salary: | ||||||||
| Salary Rank: | 19 of 29 | Salary Rank: | of 29 | Salary Rank: | |||||||
| Stats | Starts | SIERA | ERA | K% | BB% | GB% | HC% | SC% | aFV | SwS% | |
|---|---|---|---|---|---|---|---|---|---|---|---|
| 2017 | 32 | 4.06 | 4.79 | 17.6% | 6.9% | 59.2% | 35.0% | 17.3% | 90.7 | 8.6% | |
| 2018 | 22 | 4.44 | 5.05 | 17.1% | 9.4% | 57.5% | 39.8% | 19.8% | 90.2 | 9.0% | |
| L14 | 3 | 6.27 | 9.64 | 12.3% | 16.9% | 57.8% | 28.3% | 23.9% | 90.6 | 5.6% | |
At one point earlier in the season, Richard had a decent SIERA and a league-average strikeout rate. His numbers have taken a big hit since then, as he now owns a 4.44 SIERA with a strikeout rate of only 17%. He still has an elite ground ball rate, but that’s a better weapon in real baseball than it is in daily fantasy baseball. The Giants aren’t the most talented offense in baseball, but they have some good right-handed hitters in their lineup (four of them have an xwOBA of at least .355 against left-handed pitching this season).
Quick Breakdown: I don’t mind targeting both pitchers in these showdown slates, but prefer Rodriguez over Richard if choosing one.
Batter Grind Down
San Francisco
The Giants have an easy matchup to break down. Clayton Richard has a massive 75% ground ball rate against lefties, which has led to a .306 xwOBA allowed. His struggles have come against batters from the right side, as he has allowed a .359 xwOBA with a 42% hard contact rate. The best targets from the Giants are going to be those that bat from the right side and have high fly-ball rates against left-handed pitching. That list includes the likes of Andrew McCutchen, Buster Posey, and Chase d’Arnaud. All three are elite plays in the showdown slate.
Projected Lineup (Splits vs. LH Pitching)
| # | Player | Bats | xwOBA | ISO | HC% | BB% | K% | GB% | FD Pos. | FD Sal. | DK Pos. | DK Sal. | FDRFT Pos. | FDRFT Sal. |
|---|---|---|---|---|---|---|---|---|---|---|---|---|---|---|
| 1 | Andrew McCutchen | RIGHT | 0.379 | 0.159 | 44.0% | 10.7% | 21.5% | 41.0% | OF | $3,500 | N/A | N/A | ||
| 2 | Buster Posey | RIGHT | 0.410 | 0.167 | 42.7% | 13.5% | 10.3% | 40.6% | C | $3,200 | N/A | N/A | ||
| 3 | Evan Longoria | RIGHT | 0.413 | 0.270 | 47.4% | 5.2% | 13.5% | 44.9% | 3B | $2,900 | N/A | N/A | ||
| 4 | Brandon Crawford | LEFT | 0.361 | 0.191 | 35.8% | 6.6% | 19.2% | 39.4% | SS | $2,900 | N/A | N/A | ||
| 5 | Austin Slater | RIGHT | 0.319 | 0.130 | 35.0% | 7.4% | 14.8% | 65.0% | OF | $2,100 | N/A | N/A | ||
| 6 | Chase d’Arnaud | RIGHT | 0.359 | 0.318 | 27.8% | 0.0% | 18.2% | 27.8% | 3B | $2,400 | N/A | N/A | ||
| 7 | Hunter Pence | RIGHT | 0.214 | 0.038 | 29.7% | 7.1% | 26.8% | 48.6% | OF | $2,100 | N/A | N/A | ||
| 8 | Gorkys Hernandez | RIGHT | 0.314 | 0.176 | 38.4% | 7.2% | 27.0% | 43.5% | OF | $2,700 | N/A | N/A | ||
| 9 | Dereck Rodriguez | RIGHT | 0.087 | 0.143 | 25.0% | 0.0% | 50.0% | 33.3% | P | $8,700 | N/A | N/A | ||
| Team Averages | 0.317 | 0.177 | 36.2% | 6.4% | 22.4% | 42.7% |
Elite Plays – Andrew McCutchen, Buster Posey, Chase d’Arnaud
Secondary Plays – Evan Longoria, Austin Slater
Stackability – YELLOW
San Diego
The Padres are the Padres, so we shouldn’t ever get too excited about using them in cash games or tournaments. Dereck Rodriguez has traditional splits for a right-handed pitcher, holding righties to a .286 xwOBA, while allowing a .350 xwOBA and a 46% hard contact rate to batters from the left side of the plate. In a full slate, this would be an easy situation to avoid, but it’s not like we are working with many options in these single-game showdown slates. Travis Jankowski and Eric Hosmer are both viable, as they both hit from the left side.
Projected Lineup (Splits vs. RH Pitching)
| # | Player | Bats | xwOBA | ISO | HC% | BB% | K% | GB% | FD Pos. | FD Sal. | DK Pos. | DK Sal. | FDRFT Pos. | FDRFT Sal. |
|---|---|---|---|---|---|---|---|---|---|---|---|---|---|---|
| 1 | Travis Jankowski | LEFT | 0.297 | 0.077 | 23.3% | 11.5% | 12.0% | 60.4% | OF | $2,100 | N/A | N/A | ||
| 2 | Manuel Margot | RIGHT | 0.299 | 0.110 | 35.3% | 9.4% | 16.2% | 48.2% | OF | $3,200 | N/A | N/A | ||
| 3 | Wil Myers | RIGHT | 0.428 | 0.237 | 52.8% | 4.0% | 24.8% | 38.9% | OF | $3,500 | N/A | N/A | ||
| 4 | Eric Hosmer | LEFT | 0.314 | 0.152 | 37.8% | 9.4% | 24.6% | 60.2% | 1B | $2,700 | N/A | N/A | ||
| 5 | Christian Villanueva | RIGHT | 0.269 | 0.141 | 28.7% | 4.7% | 25.8% | 32.9% | 3B | $2,600 | N/A | N/A | ||
| 6 | Freddy Galvis | SWITCH | 0.298 | 0.088 | 40.7% | 8.6% | 23.5% | 43.4% | SS | $2,600 | N/A | N/A | ||
| 7 | Carlos Asuaje | LEFT | 0.338 | 0.127 | 39.4% | 10.9% | 19.7% | 30.9% | 2B | $2,200 | N/A | N/A | ||
| 8 | Austin Hedges | RIGHT | 0.275 | 0.143 | 29.2% | 7.0% | 28.9% | 38.9% | C | $2,600 | N/A | N/A | ||
| 9 | Clayton Richard | LEFT | 0.219 | 0.121 | 16.7% | 2.6% | 48.7% | 53.8% | P | $7,100 | N/A | N/A | ||
| Team Averages | 0.304 | 0.133 | 33.8% | 7.6% | 24.9% | 45.3% |
Elite Plays – None
Secondary Plays – Travis Jankowski, Eric Hosmer
Stackability – ORANGE
Baltimore at NY Yankees – 7:05 PM ET
| Baltimore | NY Yankees | ||||||||||||||
 | Yefry Ramirez |  | Masahiro Tanaka | ||||||||||||
| RIGHT | RIGHT | ||||||||||||||
| Vegas Moneyline | Vegas Over/Under | ||||||||||||||
| NYY-320 | 9.0 | ||||||||||||||
| Stats | wOBA | xwOBA | HC% | HR/9 | K% | GB% | Stats | wOBA | xwOBA | HC% | HR/9 | K% | GB% | ||
|---|---|---|---|---|---|---|---|---|---|---|---|---|---|---|---|
| SP vs. Left (2016-17) | 0.348 | 0.300 | 30.3% | 1.38 | 27.1% | 32.3% | SP vs. Left (2016-17) | 0.280 | 0.324 | 31.1% | 1.17 | 22.4% | 52.4% | ||
| SP vs. Right (2016-17) | 0.264 | 0.290 | 28.6% | 1.76 | 24.1% | 47.6% | SP vs. Right (2016-17) | 0.315 | 0.324 | 40.0% | 2.17 | 26.6% | 43.0% | ||
Pitcher Grind Down
| Yefry Ramirez | |||||||||||
 | FanDuel | DraftKings | FantasyDraft | ||||||||
| Salary: | $6,300 | Salary: | $5,300 | Salary: | $10,400 | ||||||
| Salary Rank: | 24 of 29 | Salary Rank: | 25 of 29 | Salary Rank: | 25 of 29 | ||||||
| Stats | Starts | SIERA | ERA | K% | BB% | GB% | HC% | SC% | aFV | SwS% | |
|---|---|---|---|---|---|---|---|---|---|---|---|
| 2018 | 5 | 3.82 | 3.49 | 25.6% | 8.6% | 41.1% | 29.3% | 20.0% | 92.1 | 13.4% | |
| L14 | 2 | 3.50 | 2.70 | 33.3% | 10.3% | 27.3% | 31.8% | 27.3% | 92.0 | 12.4% | |
We start tonight’s 14-game slate with the Orioles and Yankees. This game is expected to be one-sided, as you can tell from the Vegas line (Yankees are -320 favorites). Ramirez has pitched well in his first five major league starts, but he’s still a rookie pitcher that is taking on one of the league’s best offenses in one of the best hitter’s parks in baseball. The risk certainly outweighs the reward here. I’ll be watching to see how Ramirez handles himself in this spot, but I’ll side with the elite offense playing at home in this one.
Quick Breakdown: Avoid Ramirez in both cash games and tournaments.
| Masahiro Tanaka | |||||||||||
 | FanDuel | DraftKings | FantasyDraft | ||||||||
| Salary: | $9,400 | Salary: | $10,300 | Salary: | $19,400 | ||||||
| Salary Rank: | 4 of 29 | Salary Rank: | 4 of 29 | Salary Rank: | 4 of 29 | ||||||
| Stats | Starts | SIERA | ERA | K% | BB% | GB% | HC% | SC% | aFV | SwS% | |
|---|---|---|---|---|---|---|---|---|---|---|---|
| 2017 | 30 | 3.52 | 4.74 | 25.8% | 5.5% | 49.2% | 31.4% | 19.5% | 92.2 | 15.1% | |
| 2018 | 16 | 3.60 | 4.09 | 24.9% | 6.2% | 46.9% | 36.3% | 18.7% | 91.7 | 13.9% | |
| L14 | 2 | 2.58 | 1.17 | 25.9% | 3.7% | 58.3% | 42.1% | 18.4% | 91.4 | 13.2% | |
It didn’t take long for us to arrive at my favorite pitching option of the slate. While Tanaka doesn’t quite have as high of a raw projection as Trevor Bauer, he’s considerably cheaper across the industry. He’s coming off of a complete game shutout against the Rays and now gets to face an Orioles’ offense that will be limping its way to the finish line here in the second half of the season. Baltimore’s projected lineup has seven righties in it and an average xwOBA of .305 with a strikeout rate of 25% against right-handed pitching.
Quick Breakdown: Tanaka will garner ownership, but the size of the slate will help it from getting too outrageous. He’s my top pitching option of the slate.
Batter Grind Down
Baltimore
The Orioles are a team that I will be streaming pitchers against the rest of the season. We already were targeting righties against them before the Manny Machado trade and now we can target southpaws against them as well. Masahiro Tanaka is an above-average pitcher in every aspect except for one — he allows a lot of home runs (18 in 16 starts this season). With this game being played in Yankee Stadium, it wouldn’t surprise me to see a solo shot or two off of Tanaka. If you want to go that route in tournaments, Adam Jones and Jonathan Schoop both have three home runs off of Tanaka in their respective careers.
Projected Lineup (Splits vs. RH Pitching)
| # | Player | Bats | xwOBA | ISO | HC% | BB% | K% | GB% | FD Pos. | FD Sal. | DK Pos. | DK Sal. | FDRFT Pos. | FDRFT Sal. |
|---|---|---|---|---|---|---|---|---|---|---|---|---|---|---|
| 1 | Tim Beckham | RIGHT | 0.272 | 0.077 | 26.5% | 4.6% | 27.5% | 46.5% | SS | $3,100 | 3B/SS | $3,300 | SS | $6,300 |
| 2 | Jonathan Schoop | RIGHT | 0.260 | 0.218 | 27.0% | 2.0% | 22.6% | 45.7% | 2B | $3,800 | 2B | $4,200 | 2B | $8,400 |
| 3 | Adam Jones | RIGHT | 0.326 | 0.172 | 32.0% | 3.3% | 18.4% | 40.6% | OF | $3,200 | OF | $4,100 | CF | $8,000 |
| 4 | Mark Trumbo | RIGHT | 0.358 | 0.197 | 41.0% | 7.1% | 24.7% | 38.8% | OF | $2,900 | OF | $3,400 | DH | $6,600 |
| 5 | Chris Davis | LEFT | 0.296 | 0.118 | 33.8% | 7.6% | 35.6% | 41.6% | 1B | $2,600 | 1B | $3,400 | IF/OF | $6,500 |
| 6 | Trey Mancini | RIGHT | 0.364 | 0.155 | 33.5% | 9.0% | 24.3% | 51.7% | OF | $2,400 | 1B/OF | $3,400 | IF/OF | $6,300 |
| 7 | Joey Rickard | RIGHT | 0.283 | 0.133 | 29.2% | 7.6% | 18.2% | 43.8% | OF | $2,300 | OF | $2,800 | RF | $5,700 |
| 8 | Jace Peterson | LEFT | 0.310 | 0.157 | 31.4% | 12.1% | 25.5% | 47.6% | OF | $2,100 | 3B/OF | $3,500 | 2B | $6,500 |
| 9 | Caleb Joseph | RIGHT | 0.276 | 0.172 | 24.2% | 3.1% | 28.6% | 40.0% | C | $2,200 | C | $2,900 | C | $5,800 |
| Team Averages | 0.305 | 0.155 | 31.0% | 6.3% | 25.0% | 44.0% |
Elite Plays – None
Secondary Plays – Adam Jones (GPP), Jonathan Schoop (GPP)
Stackability – ORANGE
NY Yankees
The Yankees don’t have a great matchup on paper, but Yefry Ramirez only has five career major league starts under his belt. While his strikeout rate is impressive, he doesn’t have great control and he is a fly-ball pitcher. If the Yankees are patient, they should get good pitches to hit. While I won’t be using New York as a full stack, I see the lefties in this lineup as elite tournament plays. Ramirez has a 15% lower ground ball rate when facing a left-handed hitter and we obviously know about the short porch in right field in Yankee Stadium.
Projected Lineup (Splits vs. RH Pitching)
| # | Player | Bats | xwOBA | ISO | HC% | BB% | K% | GB% | FD Pos. | FD Sal. | DK Pos. | DK Sal. | FDRFT Pos. | FDRFT Sal. |
|---|---|---|---|---|---|---|---|---|---|---|---|---|---|---|
| 1 | Brett Gardner | LEFT | 0.302 | 0.157 | 28.6% | 11.7% | 14.7% | 51.6% | OF | $3,400 | OF | $4,400 | LF | $8,200 |
| 2 | Giancarlo Stanton | RIGHT | 0.307 | 0.180 | 34.6% | 7.8% | 32.8% | 51.3% | OF | $4,300 | OF | $4,900 | RF | $9,100 |
| 3 | Didi Gregorius | LEFT | 0.348 | 0.255 | 38.9% | 8.3% | 13.0% | 34.3% | SS | $3,700 | SS | $4,900 | SS | $8,900 |
| 4 | Aaron Hicks | SWITCH | 0.352 | 0.182 | 38.5% | 14.0% | 19.3% | 44.9% | OF | $3,500 | OF | $4,700 | CF | $9,300 |
| 5 | Gleyber Torres | RIGHT | 0.380 | 0.231 | 38.3% | 6.3% | 26.7% | 30.7% | 2B | $3,700 | 2B | $4,300 | 2B | $8,400 |
| 6 | Greg Bird | LEFT | 0.325 | 0.250 | 42.4% | 8.3% | 26.4% | 36.3% | 1B | $3,400 | 1B | $4,200 | 1B | $8,100 |
| 7 | Miguel Andujar | RIGHT | 0.347 | 0.177 | 37.6% | 3.8% | 17.2% | 50.2% | 3B | $3,400 | 3B | $4,200 | 3B | $8,300 |
| 8 | Neil Walker | SWITCH | 0.344 | 0.099 | 36.2% | 10.8% | 22.1% | 39.1% | 2B | $2,700 | 1B/2B | $3,900 | 2B | $7,200 |
| 9 | Austin Romine | RIGHT | 0.343 | 0.223 | 35.1% | 10.2% | 21.3% | 42.5% | C | $2,500 | C | $3,400 | C | $6,500 |
| Team Averages | 0.339 | 0.195 | 36.7% | 9.0% | 21.5% | 42.3% |
Elite Plays – Aaron Hicks, Didi Gregorius (GPP), Greg Bird (GPP)
Secondary Plays – Didi Gregorius (Cash), Greg Bird (Cash), Brett Gardner, Gleyber Torres
Stackability – YELLOW
Chicago Cubs at Pittsburgh – 7:05 PM ET
| Chicago Cubs | Pittsburgh | ||||||||||||||
 | Jon Lester |  | Jameson Taillon | ||||||||||||
| LEFT | RIGHT | ||||||||||||||
| Vegas Moneyline | Vegas Over/Under | ||||||||||||||
| PIT-105 | 7.5 | ||||||||||||||
| Stats | wOBA | xwOBA | HC% | HR/9 | K% | GB% | Stats | wOBA | xwOBA | HC% | HR/9 | K% | GB% | ||
|---|---|---|---|---|---|---|---|---|---|---|---|---|---|---|---|
| SP vs. Left (2016-17) | 0.347 | 0.365 | 32.9% | 1.67 | 19.8% | 39.2% | SP vs. Left (2016-17) | 0.321 | 0.313 | 31.7% | 0.94 | 18.6% | 49.1% | ||
| SP vs. Right (2016-17) | 0.294 | 0.359 | 34.8% | 1.06 | 18.9% | 37.7% | SP vs. Right (2016-17) | 0.265 | 0.269 | 30.9% | 0.89 | 27.8% | 49.7% | ||
Pitcher Grind Down
| Jon Lester | |||||||||||
 | FanDuel | DraftKings | FantasyDraft | ||||||||
| Salary: | $8,200 | Salary: | $8,300 | Salary: | $16,200 | ||||||
| Salary Rank: | 10 of 29 | Salary Rank: | 10 of 29 | Salary Rank: | 10 of 29 | ||||||
| Stats | Starts | SIERA | ERA | K% | BB% | GB% | HC% | SC% | aFV | SwS% | |
|---|---|---|---|---|---|---|---|---|---|---|---|
| 2017 | 32 | 4.07 | 4.33 | 23.6% | 7.9% | 46.2% | 28.1% | 21.4% | 91.1 | 11.0% | |
| 2018 | 21 | 4.70 | 3.06 | 19.1% | 9.2% | 38.0% | 34.4% | 15.8% | 90.9 | 8.3% | |
| L14 | 3 | 4.73 | 7.53 | 22.1% | 11.8% | 31.0% | 43.2% | 18.2% | 91.4 | 7.2% | |
Lester has been one of the luckiest pitchers in baseball this season. Even though his numbers are down across the board, he’s managed to post an ERA of 3.06. I’ve been harping on regression for the last month and we are finally starting to see it come to fruition (ERA over seven in his last three starts). I would much rather bet on cheap pitchers that should positively regress instead of overpriced pitchers that have been lucky thus far. There are some strikeouts to be had in the Pirates’ offense, but their projected lineup has a .325 xwOBA against southpaws this season.
Quick Breakdown: Avoid Lester in all formats. Don’t fall for the low ERA trap.
| Jameson Taillon | |||||||||||
 | FanDuel | DraftKings | FantasyDraft | ||||||||
| Salary: | $8,900 | Salary: | $7,800 | Salary: | $15,300 | ||||||
| Salary Rank: | 5 of 29 | Salary Rank: | 11 of 29 | Salary Rank: | 12 of 29 | ||||||
| Stats | Starts | SIERA | ERA | K% | BB% | GB% | HC% | SC% | aFV | SwS% | |
|---|---|---|---|---|---|---|---|---|---|---|---|
| 2017 | 25 | 4.24 | 4.44 | 21.3% | 7.8% | 47.3% | 29.6% | 22.1% | 95.3 | 8.2% | |
| 2018 | 21 | 3.73 | 3.73 | 23.1% | 6.5% | 49.4% | 31.3% | 19.7% | 95.2 | 10.2% | |
| L14 | 2 | 3.55 | 2.19 | 21.6% | 3.9% | 47.4% | 31.6% | 15.8% | 95.1 | 10.1% | |
Taillon always seems to fly under the radar, even though his skill set is exactly what we are looking for in a pitcher. In 21 starts this season, he has a 3.73 SIERA, a 23% strikeout rate, a 7% walk rate, and a 49% ground ball rate. He’s above-average in all four of those key statistics. He’s pitching at home in a good ballpark and he’s facing a Cubs’ offense that has disappeared at times this season. I won’t go as far as to say Taillon is a core play tonight, but he’s certainly on my radar for tournaments.
Quick Breakdown: Taillon is an excellent SP2 for tournaments tonight on DraftKings.
Batter Grind Down
Chicago Cubs
The Cubs aren’t an offense that I love to fire up when playing in pitcher-friendly ballparks. They have some good hitters in their lineup, but it feels like they have underperformed to this point. They have a low implied run total tonight, as they square off against Jameson Taillon. In addition to having above-average ground ball and strikeout rates, he has held both left and right-handed hitters under a .320 xwOBA and under a 32% hard contact rate. In a 14-game slate, we can easily find better matchups to exploit.
Projected Lineup (Splits vs. RH Pitching)
| # | Player | Bats | xwOBA | ISO | HC% | BB% | K% | GB% | FD Pos. | FD Sal. | DK Pos. | DK Sal. | FDRFT Pos. | FDRFT Sal. |
|---|---|---|---|---|---|---|---|---|---|---|---|---|---|---|
| 1 | Anthony Rizzo | LEFT | 0.396 | 0.195 | 35.2% | 12.0% | 10.0% | 37.8% | 1B | $4,000 | 1B | $4,900 | 1B | $8,700 |
| 2 | Ben Zobrist | SWITCH | 0.362 | 0.144 | 33.5% | 14.7% | 12.9% | 44.1% | 2B | $2,600 | 2B/OF | $4,700 | IF/OF | $9,300 |
| 3 | Jason Heyward | LEFT | 0.357 | 0.160 | 32.9% | 9.0% | 10.2% | 42.5% | OF | $2,900 | OF | $4,000 | RF | $7,300 |
| 4 | Javier Baez | RIGHT | 0.337 | 0.255 | 38.2% | 3.1% | 28.1% | 43.9% | 2B | $3,700 | 2B/SS | $5,100 | 2B | $9,900 |
| 5 | Willson Contreras | RIGHT | 0.314 | 0.153 | 31.0% | 7.8% | 19.6% | 50.0% | C | $2,800 | C | $4,200 | IF/OF | $8,100 |
| 6 | Kyle Schwarber | LEFT | 0.384 | 0.288 | 43.4% | 16.1% | 25.6% | 41.7% | OF | $3,100 | OF | $4,200 | IF/OF | $8,500 |
| 7 | Addison Russell | RIGHT | 0.296 | 0.097 | 32.8% | 8.7% | 22.6% | 41.0% | SS | $2,600 | SS | $3,500 | SS | $6,300 |
| 8 | Jon Lester | LEFT | 0.266 | 0.100 | 25.9% | 0.0% | 25.0% | 76.2% | P | $8,200 | P | $8,300 | P | $16,200 |
| 9 | David Bote | RIGHT | 0.437 | 0.217 | 33.3% | 14.8% | 18.5% | 66.7% | 3B | $2,600 | 2B/3B | $3,600 | 3B | $7,500 |
| Team Averages | 0.350 | 0.179 | 34.0% | 9.6% | 19.2% | 49.3% |
Elite Plays – None
Secondary Plays – None
Stackability – ORANGE
Pittsburgh
The Pirates are the preferred offense to target tonight and they should fly under the radar since Jon Lester still carries a lot of name value. As mentioned above, he’s been very lucky this season. He has allowed a .294 wOBA to righties, but his expected wOBA is sitting at .359 with a hard contact rate of 35%. This isn’t a spot where I want to load up on the Pirates, Jordan Luplow, Starling Marte, David Freese, and Josh Harrison are all viable as the final piece into your lineups.
Projected Lineup (Splits vs. LH Pitching)
| # | Player | Bats | xwOBA | ISO | HC% | BB% | K% | GB% | FD Pos. | FD Sal. | DK Pos. | DK Sal. | FDRFT Pos. | FDRFT Sal. |
|---|---|---|---|---|---|---|---|---|---|---|---|---|---|---|
| 1 | Jordan Luplow | RIGHT | 0.353 | 0.250 | 10.0% | 0.0% | 16.7% | 10.0% | OF | $2,500 | OF | $3,700 | LF | $7,200 |
| 2 | Starling Marte | RIGHT | 0.352 | 0.228 | 32.2% | 8.0% | 24.1% | 55.2% | OF | $3,500 | OF | $5,000 | CF | $9,500 |
| 3 | Gregory Polanco | LEFT | 0.296 | 0.205 | 32.7% | 11.1% | 24.4% | 33.3% | OF | $3,700 | OF | $4,600 | RF | $9,400 |
| 4 | David Freese | RIGHT | 0.372 | 0.065 | 38.3% | 11.2% | 21.3% | 56.7% | 3B | $2,500 | 1B/3B | $3,700 | 3B | $7,200 |
| 5 | Josh Bell | SWITCH | 0.314 | 0.129 | 27.7% | 13.9% | 21.8% | 41.5% | 1B | $2,700 | 1B | $3,900 | 1B | $7,700 |
| 6 | Francisco Cervelli | RIGHT | 0.361 | 0.150 | 34.5% | 16.7% | 22.9% | 34.5% | C | $2,500 | C | $3,500 | C | $6,800 |
| 7 | Josh Harrison | RIGHT | 0.322 | 0.148 | 39.2% | 4.6% | 15.4% | 33.3% | 2B | $2,900 | 2B | $3,600 | 2B | $7,400 |
| 8 | Jordy Mercer | RIGHT | 0.347 | 0.143 | 33.9% | 5.9% | 15.3% | 33.8% | SS | $2,200 | SS | $3,300 | SS | $6,700 |
| 9 | Jameson Taillon | RIGHT | 0.206 | 0.000 | 0.0% | 14.3% | 42.9% | 100.0% | P | $8,900 | P | $7,800 | P | $15,300 |
| Team Averages | 0.325 | 0.146 | 27.6% | 9.5% | 22.8% | 44.3% |
Elite Plays – None
Secondary Plays – Jordan Luplow, Starling Marte, David Freese, Josh Harrison
Stackability – ORANGE / YELLOW
NY Mets at Washington – 7:05 PM ET
| NY Mets | Washington | ||||||||||||||
 | Steven Matz |  | Tanner Roark | ||||||||||||
| LEFT | RIGHT | ||||||||||||||
| Vegas Moneyline | Vegas Over/Under | ||||||||||||||
| WAS-180 | 9.0 | ||||||||||||||
| Stats | wOBA | xwOBA | HC% | HR/9 | K% | GB% | Stats | wOBA | xwOBA | HC% | HR/9 | K% | GB% | ||
|---|---|---|---|---|---|---|---|---|---|---|---|---|---|---|---|
| SP vs. Left (2016-17) | 0.303 | 0.286 | 11.3% | 0.74 | 18.1% | 69.6% | SP vs. Left (2016-17) | 0.332 | 0.327 | 27.2% | 1.19 | 24.3% | 40.7% | ||
| SP vs. Right (2016-17) | 0.327 | 0.324 | 37.1% | 1.63 | 22.2% | 43.8% | SP vs. Right (2016-17) | 0.313 | 0.361 | 30.9% | 1.02 | 17.1% | 44.6% | ||
Pitcher Grind Down
| Steven Matz | |||||||||||
 | FanDuel | DraftKings | FantasyDraft | ||||||||
| Salary: | $7,500 | Salary: | $6,900 | Salary: | $14,000 | ||||||
| Salary Rank: | 15 of 29 | Salary Rank: | 16 of 29 | Salary Rank: | 16 of 29 | ||||||
| Stats | Starts | SIERA | ERA | K% | BB% | GB% | HC% | SC% | aFV | SwS% | |
|---|---|---|---|---|---|---|---|---|---|---|---|
| 2017 | 13 | 4.71 | 6.08 | 16.1% | 6.4% | 47.1% | 32.9% | 21.9% | 93.1 | 7.1% | |
| 2018 | 20 | 4.28 | 3.79 | 21.3% | 8.8% | 49.7% | 31.2% | 17.7% | 93.3 | 8.3% | |
| L14 | 2 | 3.93 | 7.36 | 24.5% | 6.1% | 32.4% | 29.4% | 20.6% | 93.5 | 11.1% | |
Matz has had a decent year overall, posting a 4.28 SIERA with a strikeout rate of 21% and a ground ball rate of 50%. He has been incredibly tough on lefties, which could come in handy against the Nationals, who often have three or four lefties in their lineup when facing southpaws. With that said, Matz is a large underdog on the road in a game that features a total of 9.0 runs. There are a handful of pitchers that I would target before clicking Matz’s name in cash games and tournaments.
Quick Breakdown: Matz just doesn’t make the final cut tonight.
| Tanner Roark | |||||||||||
 | FanDuel | DraftKings | FantasyDraft | ||||||||
| Salary: | $7,600 | Salary: | $9,100 | Salary: | $17,500 | ||||||
| Salary Rank: | 14 of 29 | Salary Rank: | 7 of 29 | Salary Rank: | 7 of 29 | ||||||
| Stats | Starts | SIERA | ERA | K% | BB% | GB% | HC% | SC% | aFV | SwS% | |
|---|---|---|---|---|---|---|---|---|---|---|---|
| 2017 | 30 | 4.31 | 4.67 | 21.4% | 8.3% | 48.2% | 27.8% | 16.7% | 92.2 | 10.1% | |
| 2018 | 20 | 4.35 | 4.55 | 20.7% | 8.4% | 42.7% | 29.1% | 19.2% | 91.3 | 9.0% | |
| L14 | 2 | 2.97 | 2.77 | 30.2% | 5.7% | 47.1% | 20.6% | 26.5% | 92.1 | 12.4% | |
Roark’s 11-strikeout performance against the Brewers the other night came out of nowhere. Before that start, he hadn’t topped 17 fantasy points in any of his previous ten outings. I don’t know about you, but I tend to trust the season long stats over a single outlier performance when looking to predict future fantasy production. The Mets may not have a lot of superstars on their roster, but they’ve been decent against right-handed pitching this season. Their projected lineup has an average xwOBA of .338 with a 13% walk rate against right-handed pitching.
Quick Breakdown: I’m expecting the old Roark to make an appearance tonight. I will be looking elsewhere.
Batter Grind Down
NY Mets
Even though I have no interest in Tanner Roark, that doesn’t automatically mean that I will be loading up on the Mets’ offense. We have to keep in mind that there are 14 games on the schedule. If you don’t feel great about a specific play, don’t hesitate to go with another option. There is no shortage of plays in these big slates. On the season, Roark has allowed a .325+ xwOBA to both lefties and righties, but he has done a nice job of limiting hard contact and this game is being played in a pitcher-friendly ballpark.
Projected Lineup (Splits vs. RH Pitching)
| # | Player | Bats | xwOBA | ISO | HC% | BB% | K% | GB% | FD Pos. | FD Sal. | DK Pos. | DK Sal. | FDRFT Pos. | FDRFT Sal. |
|---|---|---|---|---|---|---|---|---|---|---|---|---|---|---|
| 1 | Amed Rosario | RIGHT | 0.284 | 0.123 | 27.3% | 5.3% | 19.5% | 48.9% | SS | $2,700 | SS | $3,000 | SS | $5,900 |
| 2 | Brandon Nimmo | LEFT | 0.370 | 0.249 | 36.6% | 13.3% | 27.5% | 35.4% | OF | $3,300 | OF | $4,200 | LF | $8,200 |
| 3 | Wilmer Flores | RIGHT | 0.321 | 0.227 | 35.7% | 8.2% | 8.8% | 36.4% | 1B | $2,800 | 1B/3B | $3,200 | 3B | $6,400 |
| 4 | Michael Conforto | LEFT | 0.349 | 0.154 | 35.4% | 17.0% | 20.8% | 38.5% | OF | $3,300 | OF | $4,200 | LF | $8,500 |
| 5 | Jose Bautista | RIGHT | 0.346 | 0.179 | 43.2% | 15.1% | 29.5% | 30.9% | OF | $2,700 | 3B/OF | $3,600 | IF/OF | $7,600 |
| 6 | Jeff McNeil | LEFT | 0.484 | 0.000 | 0.0% | 33.3% | 0.0% | 50.0% | 2B | $2,200 | 2B/3B | $3,100 | 2B | $5,900 |
| 7 | Devin Mesoraco | RIGHT | 0.324 | 0.182 | 33.6% | 6.2% | 18.6% | 31.1% | C | $2,600 | C | $3,000 | C | $5,800 |
| 8 | Luis Guillorme | LEFT | 0.345 | 0.027 | 28.6% | 14.0% | 4.7% | 54.3% | 3B | $2,100 | 2B/3B | $2,700 | 2B | $5,700 |
| 9 | Steven Matz | LEFT | 0.222 | 0.042 | 9.5% | 0.0% | 19.2% | 47.4% | P | $7,500 | P | $6,900 | P | $14,000 |
| Team Averages | 0.338 | 0.131 | 27.8% | 12.5% | 16.5% | 41.4% |
Elite Plays – None
Secondary Plays – Brandon Nimmo, Michael Conforto, Jose Bautista
Stackability – ORANGE
Washington
Bryce Harper said that he is available and the whole internet is waiting for news to drop. Whether or not he gets traded before this game, we want to avoid all of the lefties in this lineup. Steven Matz has held batters from the left side of the plate to a .286 xwOBA on a 70% ground ball rate. His numbers against righties are significantly worse, allowing a .324 xwOBA and a 37% hard contact rate. Even more important is the fact that he’s ranked dead last in this slate when it comes to holding runners. I love this spot for Trea Turner and don’t mind pairing him up with Ryan Zimmerman or Mark Reynolds, who are both cheap across the industry.
Projected Lineup (Splits vs. LH Pitching)
| # | Player | Bats | xwOBA | ISO | HC% | BB% | K% | GB% | FD Pos. | FD Sal. | DK Pos. | DK Sal. | FDRFT Pos. | FDRFT Sal. |
|---|---|---|---|---|---|---|---|---|---|---|---|---|---|---|
| 1 | Trea Turner | RIGHT | 0.371 | 0.133 | 34.1% | 11.8% | 11.8% | 40.4% | SS | $3,800 | SS | $4,300 | IF/OF | $8,400 |
| 2 | Bryce Harper | LEFT | 0.392 | 0.215 | 36.8% | 19.0% | 24.1% | 46.1% | OF | $4,200 | OF | $4,900 | RF | $9,000 |
| 3 | Ryan Zimmerman | RIGHT | 0.373 | 0.216 | 40.6% | 11.9% | 11.9% | 43.8% | 1B | $2,900 | 1B | $4,000 | 1B | $7,200 |
| 4 | Mark Reynolds | RIGHT | 0.331 | 0.167 | 38.2% | 10.9% | 27.3% | 52.9% | 1B | $2,500 | 1B/3B | $3,500 | 1B | $6,500 |
| 5 | Juan Soto | LEFT | 0.390 | 0.327 | 37.5% | 13.3% | 20.0% | 56.4% | OF | $3,800 | OF | $5,000 | LF | $9,600 |
| 6 | Michael Taylor | RIGHT | 0.269 | 0.156 | 39.3% | 7.1% | 35.7% | 52.7% | OF | $2,500 | OF | $3,700 | CF | $7,500 |
| 7 | Daniel Murphy | LEFT | 0.337 | 0.043 | 14.3% | 7.7% | 11.5% | 38.1% | 2B | $3,100 | 1B/2B | $3,900 | 2B | $7,700 |
| 8 | Matt Wieters | SWITCH | 0.436 | 0.143 | 42.9% | 19.2% | 26.9% | 35.7% | C | $2,500 | C | $3,000 | C | $5,600 |
| 9 | Tanner Roark | RIGHT | 0.245 | 0.000 | 21.4% | 0.0% | 17.6% | 75.0% | P | $7,600 | P | $9,100 | P | $17,500 |
| Team Averages | 0.349 | 0.156 | 33.9% | 11.2% | 20.8% | 49.0% |
Elite Plays – Trea Turner
Secondary Plays – Ryan Zimmerman, Mark Reynolds
Stackability – ORANGE / YELLOW
Cincinnati at Detroit – 7:10 PM ET
| Cincinnati | Detroit | ||||||||||||||
 | Homer Bailey |  | Matt Boyd | ||||||||||||
| RIGHT | LEFT | ||||||||||||||
| Vegas Moneyline | Vegas Over/Under | ||||||||||||||
| DET-125 | 9.0 | ||||||||||||||
| Stats | wOBA | xwOBA | HC% | HR/9 | K% | GB% | Stats | wOBA | xwOBA | HC% | HR/9 | K% | GB% | ||
|---|---|---|---|---|---|---|---|---|---|---|---|---|---|---|---|
| SP vs. Left (2016-17) | 0.369 | 0.382 | 33.6% | 2.14 | 14.4% | 40.7% | SP vs. Left (2016-17) | 0.303 | 0.268 | 42.1% | 1.33 | 25.0% | 34.2% | ||
| SP vs. Right (2016-17) | 0.384 | 0.428 | 51.2% | 1.80 | 14.6% | 39.0% | SP vs. Right (2016-17) | 0.292 | 0.306 | 36.1% | 0.87 | 20.8% | 33.3% | ||
Pitcher Grind Down
| Homer Bailey | |||||||||||
 | FanDuel | DraftKings | FantasyDraft | ||||||||
| Salary: | $5,800 | Salary: | $4,200 | Salary: | $8,200 | ||||||
| Salary Rank: | 28 of 29 | Salary Rank: | 27 of 29 | Salary Rank: | 27 of 29 | ||||||
| Stats | Starts | SIERA | ERA | K% | BB% | GB% | HC% | SC% | aFV | SwS% | |
|---|---|---|---|---|---|---|---|---|---|---|---|
| 2017 | 18 | 5.19 | 6.43 | 16.0% | 10.0% | 44.6% | 31.0% | 16.5% | 93.5 | 9.3% | |
| 2018 | 13 | 5.14 | 6.29 | 14.5% | 8.2% | 39.8% | 42.9% | 13.9% | 93.0 | 8.3% | |
| L14 | 1 | 3.20 | 2.70 | 30.8% | 7.7% | 25.0% | 37.5% | 12.5% | 94.6 | 14.8% | |
Bailey is coming off of his best start of the year, striking out eight batters against the Cardinals in nearly seven innings of work. Much like Tanner Roark, I will be trusting the larger sample size of data over a single outlier performance. It wouldn’t shock me in the slightest if Bailey came out and gave up six runs in three innings tonight against the Tigers. While Detroit is typically an offense that we like to target pitchers against, I would much rather take my chances with a stack against Bailey.
Quick Breakdown: Avoid Bailey in all formats and hope he lives up to his birth name.
| Matt Boyd | |||||||||||
 | FanDuel | DraftKings | FantasyDraft | ||||||||
| Salary: | $6,500 | Salary: | $7,300 | Salary: | $14,600 | ||||||
| Salary Rank: | 23 of 29 | Salary Rank: | 14 of 29 | Salary Rank: | 15 of 29 | ||||||
| Stats | Starts | SIERA | ERA | K% | BB% | GB% | HC% | SC% | aFV | SwS% | |
|---|---|---|---|---|---|---|---|---|---|---|---|
| 2017 | 25 | 4.94 | 5.27 | 18.2% | 8.8% | 38.1% | 34.6% | 21.0% | 92.0 | 10.0% | |
| 2018 | 20 | 4.36 | 4.53 | 21.8% | 8.3% | 33.5% | 37.6% | 20.1% | 89.6 | 10.1% | |
| L14 | 2 | 2.96 | 2.45 | 28.3% | 4.4% | 50.0% | 51.6% | 16.1% | 91.1 | 11.9% | |
Boyd is coming off of two solid starts, but he’s not a pitcher that I trust in the long run. In 20 starts this season, he has a 4.36 SIERA with a strikeout rate of 22%. He’s a fly-ball pitcher that gives up a lot of hard contact. The good news is that he’ll face one less potent righty tonight, as the Reds traded Adam Duvall to the Braves. If he can find a way to pitch around Eugenio Suarez and Tucker Barnhart, I could see a nice outing from Boyd tonight. The run support should certainly be there with Homer Bailey pitching opposite him.
Quick Breakdown: If building multiple tournament lineups, Boyd becomes a viable SP2.
Batter Grind Down
Cincinnati
The Reds get to use the DH in this series and are facing a hittable southpaw, but I surprisingly have very little interest in their offense. On the season, Matt Boyd has managed to hold both left and right-handed hitters under a .310 xwOBA. He also has a 21%+ k-rate against batters from both sides of the plate. The one batter that stands out as a nice one-off play is Eugenio Suarez, who has a .492 xwOBA, a .341 ISO, and a 56% hard contact rate against southpaws this season. Those are truly elite numbers we shouldn’t sleep on him in DFS.
Projected Lineup (Splits vs. LH Pitching)
| # | Player | Bats | xwOBA | ISO | HC% | BB% | K% | GB% | FD Pos. | FD Sal. | DK Pos. | DK Sal. | FDRFT Pos. | FDRFT Sal. |
|---|---|---|---|---|---|---|---|---|---|---|---|---|---|---|
| 1 | Jose Peraza | RIGHT | 0.289 | 0.071 | 24.3% | 3.4% | 5.9% | 42.7% | SS | $3,000 | SS | $3,900 | SS | $7,500 |
| 2 | Scooter Gennett | LEFT | 0.311 | 0.179 | 44.2% | 3.4% | 24.4% | 35.7% | 2B | $3,700 | 2B | $4,500 | 2B | $9,400 |
| 3 | Joey Votto | LEFT | 0.375 | 0.098 | 41.3% | 15.4% | 20.1% | 43.5% | 1B | $3,800 | 1B | $4,400 | 1B | $8,100 |
| 4 | Eugenio Suarez | RIGHT | 0.492 | 0.341 | 55.9% | 16.5% | 16.5% | 36.8% | 3B | $4,100 | 3B | $4,900 | 3B | $8,700 |
| 5 | Tucker Barnhart | SWITCH | 0.340 | 0.150 | 39.5% | 12.7% | 25.4% | 57.1% | C | $2,700 | C | $3,800 | C | $7,600 |
| 6 | Phillip Ervin | RIGHT | 0.294 | 0.222 | 50.0% | 10.0% | 30.0% | 50.0% | OF | $2,400 | OF | $3,800 | RF | $7,600 |
| 7 | Brandon Dixon | RIGHT | 0.171 | 0.000 | 20.0% | 6.7% | 26.7% | 66.7% | 2B | $2,300 | 1B/2B | $2,800 | 2B | $5,700 |
| 8 | Mason Williams | LEFT | OF | $2,300 | OF | $3,200 | CF | $6,800 | ||||||
| 9 | Billy Hamilton | SWITCH | 0.262 | 0.116 | 28.1% | 8.5% | 30.9% | 27.3% | OF | $2,300 | OF | $3,300 | CF | $6,300 |
| Team Averages | 0.317 | 0.147 | 37.9% | 9.6% | 22.5% | 45.0% |
Elite Plays – Eugenio Suarez
Secondary Plays – Jose Peraza
Stackability – ORANGE / YELLOW
Detroit
The Tigers are one way to create some leverage on the field tonight in tournaments. Far too often, inexperienced DFS players will target low-owned players in bad matchups. The key to differentiation is to target good plays in spots that are flying under the radar. The Tigers fit that mold tonight, as they square off against Homer Bailey. In addition to a low strikeout rate and a high fly-ball rate, Bailey has allowed a .380+ xwOBA and a 34%+ hard contact rate to both left and right-handed hitters. I don’t want to mess around with the bottom of this Tigers’ lineup, but have my eye on the one-through-four stack — Leonys Martin, Jeimer Candelario, Nick Castellanos, and Niko Goodrum.
Projected Lineup (Splits vs. RH Pitching)
| # | Player | Bats | xwOBA | ISO | HC% | BB% | K% | GB% | FD Pos. | FD Sal. | DK Pos. | DK Sal. | FDRFT Pos. | FDRFT Sal. |
|---|---|---|---|---|---|---|---|---|---|---|---|---|---|---|
| 1 | Leonys Martin | LEFT | 0.398 | 0.164 | 41.9% | 10.5% | 21.5% | 38.7% | OF | $2,900 | OF | $3,900 | CF | $7,600 |
| 2 | Jeimer Candelario | SWITCH | 0.301 | 0.202 | 34.6% | 11.9% | 24.6% | 38.2% | 3B | $3,200 | 3B | $4,100 | 3B | $8,400 |
| 3 | Nick Castellanos | RIGHT | 0.382 | 0.192 | 49.1% | 5.9% | 23.4% | 34.2% | OF | $3,100 | OF | $4,100 | IF/OF | $8,000 |
| 4 | Niko Goodrum | SWITCH | 0.329 | 0.220 | 35.5% | 8.9% | 32.2% | 40.3% | 2B | $2,700 | 2B/OF | $3,700 | 1B | $7,300 |
| 5 | Victor Martinez | SWITCH | 0.341 | 0.070 | 41.4% | 7.2% | 9.2% | 39.9% | C | $2,600 | 1B | $3,200 | 1B | $6,600 |
| 6 | Jim Adduci | LEFT | 0.202 | 0.133 | 23.8% | 6.3% | 28.1% | 52.4% | OF | $2,000 | 1B | $3,600 | LF | $7,700 |
| 7 | James McCann | RIGHT | 0.274 | 0.089 | 35.7% | 5.1% | 21.7% | 39.5% | C | $2,000 | C | $2,800 | C | $5,500 |
| 8 | Jose Iglesias | RIGHT | 0.267 | 0.097 | 24.2% | 3.5% | 10.9% | 46.8% | SS | $2,600 | SS | $3,700 | SS | $7,300 |
| 9 | Victor Reyes | RIGHT | 0.236 | 0.047 | 30.3% | 1.2% | 22.1% | 52.3% | OF | $2,100 | OF | $3,200 | LF | $6,700 |
| Team Averages | 0.303 | 0.135 | 35.2% | 6.7% | 21.5% | 42.5% |
Elite Plays – Leonys Martin, Nick Castellanos, Jeimer Candelario (GPP), Niko Goodrum (GPP)
Secondary Plays – Jeimer Candelario (Cash), Niko Goodrum (Cash)
Stackability – YELLOW / GREEN
Note: Unless noted, all statistics in the Grind Down are from the 2018 season.