MLB Grind Down: Tuesday, September 13th

Jump to Page 1 2 3
The RotoGrinders MLB Grind Down will give you an in-depth analysis into the upcoming MLB schedule. This article will break down the numbers for every single game and give you analysis on which trends you can exploit. While matchups are a major factor in daily fantasy baseball, there are plenty of other factors to consider such as injuries, weather, and salaries.
The analysis should point you in the right direction, but it is still up to you to decipher the information and make your own selections. No sport has more variance than baseball. The best choice is not always the right choice but following the trends will win you money over time.
Note: As always, if you want to try a new DFS site, be sure to click through a RotoGrinders link and use our DraftKings promo code and FanDuel promo code to receive the best perks in the industry.
Stackability Rating System:
GREEN – One of the top stacks of the day, viable in cash games and GPPs
YELLOW – A viable stack option in most formats, specifically GPPs
ORANGE – There are better stacks out there, but playable in large GPPs
RED – Not a recommended stack for cash games or GPPs
LA Dodgers at NY Yankees – 7:05 PM ET
| LA Dodgers | NY Yankees | ||||||||
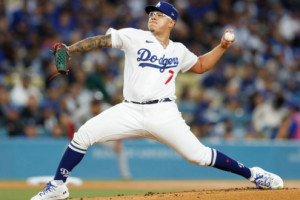
 | Julio Urias |  | CC Sabathia | ||||||
| LEFT | LEFT | ||||||||
| Vegas Moneyline | Vegas Over/Under | ||||||||
| LAD -130 | 8.5 | ||||||||
| Stats | wOBA | HR All. | HC% | K% | Stats | wOBA | HR All. | HC% | K% |
|---|---|---|---|---|---|---|---|---|---|
| SP vs. Left (2015-16) | 0.319 | 3 | 26.5% | 35.4% | SP vs. Left (2015-16) | 0.277 | 7 | 20.8% | 27.1% |
| SP vs. Right (2015-16) | 0.322 | 2 | 29.6% | 22.8% | SP vs. Right (2015-16) | 0.345 | 41 | 28.2% | 17.3% |
Pitcher Grind Down
| Julio Urias | ||||||||||
 | FanDuel | DraftKings | ||||||||
| Salary: | $8,000 | Salary: | $8,900 | |||||||
| FPPG: | 27.3 | FPPG: | 13.9 | |||||||
| Pitcher Rating: | 79.2 | Pitcher Rank: | 5 | |||||||
| Statistics | Starts | PitchPS | SIERA | ERA | K% | BB% | SS% | GB% | FB% | HC% |
|---|---|---|---|---|---|---|---|---|---|---|
| L30 Days | 3 | 93.6 | 3.40 | 1.35 | 28.1% | 7.3% | 11.3% | 33.3% | 33.3% | 22.0% |
| 2016 | 13 | 86.9 | 3.80 | 3.69 | 25.5% | 8.7% | 10.5% | 41.6% | 30.5% | 29.0% |
Home:—ERA: 2.97 — K%: 27.2% — wOBA Allowed: 0.303
Away:—ERA: 4.50 — K%: 23.6% — wOBA Allowed: 0.343
Happy Monday everyone! Big thanks to Louiescards for covering the Grind Down yesterday. I hope everyone had a tremendous Week 1 in NFL.
This is an important series for both teams and should be a great one to watch even if you aren’t a fan of either team. Similar to most young pitchers, Urias has been much more effective at home than he has been on the road. He currently has a 4.50 ERA with a .343 wOBA allowed in his road starts this season. The Yankees have really turned their season around offensively and they have one of the lowest strikeout rates of any team against left-handed pitching. Urias always has nice strikeout upside, but I slightly prefer Marcus Stroman and Robbie Ray at similar price points.
| CC Sabathia | ||||||||||
 | FanDuel | DraftKings | ||||||||
| Salary: | $7,100 | Salary: | $7,600 | |||||||
| FPPG: | 28.0 | FPPG: | 13.9 | |||||||
| Pitcher Rating: | 63.5 | Pitcher Rank: | 15 | |||||||
| Statistics | Starts | PitchPS | SIERA | ERA | K% | BB% | SS% | GB% | FB% | HC% |
|---|---|---|---|---|---|---|---|---|---|---|
| L30 Days | 5 | 97.0 | 3.30 | 4.55 | 25.8% | 4.8% | 12.0% | 51.2% | 35.7% | 25.9% |
| 2016 | 26 | 96.5 | 4.43 | 4.27 | 19.5% | 8.4% | 10.0% | 48.8% | 34.7% | 24.6% |
| 2015 | 29 | 93.2 | 4.08 | 4.73 | 18.9% | 6.9% | 9.1% | 45.9% | 32.4% | 29.1% |
Home:—ERA: 5.36 — K%: 19.5% — wOBA Allowed: 0.342
Away:—ERA: 3.78 — K%: 18.9% — wOBA Allowed: 0.323
Sabathia’s ERA may not show it, but his advanced statistics have improved dramatically in his last five starts. During that stretch, he has a 3.33 SIERA with a strikeout rate north of 25%. Tonight marks one of the only times this season that Sabathia is actually on my radar (for tournaments, not cash games). The Dodgers are ranked 29th in team wOBA and 28th in team ISO against against left-handed pitching this season. At his price, he is an intriguing low-owned GPP play.
Batter Grind Down
LA Dodgers
The Dodgers see a favorable ballpark shift playing in Yankee Stadium, but they have a mediocre run projection. CC Sabathia has been a hittable pitcher in the last two seasons, but he has been sharp in his last few outings. If you look at his splits this season, nothing stands out in particular. He has held both left and right-handed hitters under a .327 wOBA.
- Dodgers Offense (2016)
Team wOBA vs. LHP — 0.280 (29 of 30)
Team wOBA L30 Days — 0.327 (17 of 30)
Team ISO vs. LHP — 0.121 (28 of 30)
Team K% vs. LHP — 22.2% (19 of 30)
Pitches Per PA vs. LHP — 3.90 (9 of 30)
Runs Per Game — 4.49 (15 of 30)
Projected Run Total — 4.43 (13 of 30)
Projected Lineup
| # | Player | Bats | wOBA vs. LHP | ISO vs. LHP | HC% vs. LHP | wOBA L14 | FD Position | FD Salary | DK Position | DK Salary |
|---|---|---|---|---|---|---|---|---|---|---|
| 1 | Howie Kendrick | RIGHT | 0.311 | 0.081 | 30.9% | 0.280 | 2B | $2,900 | 2B/OF | $3,600 |
| 2 | Kike Hernandez | RIGHT | 0.395 | 0.243 | 33.8% | 0.282 | OF | $2,400 | OF | $3,700 |
| 3 | Corey Seager | LEFT | 0.347 | 0.185 | 42.0% | 0.372 | SS | $4,100 | SS | $4,500 |
| 4 | Adrian Gonzalez | LEFT | 0.312 | 0.108 | 29.0% | 0.260 | 1B | $3,400 | 1B | $3,300 |
| 5 | Justin Turner | RIGHT | 0.301 | 0.150 | 35.0% | 0.349 | 3B | $3,200 | 3B | $3,900 |
| 6 | Yasiel Puig | RIGHT | 0.358 | 0.221 | 28.9% | 0.474 | OF | $2,600 | OF | $4,200 |
| 7 | Carlos Ruiz | RIGHT | 0.375 | 0.159 | 32.6% | 0.174 | C | $2,600 | C | $3,000 |
| 8 | Rob Segedin | RIGHT | 0.245 | 0.167 | 23.5% | 0.177 | OF | $2,100 | 3B/OF | $2,600 |
| 9 | Charlie Culberson | RIGHT | 0.289 | 0.030 | 25.9% | 0.219 | 2B | $2,100 | 2B/SS | $2,600 |
| Team Averages | — | 0.326 | 0.149 | 31.3% | 0.287 | — | — | — | — |
Elite Plays – NONE
Secondary Plays – Corey Seager, Justin Turner, Yasiel Puig
Stackability – ORANGE / YELLOW
NY Yankees
The Yankees have struggled against southpaws overall, but they have obviously been a much different offense since the Gary Sanchez explosion. Over the last 30 days, they have the 12th highest team wOBA. They draw a fairly difficult matchup against the talented Julio Urias, but he has struggled on the road this season. He has also allowed a .322 wOBA to right-handed hitters.
- Yankees Offense (2016)
Team wOBA vs. LHP — 0.303 (24 of 30)
Team wOBA L30 Days — 0.331 (12 of 30)
Team ISO vs. LHP — 0.135 (26 of 30)
Team K% vs. LHP — 18.2% (3 of 30)
Pitches Per PA vs. LHP — 3.78 (27 of 30)
Runs Per Game — 4.24 (21 of 30)
Projected Run Total — 4.07 (22 of 30)
Projected Lineup
| # | Player | Bats | wOBA vs. LHP | ISO vs. LHP | HC% vs. LHP | wOBA L14 | FD Position | FD Salary | DK Position | DK Salary |
|---|---|---|---|---|---|---|---|---|---|---|
| 1 | Brett Gardner | LEFT | 0.319 | 0.102 | 22.9% | 0.367 | OF | $3,200 | OF | $3,200 |
| 2 | Rob Refsnyder | RIGHT | 0.315 | 0.085 | 29.6% | 0.398 | 1B | $2,300 | 1B/OF | $3,000 |
| 3 | Gary Sanchez | RIGHT | 0.247 | 0.231 | 40.0% | 0.307 | C | $3,900 | C | $4,800 |
| 4 | Starlin Castro | RIGHT | 0.298 | 0.117 | 27.6% | 0.271 | 2B | $2,800 | 2B | $3,400 |
| 5 | Mark Teixeira | SWITCH | 0.323 | 0.147 | 30.4% | 0.265 | 1B | $2,400 | 1B | $3,200 |
| 6 | Didi Gregorius | LEFT | 0.312 | 0.106 | 22.5% | 0.183 | SS | $2,900 | SS | $2,900 |
| 7 | Chase Headley | SWITCH | 0.314 | 0.110 | 26.9% | 0.319 | 3B | $2,500 | 3B | $3,200 |
| 8 | Tyler Austin | RIGHT | 0.205 | 0.000 | 60.0% | 0.414 | 1B | $2,400 | 1B | $2,500 |
| 9 | Aaron Judge | RIGHT | 0.141 | 0.000 | 40.0% | 0.195 | OF | $2,300 | OF | $3,500 |
| Team Averages | — | 0.275 | 0.100 | 33.3% | 0.302 | — | — | — | — |
Elite Plays – NONE
Secondary Plays – Rob Refsnyder, Gary Sanchez, Starlin Castro, Mark Teixeira
Stackability – ORANGE / YELLOW
NY Mets at Washington – 7:05 PM ET
| NY Mets | Washington | ||||||||
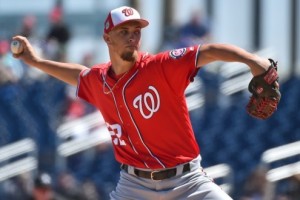
 | Noah Syndergaard |  | A.J. Cole | ||||||
| RIGHT | RIGHT | ||||||||
| Vegas Moneyline | Vegas Over/Under | ||||||||
| NYM -125 | 7.5 | ||||||||
| Stats | wOBA | HR All. | HC% | K% | Stats | wOBA | HR All. | HC% | K% |
|---|---|---|---|---|---|---|---|---|---|
| SP vs. Left (2015-16) | 0.298 | 15 | 27.1% | 25.3% | SP vs. Left (2015-16) | 0.333 | 4 | 31.6% | 25.0% |
| SP vs. Right (2015-16) | 0.260 | 14 | 24.7% | 31.0% | SP vs. Right (2015-16) | 0.279 | 3 | 18.0% | 23.2% |
Pitcher Grind Down
| Noah Syndergaard | ||||||||||
 | FanDuel | DraftKings | ||||||||
| Salary: | $10,900 | Salary: | $11,700 | |||||||
| FPPG: | 39.4 | FPPG: | 21.8 | |||||||
| Pitcher Rating: | 93.1 | Pitcher Rank: | 1 | |||||||
| Statistics | Starts | PitchPS | SIERA | ERA | K% | BB% | SS% | GB% | FB% | HC% |
|---|---|---|---|---|---|---|---|---|---|---|
| L30 Days | 5 | 102.4 | 3.68 | 1.38 | 25.8% | 8.9% | 13.5% | 53.8% | 30.0% | 17.3% |
| 2016 | 27 | 97.9 | 3.00 | 2.48 | 29.0% | 5.8% | 14.5% | 50.5% | 27.3% | 27.0% |
| 2015 | 24 | 99.2 | 2.95 | 3.24 | 27.5% | 5.1% | 12.2% | 46.5% | 33.6% | 24.6% |
Home:—ERA: 2.48 — K%: 28.9% — wOBA Allowed: 0.249
Away:—ERA: 3.29 — K%: 27.6% — wOBA Allowed: 0.310
Syndergaard is having one of the best seasons of any pitcher in baseball. He currently sports a 3.00 SIERA with a strikeout rate of 29% and a walk rate of 5.8%. He generates a lot of swings and misses and he induces a high ground ball rate. I would give him a small boost if he was playing at home, but he is still the number one pitching target on the board. The Nationals have been a mediocre offense against right-handed pitching this season.
| A.J. Cole | ||||||||||
 | FanDuel | DraftKings | ||||||||
| Salary: | $6,000 | Salary: | $8,200 | |||||||
| FPPG: | 30.5 | FPPG: | 16.9 | |||||||
| Pitcher Rating: | 74.0 | Pitcher Rank: | 8 | |||||||
| Statistics | Starts | PitchPS | SIERA | ERA | K% | BB% | SS% | GB% | FB% | HC% |
|---|---|---|---|---|---|---|---|---|---|---|
| L30 Days | 4 | 99.0 | 4.13 | 4.56 | 26.0% | 7.3% | 10.6% | 25.8% | 64.5% | 22.6% |
| 2016 | 4 | 99.0 | 4.13 | 4.56 | 26.0% | 7.3% | 10.6% | 25.8% | 64.5% | 22.6% |
| 2015 | 1 | 97.0 | 3.27 | 5.79 | 20.5% | 2.3% | 8.3% | 36.4% | 36.4% | 32.4% |
Home:—ERA: 5.40 — K%: 30.7% — wOBA Allowed: 0.315
Away:—ERA: 4.50 — K%: 19.2% — wOBA Allowed: 0.309
Cole’s first four starts of the season have yielded mixed results, but he is a talented young right-hander that provides good upside at his price point. He has a 26% strikeout rate in the majors this season and he posted a 20.5% strikeout rate in Triple-A ball. Run support is obviously an issue with Syndergaard pitching opposite him, but Cole is only a small underdog at home. He carries some value as a tournament play, but I will be looking elsewhere in cash.
Batter Grind Down
NY Mets
The Mets have been one of the hottest offenses in baseball, ranking third in team wOBA over the last month of play. Unfortunately, they have a mediocre matchup against A.J. Cole and they have to face him in a pitcher’s ballpark. The Mets have the fifth lowest run projection in the slate, which makes them an easy fade in cash games. Curtis Granderson is an intriguing one-off target, as he has a .480 wOBA in the last two weeks.
- Mets Offense (2016)
Team wOBA vs. RHP — 0.308 (24 of 30)
Team wOBA L30 Days — 0.341 (3 of 30)
Team ISO vs. RHP — 0.170 (12 of 30)
Team K% vs. RHP — 21.7% (20 of 30)
Pitches Per PA vs. RHP — 3.92 (8 of 30)
Runs Per Game — 3.97 (27 of 30)
Projected Run Total — 3.90 (26 of 30)
Projected Lineup
| # | Player | Bats | wOBA vs. RHP | ISO vs. RHP | HC% vs. RHP | wOBA L14 | FD Position | FD Salary | DK Position | DK Salary |
|---|---|---|---|---|---|---|---|---|---|---|
| 1 | Jose Reyes | SWITCH | 0.292 | 0.104 | 20.5% | 0.319 | 3B | $3,000 | 3B/SS | $4,100 |
| 2 | Asdrubal Cabrera | SWITCH | 0.328 | 0.187 | 32.2% | 0.431 | SS | $3,400 | SS | $3,900 |
| 3 | Yoenis Cespedes | RIGHT | 0.377 | 0.264 | 37.0% | 0.354 | OF | $4,300 | OF | $4,500 |
| 4 | Curtis Granderson | LEFT | 0.363 | 0.232 | 37.7% | 0.480 | OF | $3,500 | OF | $4,600 |
| 5 | Jay Bruce | LEFT | 0.334 | 0.252 | 38.8% | 0.310 | OF | $3,200 | OF | $4,400 |
| 6 | Kelly Johnson | LEFT | 0.316 | 0.163 | 31.4% | 0.278 | 3B | $2,600 | 2B/3B | $3,100 |
| 7 | James Loney | LEFT | 0.312 | 0.100 | 24.6% | 0.291 | 1B | $2,600 | 1B | $2,900 |
| 8 | Rene Rivera | RIGHT | 0.227 | 0.109 | 30.4% | 0.236 | C | $2,100 | C | $2,400 |
| 9 | Noah Syndergaard | RIGHT | 0.277 | 0.208 | 35.9% | 0.219 | P | $10,900 | P | $11,700 |
| Team Averages | — | 0.314 | 0.180 | 32.1% | 0.324 | — | — | — | — |
Elite Plays – NONE
Secondary Plays – Curtis Granderson
Stackability – RED
Washington
The Nationals draw the worst matchup in the slate, as they have the unfortunate task of facing Noah Syndergaard. In addition to the elite strikeout rate and the dominant splits against left and right-handed hitters, Syndergaard has pitched well against the Nationals in his career. They should be avoided in both cash games and tournaments.
- Nationals Offense (2016)
Team wOBA vs. RHP — 0.318 (14 of 30)
Team wOBA L30 Days — 0.325 (19 of 30)
Team ISO vs. RHP — 0.164 (16 of 30)
Team K% vs. RHP — 19.4% (7 of 30)
Pitches Per PA vs. RHP — 3.88 (12 of 30)
Runs Per Game — 4.76 (9 of 30)
Projected Run Total — 3.60 (29 of 30)
Projected Lineup
| # | Player | Bats | wOBA vs. RHP | ISO vs. RHP | HC% vs. RHP | wOBA L14 | FD Position | FD Salary | DK Position | DK Salary |
|---|---|---|---|---|---|---|---|---|---|---|
| 1 | Trea Turner | RIGHT | 0.378 | 0.230 | 31.4% | 0.394 | OF | $4,300 | 2B/OF | $4,800 |
| 2 | Jayson Werth | RIGHT | 0.297 | 0.140 | 33.8% | 0.273 | OF | $3,600 | OF | $2,800 |
| 3 | Daniel Murphy | LEFT | 0.379 | 0.226 | 36.4% | 0.374 | 2B | $3,700 | 2B | $4,500 |
| 4 | Bryce Harper | LEFT | 0.422 | 0.282 | 36.8% | 0.277 | OF | $3,900 | OF | $4,000 |
| 5 | Anthony Rendon | RIGHT | 0.331 | 0.157 | 35.9% | 0.339 | 3B | $3,600 | 3B | $3,300 |
| 6 | Ryan Zimmerman | RIGHT | 0.281 | 0.154 | 32.6% | 0.199 | 1B | $2,600 | 1B | $2,300 |
| 7 | Danny Espinosa | SWITCH | 0.303 | 0.155 | 30.0% | 0.233 | SS | $2,700 | SS | $2,400 |
| 8 | Jose Lobaton | SWITCH | 0.284 | 0.120 | 26.6% | 0.420 | C | $2,700 | C | $2,200 |
| 9 | A.J. Cole | RIGHT | 0.000 | 0.000 | 0.0% | 0.000 | P | $6,000 | P | $8,200 |
| Team Averages | — | 0.297 | 0.163 | 29.3% | 0.279 | — | — | — | — |
Elite Plays – NONE
Secondary Plays – NONE
Stackability – RED
Pittsburgh at Philadelphia – 7:05 PM ET
| Pittsburgh | Philadelphia | ||||||||
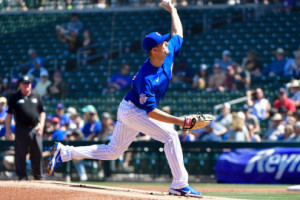
 | Ivan Nova |  | Alec Asher | ||||||
| RIGHT | RIGHT | ||||||||
| Vegas Moneyline | Vegas Over/Under | ||||||||
| PIT -142 | 8.0 | ||||||||
| Stats | wOBA | HR All. | HC% | K% | Stats | wOBA | HR All. | HC% | K% |
|---|---|---|---|---|---|---|---|---|---|
| SP vs. Left (2015-16) | 0.366 | 18 | 35.7% | 11.3% | SP vs. Left (2015-16) | 0.422 | 4 | 37.7% | 11.0% |
| SP vs. Right (2015-16) | 0.308 | 18 | 32.1% | 21.6% | SP vs. Right (2015-16) | 0.361 | 4 | 25.4% | 9.0% |
Pitcher Grind Down
| Ivan Nova | ||||||||||
 | FanDuel | DraftKings | ||||||||
| Salary: | $7,300 | Salary: | $10,600 | |||||||
| FPPG: | 24.9 | FPPG: | 12.5 | |||||||
| Pitcher Rating: | 68.3 | Pitcher Rank: | 11 | |||||||
| Statistics | Starts | PitchPS | SIERA | ERA | K% | BB% | SS% | GB% | FB% | HC% |
|---|---|---|---|---|---|---|---|---|---|---|
| L30 Days | 5 | 79.8 | 3.26 | 2.38 | 19.5% | 1.6% | 8.8% | 58.3% | 26.0% | 28.0% |
| 2016 | 22 | 92.5 | 3.91 | 4.13 | 17.9% | 4.5% | 9.0% | 53.1% | 28.7% | 35.0% |
| 2015 | 17 | 89.9 | 4.58 | 5.07 | 15.3% | 8.0% | 7.8% | 49.0% | 31.7% | 32.3% |
Home:—ERA: 4.07 — K%: 16.2% — wOBA Allowed: 0.318
Away:—ERA: 5.03 — K%: 17.5% — wOBA Allowed: 0.356
Nova has been in good form over his last five starts, but he has such a low strikeout rate that it’s hard to like him as a play in daily fantasy. In 2015, he had a 15.3% strikeout rate and this season hasn’t been a lot better. He draws a favorable matchup against the Phillies, but he has to face them on the road in a fairly neutral ballpark for pitchers. I see the appeal, but I’m higher on Robbie Ray and Marcus Stroman at similar price points.
| Alec Asher | ||||||||||
 | FanDuel | DraftKings | ||||||||
| Salary: | $6,000 | Salary: | $4,300 | |||||||
| FPPG: | 30.0 | FPPG: | 15.7 | |||||||
| Pitcher Rating: | 33.7 | Pitcher Rank: | 30 | |||||||
| Statistics | Starts | PitchPS | SIERA | ERA | K% | BB% | SS% | GB% | FB% | HC% |
|---|---|---|---|---|---|---|---|---|---|---|
| L30 Days | 1 | 75.0 | 8.01 | 0.00 | 0.0% | 4.6% | 2.7% | 20.0% | 55.0% | 28.6% |
| 2016 | 1 | 75.0 | 8.01 | 0.00 | 0.0% | 4.6% | 2.7% | 20.0% | 55.0% | 28.6% |
| 2015 | 7 | 71.6 | 5.34 | 9.31 | 11.6% | 7.3% | 7.8% | 36.1% | 45.4% | 32.4% |
Home:—ERA: 10.80 — K%: 11.0% — wOBA Allowed: 0.497
Away:—ERA: 4.32 — K%: 8.7% — wOBA Allowed: 0.257
Asher has really struggled in his first eight major league starts, posting a SIERA close to 6.00 with a strikeout rate of only 11.6%. He has been an extreme fly-ball pitcher that has struggled with hitters from both sides of the plate. He grades out as the worst pitching option in the entire slate. He should be avoided in both cash games and tournaments.
Batter Grind Down
Pittsburgh
The Pirates have not fared well against right-handed pitching this season, but they see a small ballpark boost tonight and they draw one of the best matchups on the board. The sample size is small (eight starts), but Alec Asher has allowed a .422 wOBA to left-handed hitters and a .361 wOBA to right-handed hitters in his major league career. The Pirates are a sneaky offense to target in tournaments.
- Pirates Offense (2016)
Team wOBA vs. RHP — 0.313 (18 of 30)
Team wOBA L30 Days — 0.326 (18 of 30)
Team ISO vs. RHP — 0.140 (27 of 30)
Team K% vs. RHP — 20.5% (13 of 30)
Pitches Per PA vs. RHP — 3.96 (4 of 30)
Runs Per Game — 4.44 (18 of 30)
Projected Run Total — 4.25 (19 of 30)
Projected Lineup
| # | Player | Bats | wOBA vs. RHP | ISO vs. RHP | HC% vs. RHP | wOBA L14 | FD Position | FD Salary | DK Position | DK Salary |
|---|---|---|---|---|---|---|---|---|---|---|
| 1 | Adam Frazier | LEFT | 0.354 | 0.190 | 36.4% | 0.608 | SS | $2,300 | 2B/3B | $3,600 |
| 2 | Josh Bell | SWITCH | 0.400 | 0.185 | 42.0% | 0.319 | 1B | $2,600 | 1B/OF | $3,100 |
| 3 | Andrew McCutchen | RIGHT | 0.350 | 0.181 | 38.3% | 0.292 | OF | $3,400 | OF | $4,400 |
| 4 | Gregory Polanco | LEFT | 0.332 | 0.172 | 33.4% | 0.255 | OF | $3,600 | OF | $4,800 |
| 5 | Jung-Ho Kang | RIGHT | 0.371 | 0.219 | 37.1% | 0.676 | 3B | $3,500 | 3B | $5,000 |
| 6 | Francisco Cervelli | RIGHT | 0.316 | 0.074 | 26.9% | 0.342 | C | $2,800 | C | $3,400 |
| 7 | Sean Rodriguez | RIGHT | 0.294 | 0.162 | 34.3% | 0.244 | OF | $2,200 | OF/SS | $3,900 |
| 8 | Jordy Mercer | RIGHT | 0.276 | 0.087 | 24.4% | 0.295 | SS | $2,300 | SS | $3,400 |
| 9 | Ivan Nova | RIGHT | 0.139 | 0.000 | 0.0% | 0.176 | P | $7,300 | P | $10,600 |
| Team Averages | — | 0.315 | 0.141 | 30.3% | 0.356 | — | — | — | — |
Elite Plays – Andrew McCutchen
Secondary Plays – Adam Frazier, Josh Bell, Starling Marte, Jung-Ho Kang
Stackability – YELLOW
Philadelphia
The Phillies struggle against right-handed pitching, they have one of the lowest implied team totals in the slate, and they are facing a pitcher that has been in good form in his last few starts. There aren’t many reasons to like the Phillies’ offense here, even though Ivan Nova has allowed a .366 wOBA to left-handed hitters in the last two seasons.
- Phillies Offense (2016)
Team wOBA vs. RHP — 0.296 (29 of 30)
Team wOBA L30 Days — 0.280 (28 of 30)
Team ISO vs. RHP — 0.156 (19 of 30)
Team K% vs. RHP — 22.6% (25 of 30)
Pitches Per PA vs. RHP — 3.81 (26 of 30)
Runs Per Game — 3.65 (30 of 30)
Projected Run Total — 3.75 (27 of 30)
Projected Lineup
| # | Player | Bats | wOBA vs. RHP | ISO vs. RHP | HC% vs. RHP | wOBA L14 | FD Position | FD Salary | DK Position | DK Salary |
|---|---|---|---|---|---|---|---|---|---|---|
| 1 | Cesar Hernandez | SWITCH | 0.313 | 0.104 | 26.3% | 0.326 | 2B | $3,300 | 2B | $3,900 |
| 2 | Roman Quinn | SWITCH | 0.690 | 0.000 | 0.0% | 0.173 | OF | $2,400 | ||
| 3 | Maikel Franco | RIGHT | 0.318 | 0.179 | 28.4% | 0.220 | 3B | $2,800 | 3B | $3,100 |
| 4 | Ryan Howard | LEFT | 0.325 | 0.250 | 42.7% | 0.308 | 1B | $2,700 | 1B | $3,000 |
| 5 | Cameron Rupp | RIGHT | 0.291 | 0.148 | 30.1% | 0.219 | C | $2,600 | C | $2,900 |
| 6 | Freddy Galvis | SWITCH | 0.295 | 0.140 | 28.3% | 0.335 | SS | $2,400 | SS | $3,600 |
| 7 | Odubel Herrera | LEFT | 0.343 | 0.144 | 29.8% | 0.257 | OF | $2,900 | OF | $3,700 |
| 8 | Aaron Altherr | RIGHT | 0.324 | 0.182 | 32.8% | 0.183 | OF | $2,500 | OF | $3,300 |
| 9 | Alec Asher | RIGHT | 0.305 | 0.143 | 50.0% | 0.000 | P | $6,000 | P | $4,300 |
| Team Averages | — | 0.356 | 0.143 | 29.8% | 0.225 | — | — | — | — |
Elite Plays – NONE
Secondary Plays – Ryan Howard
Stackability – RED
Tampa Bay at Toronto – 7:07 PM ET
| Tampa Bay | Toronto | ||||||||
 | Drew Smyly |  | Marcus Stroman | ||||||
| LEFT | RIGHT | ||||||||
| Vegas Moneyline | Vegas Over/Under | ||||||||
| TOR -190 | 9.0 | ||||||||
| Stats | wOBA | HR All. | HC% | K% | Stats | wOBA | HR All. | HC% | K% |
|---|---|---|---|---|---|---|---|---|---|
| SP vs. Left (2015-16) | 0.294 | 7 | 31.0% | 33.3% | SP vs. Left (2015-16) | 0.310 | 12 | 31.6% | 19.4% |
| SP vs. Right (2015-16) | 0.325 | 34 | 29.9% | 22.4% | SP vs. Right (2015-16) | 0.306 | 10 | 28.5% | 20.3% |
Pitcher Grind Down
| Drew Smyly | ||||||||||
 | FanDuel | DraftKings | ||||||||
| Salary: | $7,200 | Salary: | $7,400 | |||||||
| FPPG: | 27.6 | FPPG: | 14.4 | |||||||
| Pitcher Rating: | 52.7 | Pitcher Rank: | 20 | |||||||
| Statistics | Starts | PitchPS | SIERA | ERA | K% | BB% | SS% | GB% | FB% | HC% |
|---|---|---|---|---|---|---|---|---|---|---|
| L30 Days | 5 | 95.0 | 4.86 | 5.08 | 21.4% | 8.6% | 12.0% | 25.6% | 61.0% | 25.6% |
| 2016 | 27 | 96.6 | 4.13 | 5.05 | 23.2% | 6.7% | 10.8% | 30.3% | 50.0% | 29.6% |
| 2015 | 12 | 94.7 | 3.25 | 3.10 | 28.0% | 7.3% | 11.4% | 36.8% | 44.3% | 31.6% |
Home:—ERA: 4.29 — K%: 27.6% — wOBA Allowed: 0.295
Away:—ERA: 4.64 — K%: 22.1% — wOBA Allowed: 0.339
Smyly always provides nice strikeout upside when he toes the rubber, but he has really struggled with consistency. He hasn’t been great on the road and he draws one of the most difficult matchups in baseball. He has to face a right-handed heavy Blue Jays’ offense in the hitter-friendly Rogers Centre. As a large underdog in a game that is expected to be high scoring, there is no reason to look to Smyly tonight.
| Marcus Stroman | ||||||||||
 | FanDuel | DraftKings | ||||||||
| Salary: | $7,800 | Salary: | $9,000 | |||||||
| FPPG: | 29.5 | FPPG: | 14.9 | |||||||
| Pitcher Rating: | 90.1 | Pitcher Rank: | 2 | |||||||
| Statistics | Starts | PitchPS | SIERA | ERA | K% | BB% | SS% | GB% | FB% | HC% |
|---|---|---|---|---|---|---|---|---|---|---|
| L30 Days | 5 | 97.0 | 2.72 | 3.52 | 25.2% | 3.8% | 12.2% | 61.5% | 18.7% | 29.4% |
| 2016 | 28 | 96.8 | 3.46 | 4.55 | 20.1% | 5.7% | 9.3% | 60.5% | 20.3% | 31.3% |
| 2015 | 4 | 93.3 | 3.28 | 1.67 | 17.5% | 5.8% | 7.2% | 64.1% | 17.9% | 21.8% |
Home:—ERA: 4.32 — K%: 18.2% — wOBA Allowed: 0.305
Away:—ERA: 4.04 — K%: 21.3% — wOBA Allowed: 0.311
Stroman has never been an elite strikeout pitcher, but that seems to slowly be changing. In his last five starts, he has a 2.72 SIERA with a strikeout rate of 25.2% and a walk rate of 3.8%. He has always had one of the highest ground ball rates in baseball and when you add an above-average k-rate, that can be a lethal combination for a pitcher. I have him ranked as the second best pitcher in the slate and he is very affordable across the industry.
Batter Grind Down
Tampa Bay
I could basically just copy and paste the blurb about Marcus Stroman here. He has been in good form, his strikeouts are trending upward, and he has one of the highest ground ball rates in baseball. Even though the Rays see a favorable ballpark shift, they still have the sixth lowest implied team total on the board.
- Rays Offense (2016)
Team wOBA vs. RHP — 0.316 (16 of 30)
Team wOBA L30 Days — 0.339 (4 of 30)
Team ISO vs. RHP — 0.191 (4 of 30)
Team K% vs. RHP — 23.9% (27 of 30)
Pitches Per PA vs. RHP — 3.88 (13 of 30)
Runs Per Game — 4.20 (22 of 30)
Projected Run Total — 3.98 (25 of 30)
Projected Lineup
| # | Player | Bats | wOBA vs. RHP | ISO vs. RHP | HC% vs. RHP | wOBA L14 | FD Position | FD Salary | DK Position | DK Salary |
|---|---|---|---|---|---|---|---|---|---|---|
| 1 | Logan Forsythe | RIGHT | 0.337 | 0.143 | 31.5% | 0.454 | 2B | $3,500 | 2B | $4,300 |
| 2 | Kevin Kiermaier | LEFT | 0.323 | 0.173 | 27.8% | 0.480 | OF | $3,700 | OF | $4,300 |
| 3 | Evan Longoria | RIGHT | 0.329 | 0.198 | 33.4% | 0.155 | 3B | $3,400 | 3B | $3,600 |
| 4 | Brad Miller | LEFT | 0.347 | 0.229 | 34.7% | 0.230 | SS | $3,000 | 1B/SS | $3,700 |
| 5 | Nick Franklin | SWITCH | 0.322 | 0.209 | 35.1% | 0.317 | 2B | $3,000 | 1B/OF | $3,500 |
| 6 | Mikie Mahtook | RIGHT | 0.256 | 0.119 | 33.3% | 0.234 | OF | $2,000 | OF | $2,300 |
| 7 | Corey Dickerson | LEFT | 0.349 | 0.264 | 34.0% | 0.312 | OF | $3,200 | OF | $3,300 |
| 8 | Steven Souza | RIGHT | 0.309 | 0.168 | 32.1% | 0.347 | OF | $3,100 | OF | $3,500 |
| 9 | Bobby Wilson | RIGHT | 0.258 | 0.100 | 22.8% | 0.332 | C | $2,000 | C | $2,800 |
| Team Averages | — | 0.314 | 0.178 | 31.6% | 0.318 | — | — | — | — |
Elite Plays – NONE
Secondary Plays – NONE
Stackability – RED
Toronto
Do you remember at the start of the season when the Blue Jays were ranked near the bottom of the majors in most offensive categories in baseball. With their lineup, we knew it was only a matter of time before that changed. They are now ranked seventh in both team wOBA and team ISO against left-handed pitching on the season. All of the right-handed hitters are in play against Drew Smyly.
- Blue Jays Offense (2016)
Team wOBA vs. LHP — 0.330 (7 of 30)
Team wOBA L30 Days — 0.334 (9 of 30)
Team ISO vs. LHP — 0.174 (7 of 30)
Team K% vs. LHP — 19.9% (6 of 30)
Pitches Per PA vs. LHP — 3.90 (10 of 30)
Runs Per Game — 4.84 (7 of 30)
Projected Run Total — 5.02 (2 of 30)
Projected Lineup
| # | Player | Bats | wOBA vs. LHP | ISO vs. LHP | HC% vs. LHP | wOBA L14 | FD Position | FD Salary | DK Position | DK Salary |
|---|---|---|---|---|---|---|---|---|---|---|
| 1 | Devon Travis | RIGHT | 0.334 | 0.161 | 27.3% | 0.316 | 2B | $3,300 | 2B | $3,900 |
| 2 | Josh Donaldson | RIGHT | 0.422 | 0.298 | 40.8% | 0.280 | 3B | $4,100 | 3B | $4,800 |
| 3 | Edwin Encarnacion | RIGHT | 0.367 | 0.246 | 38.4% | 0.362 | 1B | $4,100 | 1B | $5,400 |
| 4 | Jose Bautista | RIGHT | 0.347 | 0.220 | 37.3% | 0.314 | OF | $3,600 | OF | $4,300 |
| 5 | Russell Martin | RIGHT | 0.355 | 0.186 | 36.2% | 0.278 | C | $3,200 | C | $3,800 |
| 6 | Troy Tulowitzki | RIGHT | 0.364 | 0.180 | 39.4% | 0.341 | SS | $3,000 | SS | $3,800 |
| 7 | Melvin Upton | RIGHT | 0.366 | 0.239 | 31.5% | 0.277 | OF | $3,400 | OF | $4,300 |
| 8 | Dioner Navarro | SWITCH | 0.313 | 0.198 | 25.5% | 0.201 | C | $2,000 | C | $3,100 |
| 9 | Kevin Pillar | RIGHT | 0.304 | 0.106 | 28.7% | 0.284 | OF | $2,500 | OF | $3,500 |
| Team Averages | — | 0.352 | 0.204 | 33.9% | 0.295 | — | — | — | — |
Elite Plays – Devon Travis, Josh Donaldson
Secondary Plays – Edwin Encarnacion, Jose Bautista, Russell Martin, Troy Tulowitzki
Stackability – YELLOW / GREEN
Minnesota at Detroit – 7:08 PM ET
| Minnesota | Detroit | ||||||||
 | Kyle Gibson |  | Matt Boyd | ||||||
| RIGHT | LEFT | ||||||||
| Vegas Moneyline | Vegas Over/Under | ||||||||
| DET -180 | 9.0 | ||||||||
| Stats | wOBA | HR All. | HC% | K% | Stats | wOBA | HR All. | HC% | K% |
|---|---|---|---|---|---|---|---|---|---|
| SP vs. Left (2015-16) | 0.339 | 17 | 30.4% | 15.7% | SP vs. Left (2015-16) | 0.373 | 8 | 31.3% | 13.8% |
| SP vs. Right (2015-16) | 0.312 | 20 | 27.6% | 18.1% | SP vs. Right (2015-16) | 0.349 | 23 | 33.3% | 20.6% |
Pitcher Grind Down
| Kyle Gibson | ||||||||||
 | FanDuel | DraftKings | ||||||||
| Salary: | $6,200 | Salary: | $5,100 | |||||||
| FPPG: | 22.3 | FPPG: | 9.9 | |||||||
| Pitcher Rating: | 39.7 | Pitcher Rank: | 28 | |||||||
| Statistics | Starts | PitchPS | SIERA | ERA | K% | BB% | SS% | GB% | FB% | HC% |
|---|---|---|---|---|---|---|---|---|---|---|
| L30 Days | 5 | 101.4 | 5.04 | 6.10 | 15.2% | 9.4% | 9.5% | 45.1% | 29.4% | 39.4% |
| 2016 | 21 | 98.5 | 4.73 | 5.34 | 15.8% | 8.3% | 9.6% | 49.3% | 28.6% | 31.1% |
| 2015 | 32 | 101.1 | 4.12 | 3.84 | 17.7% | 7.9% | 9.8% | 53.4% | 26.8% | 27.7% |
Home:—ERA: 4.28 — K%: 17.8% — wOBA Allowed: 0.329
Away:—ERA: 4.58 — K%: 15.8% — wOBA Allowed: 0.322
Gibson has been one of the most hittable pitchers in baseball this season. In 21 starts, he has a 4.73 SIERA with a strikeout rate of only 15.8%. He may induce a high ground ball rate, but he still gives up a fair share of hard contact. He comes into tonight’s game as a sizable underdog against the Tigers, who are ranked eighth in team wOBA against right-handed pitching this season. Gibson can be avoided in all league formats.
| Matt Boyd | ||||||||||
 | FanDuel | DraftKings | ||||||||
| Salary: | $6,600 | Salary: | $7,900 | |||||||
| FPPG: | 25.0 | FPPG: | 12.8 | |||||||
| Pitcher Rating: | 68.9 | Pitcher Rank: | 10 | |||||||
| Statistics | Starts | PitchPS | SIERA | ERA | K% | BB% | SS% | GB% | FB% | HC% |
|---|---|---|---|---|---|---|---|---|---|---|
| L30 Days | 5 | 100.8 | 4.43 | 2.40 | 19.0% | 6.6% | 11.1% | 41.1% | 43.3% | 30.0% |
| 2016 | 15 | 99.2 | 4.35 | 3.89 | 20.3% | 7.5% | 9.5% | 40.6% | 42.5% | 31.9% |
| 2015 | 12 | 83.6 | 4.83 | 7.53 | 17.1% | 7.9% | 8.2% | 31.9% | 51.9% | 34.0% |
Home:—ERA: 4.10 — K%: 18.8% — wOBA Allowed: 0.314
Away:—ERA: 6.89 — K%: 19.1% — wOBA Allowed: 0.401
Boyd has a 2.40 ERA in his last five starts, but his peripheral stats don’t leap off the page. On the season, he has a 4.35 SIERA with an average strikeout rate. The plus here is that he is a large favorite and that he is pitching at home, but that’s not enough of a reason to use him. The Twins are ranked fifth in team ISO against left-handed pitching this season.
Batter Grind Down
Minnesota
The Twins have one of the lowest run projections in the slate, even though their matchup against Matt Boyd is an exploitable one. In the last two seasons, Boyd has allowed a .349 wOBA to right-handed hitters. I’m not going to be targeting the Twins in cash games, but there are a few intriguing tournament options in this lineup.
- Twins Offense (2016)
Team wOBA vs. LHP — 0.325 (11 of 30)
Team wOBA L30 Days — 0.318 (24 of 30)
Team ISO vs. LHP — 0.180 (5 of 30)
Team K% vs. LHP — 23.6% (25 of 30)
Pitches Per PA vs. LHP — 3.92 (8 of 30)
Runs Per Game — 4.58 (11 of 30)
Projected Run Total — 4.04 (24 of 30)
Projected Lineup
| # | Player | Bats | wOBA vs. LHP | ISO vs. LHP | HC% vs. LHP | wOBA L14 | FD Position | FD Salary | DK Position | DK Salary |
|---|---|---|---|---|---|---|---|---|---|---|
| 1 | Brian Dozier | RIGHT | 0.364 | 0.271 | 33.1% | 0.506 | 2B | $3,700 | 2B | $5,600 |
| 2 | Jorge Polanco | RIGHT | 0.390 | 0.156 | 27.0% | 0.327 | 3B | $2,900 | 3B/SS | $3,100 |
| 3 | Miguel Sano | RIGHT | 0.356 | 0.224 | 45.7% | 0.312 | OF | $3,300 | 3B/OF | $3,900 |
| 4 | Kennys Vargas | SWITCH | 0.464 | 0.240 | 46.4% | 0.251 | 1B | $3,100 | 1B | $3,500 |
| 5 | Robbie Grossman | SWITCH | 0.398 | 0.202 | 31.2% | 0.539 | OF | $3,000 | OF | $4,200 |
| 6 | Eduardo Escobar | SWITCH | 0.314 | 0.182 | 28.3% | 0.199 | SS | $2,500 | SS | $3,100 |
| 7 | Eddie Rosario | LEFT | 0.309 | 0.142 | 28.1% | 0.300 | OF | $2,800 | OF | $3,200 |
| 8 | John Murphy | RIGHT | 0.322 | 0.170 | 31.3% | 0.425 | C | $2,000 | C | $2,600 |
| 9 | Byron Buxton | RIGHT | 0.234 | 0.123 | 33.8% | 0.555 | OF | $3,000 | OF | $3,700 |
| Team Averages | — | 0.350 | 0.190 | 33.9% | 0.379 | — | — | — | — |
Elite Plays – NONE
Secondary Plays – Brian Dozier, Miguel Sano, Kennys Vargas
Stackability – ORANGE
Detroit
The Tigers are notorious for letting us down in favorable spots, especially when they are at home. Even though that is always in the back of my mind, you have to like their matchup against Kyle Gibson. On the season, he has allowed a .391 wOBA to left-handed hitters and a .330 wOBA to right-handed hitters.
- Tigers Offense (2016)
Team wOBA vs. RHP — 0.328 (8 of 30)
Team wOBA L30 Days — 0.329 (15 of 30)
Team ISO vs. RHP — 0.170 (12 of 30)
Team K% vs. RHP — 21.1% (19 of 30)
Pitches Per PA vs. RHP — 3.87 (15 of 30)
Runs Per Game — 4.57 (13 of 30)
Projected Run Total — 4.96 (4 of 30)
Projected Lineup
| # | Player | Bats | wOBA vs. RHP | ISO vs. RHP | HC% vs. RHP | wOBA L14 | FD Position | FD Salary | DK Position | DK Salary |
|---|---|---|---|---|---|---|---|---|---|---|
| 1 | Ian Kinsler | RIGHT | 0.334 | 0.151 | 29.0% | 0.432 | 2B | $3,900 | 2B | $4,800 |
| 2 | Cameron Maybin | RIGHT | 0.322 | 0.092 | 21.4% | 0.261 | OF | $3,000 | OF | $3,900 |
| 3 | Miguel Cabrera | RIGHT | 0.396 | 0.215 | 39.9% | 0.370 | 1B | $3,700 | 1B | $5,200 |
| 4 | Victor Martinez | SWITCH | 0.309 | 0.162 | 36.0% | 0.235 | C | $3,400 | 1B | $3,600 |
| 5 | J.D. Martinez | RIGHT | 0.386 | 0.248 | 40.7% | 0.483 | OF | $3,500 | OF | $4,500 |
| 6 | Justin Upton | RIGHT | 0.337 | 0.206 | 36.8% | 0.418 | OF | $3,300 | OF | $4,200 |
| 7 | James McCann | RIGHT | 0.253 | 0.080 | 25.1% | 0.267 | C | $2,200 | C | $2,800 |
| 8 | Erick Aybar | SWITCH | 0.285 | 0.083 | 21.7% | 0.312 | SS | $2,200 | SS | $3,300 |
| 9 | Dixon Machado | RIGHT | 0.249 | 0.036 | 23.9% | 0.690 | SS | $2,100 | SS | $2,700 |
| Team Averages | — | 0.319 | 0.141 | 30.5% | 0.385 | — | — | — | — |