MLB Grind Down: Monday, September 19th

Jump to Page 1 2 3
The RotoGrinders MLB Grind Down will give you an in-depth analysis into the upcoming MLB schedule. This article will break down the numbers for every single game and give you analysis on which trends you can exploit. While matchups are a major factor in daily fantasy baseball, there are plenty of other factors to consider such as injuries, weather, and salaries.
The analysis should point you in the right direction, but it is still up to you to decipher the information and make your own selections. No sport has more variance than baseball. The best choice is not always the right choice but following the trends will win you money over time.
Note: As always, if you want to try a new DFS site, be sure to click through a RotoGrinders link and use our DraftKings promo code and FanDuel promo code to receive the best perks in the industry.
Stackability Rating System:
GREEN – One of the top stacks of the day, viable in cash games and GPPs
YELLOW – A viable stack option in most formats, specifically GPPs
ORANGE – There are better stacks out there, but playable in large GPPs
RED – Not a recommended stack for cash games or GPPs
Chicago White Sox at Kansas City – 2:15 PM ET
| Chicago White Sox | Kansas City | ||||||||
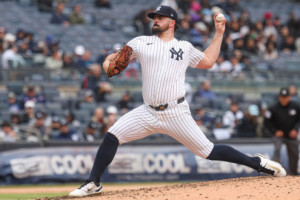
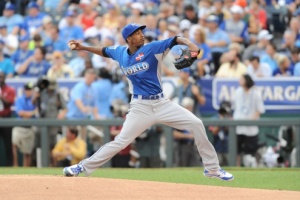
 | Carlos Rodon |  | Yordano Ventura | ||||||
| LEFT | RIGHT | ||||||||
| Vegas Moneyline | Vegas Over/Under | ||||||||
| KC -127 | 8.5 | ||||||||
| Stats | wOBA | HR All. | HC% | K% | Stats | wOBA | HR All. | HC% | K% |
|---|---|---|---|---|---|---|---|---|---|
| SP vs. Left (2016) | 0.260 | 2 | 30.1% | 27.1% | SP vs. Left (2016) | 0.327 | 13 | 32.1% | 16.6% |
| SP vs. Right (2016) | 0.349 | 18 | 27.4% | 21.2% | SP vs. Right (2016) | 0.319 | 8 | 30.0% | 17.6% |
Pitcher Grind Down
| Carlos Rodon | ||||||||||
 | FanDuel | DraftKings | ||||||||
| Salary: | $8,200 | Salary: | ||||||||
| FPPG: | 30.2 | FPPG: | ||||||||
| Pitcher Rating: | 62.7 | Pitcher Rank: | 11 | |||||||
| Statistics | Starts | PitchPS | SIERA | ERA | K% | BB% | SS% | GB% | FB% | HC% |
|---|---|---|---|---|---|---|---|---|---|---|
| L30 Days | 5 | 99.8 | 3.87 | 3.23 | 22.3% | 6.2% | 10.8% | 43.8% | 32.6% | 26.4% |
| 2016 | 25 | 99.8 | 4.03 | 4.04 | 22.3% | 7.3% | 9.8% | 43.8% | 34.7% | 27.9% |
| 2015 | 23 | 106.1 | 4.20 | 3.75 | 22.9% | 11.7% | 10.1% | 46.8% | 29.8% | 28.3% |
Home (2015-16):—ERA: 4.35 — K%: 23.6% — wOBA Allowed: 0.324
Away (2015-16):—ERA: 3.46 — K%: 21.6% — wOBA Allowed: 0.331
Rodon has been sharp in his last five starts, posting a 3.23 ERA with a strikeout rate of 22.3%. He has pitched well on the road in his career and he sees a favorable ballpark shift playing in Kauffman Stadium. The biggest issue with Rodon is his inability to get right-handed hitters out. He has allowed a .349 wOBA to righties this season and the Royals’ projected lineup has eight batters that can hit from the right side. As an underdog on the road, Rodon is an easy fade in all league formats.
| Yordano Ventura | ||||||||||
 | FanDuel | DraftKings | ||||||||
| Salary: | $8,400 | Salary: | ||||||||
| FPPG: | 25.9 | FPPG: | ||||||||
| Pitcher Rating: | 63.7 | Pitcher Rank: | 9 | |||||||
| Statistics | Starts | PitchPS | SIERA | ERA | K% | BB% | SS% | GB% | FB% | HC% |
|---|---|---|---|---|---|---|---|---|---|---|
| L30 Days | 5 | 99.6 | 5.33 | 4.23 | 13.1% | 11.5% | 8.2% | 53.6% | 24.7% | 20.6% |
| 2016 | 29 | 95.0 | 4.80 | 4.42 | 17.1% | 9.9% | 8.8% | 50.5% | 30.5% | 31.0% |
| 2015 | 28 | 94.7 | 3.69 | 4.08 | 22.5% | 8.4% | 10.4% | 52.2% | 27.2% | 29.8% |
Home (2015-16):—ERA: 4.14 — K%: 21.5% — wOBA Allowed: 0.304
Away (2015-16):—ERA: 4.34 — K%: 18.3% — wOBA Allowed: 0.324
Ventura has really struggled in his last five starts, posting a 5.33 SIERA with a strikeout rate of 13.1% and a walk rate of 11.5%. He is a ground ball pitcher that tends to limit the hard contact against him, but when he isn’t striking batters out, a lot of those ground balls are going for hits. He is a small favorite today against the White Sox, but his his current form is more than enough justification to fade him in all formats.
Batter Grind Down
Chicago White Sox
The White Sox have not hit right-handed pitching well this season, but they come into the game with the eighth highest team wOBA over the last month of play. They draw an exploitable matchup against Yordano Ventura, who has allowed a .319+ wOBA to both left and right-handed hitters this season. Jose Abreu is the one batter that stands out here, as he has a .442 wOBA over the last 14 days.
- White Sox Offense (2016)
Team wOBA vs. RHP — 0.308 (24 of 30)
Team wOBA L30 Days — 0.327 (8 of 30)
Team ISO vs. RHP — 0.145 (24 of 30)
Team K% vs. RHP — 20.8% (16 of 30)
Pitches Per PA vs. RHP — 3.86 (16 of 30)
Runs Per Game — 4.19 (23 of 30)
Projected Run Total — 4.09 (18 of 22)
Projected Lineup
| # | Player | Bats | wOBA vs. RHP | ISO vs. RHP | HC% vs. RHP | wOBA L14 | FD Position | FD Salary | DK Position | DK Salary |
|---|---|---|---|---|---|---|---|---|---|---|
| 1 | Adam Eaton | LEFT | 0.348 | 0.164 | 32.2% | 0.347 | OF | $3,100 | ||
| 2 | Tim Anderson | RIGHT | 0.287 | 0.121 | 30.0% | 0.268 | SS | $2,900 | ||
| 3 | Jose Abreu | RIGHT | 0.355 | 0.162 | 31.4% | 0.442 | 1B | $3,400 | ||
| 4 | Melky Cabrera | SWITCH | 0.334 | 0.141 | 28.8% | 0.373 | OF | $3,000 | ||
| 5 | Todd Frazier | RIGHT | 0.316 | 0.222 | 31.0% | 0.279 | 3B | $3,700 | ||
| 6 | Alex Avila | LEFT | 0.318 | 0.153 | 34.6% | 0.292 | C | $2,500 | ||
| 7 | Avisail Garcia | RIGHT | 0.300 | 0.129 | 33.7% | 0.346 | OF | $3,200 | ||
| 8 | Carlos Sanchez | SWITCH | 0.255 | 0.133 | 23.3% | 0.289 | 2B | $2,600 | ||
| 9 | Leury Garcia | SWITCH | 0.000 | 0.000 | 0.0% | 0.000 | ||||
| Team Averages | — | 0.279 | 0.136 | 27.2% | 0.293 | — | — | — | — |
Elite Plays – Jose Abreu
Secondary Plays – Adam Eaton, Melky Cabrera
Stackability – ORANGE / YELLOW
Kansas City
The Royals are ranked below the major league average in both team wOBA and team ISO against left-handed pitching. They have all but been eliminated from the postseason, as they find themselves five games back of the last wildcard spot. This is a team that we are usually bearish on in DFS, but they draw a decent matchup against Carlos Rodon, who has allowed a .349 wOBA and 18 home runs to right-handed hitters this season.
- Royals Offense (2016)
Team wOBA vs. LHP — 0.320 (17 of 30)
Team wOBA L30 Days — 0.306 (23 of 30)
Team ISO vs. LHP — 0.157 (19 of 30)
Team K% vs. LHP — 20.2% (8 of 30)
Pitches Per PA vs. LHP — 3.78 (27 of 30)
Runs Per Game — 4.14 (25 of 30)
Projected Run Total — 4.41 (8 of 22)
Projected Lineup
| # | Player | Bats | wOBA vs. LHP | ISO vs. LHP | HC% vs. LHP | wOBA L14 | FD Position | FD Salary | DK Position | DK Salary |
|---|---|---|---|---|---|---|---|---|---|---|
| 1 | Billy Burns | SWITCH | 0.294 | 0.099 | 10.7% | 0.263 | OF | $2,200 | ||
| 2 | Whit Merrifield | RIGHT | 0.379 | 0.138 | 46.9% | 0.347 | 2B | $2,900 | ||
| 3 | Eric Hosmer | LEFT | 0.292 | 0.163 | 30.6% | 0.355 | 1B | $2,900 | ||
| 4 | Kendrys Morales | SWITCH | 0.359 | 0.200 | 35.2% | 0.448 | 1B | $3,100 | ||
| 5 | Salvador Perez | RIGHT | 0.324 | 0.223 | 29.9% | 0.209 | C | $3,200 | ||
| 6 | Alcides Escobar | RIGHT | 0.249 | 0.084 | 26.8% | 0.386 | SS | $2,800 | ||
| 7 | Cheslor Cuthbert | RIGHT | 0.358 | 0.157 | 33.3% | 0.160 | 3B | $2,800 | ||
| 8 | Hunter Dozier | RIGHT | 0.530 | 0.250 | 100.0% | 0.333 | ||||
| 9 | Christian Colon | RIGHT | 0.267 | 0.089 | 26.5% | 0.273 | 2B | $2,300 | ||
| Team Averages | — | 0.339 | 0.156 | 37.8% | 0.308 | — | — | — | — |
Elite Plays – NONE
Secondary Plays – Whit Merrifield, Kendrys Morales, Salvador Perez
Stackability – ORANGE / YELLOW
Boston at Baltimore – 7:05 PM ET
| Boston | Baltimore | ||||||||
 | Rick Porcello |  | Dylan Bundy | ||||||
| RIGHT | RIGHT | ||||||||
| Vegas Moneyline | Vegas Over/Under | ||||||||
| BOS -123 | 9.0 | ||||||||
| Stats | wOBA | HR All. | HC% | K% | Stats | wOBA | HR All. | HC% | K% |
|---|---|---|---|---|---|---|---|---|---|
| SP vs. Left (2016) | 0.259 | 8 | 33.4% | 21.6% | SP vs. Left (2016) | 0.319 | 8 | 27.1% | 19.2% |
| SP vs. Right (2016) | 0.292 | 13 | 28.6% | 20.0% | SP vs. Right (2016) | 0.342 | 8 | 28.0% | 25.7% |
Pitcher Grind Down
| Rick Porcello | ||||||||||
 | FanDuel | DraftKings | ||||||||
| Salary: | $9,600 | Salary: | $9,700 | |||||||
| FPPG: | 37.9 | FPPG: | 20.1 | |||||||
| Pitcher Rating: | 69.4 | Pitcher Rank: | 6 | |||||||
| Statistics | Starts | PitchPS | SIERA | ERA | K% | BB% | SS% | GB% | FB% | HC% |
|---|---|---|---|---|---|---|---|---|---|---|
| L30 Days | 6 | 109.5 | 3.44 | 2.47 | 23.0% | 1.8% | 9.4% | 42.3% | 40.7% | 30.1% |
| 2016 | 30 | 103.4 | 3.80 | 3.12 | 20.8% | 3.6% | 7.8% | 44.7% | 36.9% | 31.1% |
| 2015 | 28 | 98.0 | 3.73 | 4.92 | 20.2% | 5.2% | 8.5% | 45.7% | 32.5% | 32.8% |
Home (2015-16):—ERA: 3.49 — K%: 21.2% — wOBA Allowed: 0.295
Away (2015-16):—ERA: 4.39 — K%: 20.0% — wOBA Allowed: 0.316
Porcello has been terrific over the last month of play, boasting a 2.47 ERA with a strikeout rate of 23%. He always has great command and he has a much lower ERA than what you would expect from a pitcher in the American League East. He draws a boom or bust type of matchup tonight against the Orioles, who are ranked third in team wOBA and 20th in team K% against right-handed pitching. This is an important series for both teams, as Boston currently holds a three-game lead over Baltimore in the division.
| Dylan Bundy | ||||||||||
 | FanDuel | DraftKings | ||||||||
| Salary: | $7,100 | Salary: | $5,500 | |||||||
| FPPG: | 16.6 | FPPG: | 8.2 | |||||||
| Pitcher Rating: | 48.9 | Pitcher Rank: | 17 | |||||||
| Statistics | Starts | PitchPS | SIERA | ERA | K% | BB% | SS% | GB% | FB% | HC% |
|---|---|---|---|---|---|---|---|---|---|---|
| L30 Days | 5 | 93.4 | 5.09 | 5.47 | 22.6% | 14.8% | 11.1% | 33.8% | 42.3% | 21.1% |
| 2016 | 12 | 91.7 | 4.21 | 3.88 | 22.3% | 9.1% | 10.6% | 35.6% | 42.9% | 27.5% |
Home (2015-16):—ERA: 2.72 — K%: 22.2% — wOBA Allowed: 0.289
Away (2015-16):—ERA: 5.21 — K%: 22.3% — wOBA Allowed: 0.372
Bundy comes into tonight’s game in less than ideal form, posting a 5.09 SIERA with a walk rate of 14.8% in his last five starts. The sledding is only going to get tougher tonight, as he squares off against the best offense in baseball. Bundy is listed as a small underdog at home against the Red Sox in a game that features an over/under of 9.0 runs. He grades out as one of the worst pitching options in the slate.
Batter Grind Down
Boston
The Red Sox are a better offensive team at home, but there are plenty of reasons to like them tonight in Baltimore. They draw a favorable matchup against rookie Dylan Bundy, who has struggled in his last five starts. Boston comes into the game with the sixth highest run projection in the slate. They also have eight projected starters with at least a 33% hard contact rate against right-handed pitching.
- Red Sox Offense (2016)
Team wOBA vs. RHP — 0.351 (1 of 30)
Team wOBA L30 Days — 0.353 (1 of 30)
Team ISO vs. RHP — 0.187 (5 of 30)
Team K% vs. RHP — 18.0% (3 of 30)
Pitches Per PA vs. RHP — 3.93 (7 of 30)
Runs Per Game — 5.57 (1 of 30)
Projected Run Total — 4.64 (6 of 22)
Projected Lineup
| # | Player | Bats | wOBA vs. RHP | ISO vs. RHP | HC% vs. RHP | wOBA L14 | FD Position | FD Salary | DK Position | DK Salary |
|---|---|---|---|---|---|---|---|---|---|---|
| 1 | Dustin Pedroia | RIGHT | 0.363 | 0.132 | 33.7% | 0.355 | 2B | $3,300 | 2B | $4,600 |
| 2 | Xander Bogaerts | RIGHT | 0.344 | 0.151 | 29.2% | 0.308 | SS | $4,000 | SS | $4,700 |
| 3 | David Ortiz | LEFT | 0.444 | 0.360 | 46.5% | 0.400 | 1B | $4,600 | 1B | $5,500 |
| 4 | Mookie Betts | RIGHT | 0.383 | 0.215 | 33.5% | 0.277 | OF | $4,100 | OF | $5,400 |
| 5 | Hanley Ramirez | RIGHT | 0.344 | 0.185 | 37.3% | 0.472 | 1B | $3,700 | 1B | $5,200 |
| 6 | Travis Shaw | LEFT | 0.336 | 0.189 | 36.9% | 0.313 | 3B | $2,600 | 1B/3B | $4,500 |
| 7 | Sandy Leon | SWITCH | 0.356 | 0.160 | 35.3% | 0.270 | C | $2,600 | C | $3,600 |
| 8 | Jackie Bradley Jr. | LEFT | 0.383 | 0.266 | 39.5% | 0.369 | OF | $3,500 | OF | $5,100 |
| 9 | Andrew Benintendi | LEFT | 0.416 | 0.228 | 33.3% | 0.453 | OF | $3,000 | OF | $2,900 |
| Team Averages | — | 0.374 | 0.210 | 36.1% | 0.357 | — | — | — | — |
Elite Plays – Dustin Pedroia, David Ortiz, Mookie Betts
Secondary Plays – Xander Bogaerts, Hanley Ramirez, Travis Shaw, Sandy Leon
Stackability – YELLOW / GREEN
Baltimore
The Orioles are one of the top offenses in baseball when it comes to hitting right-handed pitching, but they draw a fairly difficult matchup tonight against Rick Porcello. In 2016, he has held both left and right-handed hitters under a .295 wOBA. The good news is that the Orioles get to face him at home and they still have a respectable implied team total.
- Orioles Offense (2016)
Team wOBA vs. RHP — 0.339 (3 of 30)
Team wOBA L30 Days — 0.324 (16 of 30)
Team ISO vs. RHP — 0.202 (1 of 30)
Team K% vs. RHP — 21.6% (20 of 30)
Pitches Per PA vs. RHP — 3.86 (18 of 30)
Runs Per Game — 4.70 (11 of 30)
Projected Run Total — 4.36 (11 of 22)
Projected Lineup
| # | Player | Bats | wOBA vs. RHP | ISO vs. RHP | HC% vs. RHP | wOBA L14 | FD Position | FD Salary | DK Position | DK Salary |
|---|---|---|---|---|---|---|---|---|---|---|
| 1 | Adam Jones | RIGHT | 0.351 | 0.202 | 31.6% | 0.304 | OF | $3,400 | OF | $3,800 |
| 2 | Hyun-Soo Kim | LEFT | 0.371 | 0.117 | 32.1% | 0.359 | OF | $3,000 | OF | $2,800 |
| 3 | Manny Machado | RIGHT | 0.372 | 0.260 | 34.9% | 0.317 | 3B | $3,600 | 3B/SS | $4,200 |
| 4 | Chris Davis | LEFT | 0.361 | 0.284 | 42.6% | 0.402 | 1B | $3,600 | 1B | $3,800 |
| 5 | Mark Trumbo | RIGHT | 0.376 | 0.284 | 38.6% | 0.235 | OF | $3,200 | OF | $3,700 |
| 6 | Jonathan Schoop | RIGHT | 0.341 | 0.206 | 29.2% | 0.265 | 2B | $3,000 | 2B | $3,700 |
| 7 | Pedro Alvarez | LEFT | 0.356 | 0.273 | 40.1% | 0.316 | 3B | $3,500 | 1B | $3,500 |
| 8 | Matt Wieters | SWITCH | 0.313 | 0.181 | 32.3% | 0.346 | C | $2,800 | C | $3,600 |
| 9 | J.J. Hardy | RIGHT | 0.315 | 0.134 | 32.4% | 0.418 | SS | $2,700 | SS | $3,100 |
| Team Averages | — | 0.351 | 0.216 | 34.9% | 0.329 | — | — | — | — |
Elite Plays – Chris Davis
Secondary Plays – Manny Machado, Mark Trumbo
Stackability – ORANGE / YELLOW
Atlanta at NY Mets – 7:10 PM ET
| Atlanta | NY Mets | ||||||||
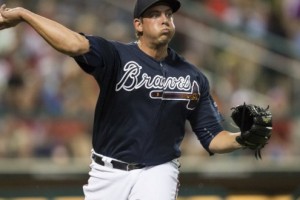
 | Aaron Blair |  | Noah Syndergaard | ||||||
| RIGHT | RIGHT | ||||||||
| Vegas Moneyline | Vegas Over/Under | ||||||||
| NYM -284 | 7.0 | ||||||||
| Stats | wOBA | HR All. | HC% | K% | Stats | wOBA | HR All. | HC% | K% |
|---|---|---|---|---|---|---|---|---|---|
| SP vs. Left (2016) | 0.439 | 6 | 32.3% | 9.9% | SP vs. Left (2016) | 0.296 | 5 | 31.3% | 28.5% |
| SP vs. Right (2016) | 0.357 | 5 | 28.0% | 15.1% | SP vs. Right (2016) | 0.256 | 5 | 25.3% | 30.0% |
Pitcher Grind Down
| Aaron Blair | ||||||||||
 | FanDuel | DraftKings | ||||||||
| Salary: | $4,100 | Salary: | $4,100 | |||||||
| FPPG: | 9.2 | FPPG: | 2.2 | |||||||
| Pitcher Rating: | 32.8 | Pitcher Rank: | 22 | |||||||
| Statistics | Starts | PitchPS | SIERA | ERA | K% | BB% | SS% | GB% | FB% | HC% |
|---|---|---|---|---|---|---|---|---|---|---|
| L30 Days | 1 | 67.0 | 4.36 | 11.25 | 15.0% | 0.0% | 9.0% | 31.3% | 37.5% | 43.8% |
| 2016 | 12 | 80.3 | 5.82 | 8.23 | 12.4% | 11.2% | 9.0% | 40.5% | 37.4% | 30.2% |
Home (2015-16):—ERA: 8.18 — K%: 10.8% — wOBA Allowed: 0.383
Away (2015-16):—ERA: 8.31 — K%: 14.9% — wOBA Allowed: 0.422
Blair has been an easy pitcher to pick on this season. In 12 starts, he has a 5.82 SIERA with a strikeout rate of 12.4% and a walk rate of 11.2%. Of the 22 pitchers that are taking the mound today, he has the lowest pitcher rating by far. He draws a difficult matchup against the Mets, who are ranked sixth in team wOBA over the last month of play. Avoid Blair in both cash games and tournaments.
| Noah Syndergaard | ||||||||||
 | FanDuel | DraftKings | ||||||||
| Salary: | $11,000 | Salary: | $11,600 | |||||||
| FPPG: | 39.7 | FPPG: | 22.1 | |||||||
| Pitcher Rating: | 98.9 | Pitcher Rank: | 1 | |||||||
| Statistics | Starts | PitchPS | SIERA | ERA | K% | BB% | SS% | GB% | FB% | HC% |
|---|---|---|---|---|---|---|---|---|---|---|
| L30 Days | 5 | 101.0 | 3.41 | 1.06 | 27.9% | 8.2% | 13.7% | 53.2% | 31.2% | 24.4% |
| 2016 | 28 | 98.0 | 2.95 | 2.43 | 29.3% | 5.7% | 14.5% | 50.8% | 27.1% | 27.9% |
| 2015 | 24 | 99.2 | 2.95 | 3.24 | 27.5% | 5.1% | 12.2% | 46.5% | 33.6% | 24.6% |
Home (2015-16):—ERA: 2.48 — K%: 28.9% — wOBA Allowed: 0.249
Away (2015-16):—ERA: 3.20 — K%: 28.1% — wOBA Allowed: 0.306
Syndergaard and the Mets aren’t going to catch the Nationals for the division title, but they look poised to claim one of the wildcard spots. They should be able to pick up a win tonight against the Braves at home. Syndergaard has been dominant this season with a 2.95 SIERA and a strikeout rate of 29.3%. The Braves have been much better offensively over the last month of play, but I’m willing to overlook that in a home start for Thor. He is the top pitching option in the slate, slightly edging out Clayton Kershaw and Madison Bumgarner.
Batter Grind Down
Atlanta
The Braves have been one of the hottest offenses in baseball, ranking second in team wOBA over the last month of play. Unfortunately, they draw one of the most difficult matchups in the slate. In addition to an elite strikeout rate, Noah Syndergaard has held both left and right-handed hitters under a .300 wOBA. With the lowest run projection in the slate, the Braves’ offense can be avoided tonight.
- Braves Offense (2016)
Team wOBA vs. RHP — 0.307 (25 of 30)
Team wOBA L30 Days — 0.347 (2 of 30)
Team ISO vs. RHP — 0.137 (28 of 30)
Team K% vs. RHP — 19.1% (6 of 30)
Pitches Per PA vs. RHP — 3.71 (29 of 30)
Runs Per Game — 3.95 (28 of 30)
Projected Run Total — 2.44 (22 of 22)
Projected Lineup
| # | Player | Bats | wOBA vs. RHP | ISO vs. RHP | HC% vs. RHP | wOBA L14 | FD Position | FD Salary | DK Position | DK Salary |
|---|---|---|---|---|---|---|---|---|---|---|
| 1 | Ender Inciarte | LEFT | 0.317 | 0.103 | 25.6% | 0.327 | OF | $2,900 | OF | $3,700 |
| 2 | Adonis Garcia | RIGHT | 0.300 | 0.155 | 31.9% | 0.246 | 3B | $2,700 | 3B | $3,300 |
| 3 | Freddie Freeman | LEFT | 0.410 | 0.290 | 43.0% | 0.387 | 1B | $3,600 | 1B | $4,000 |
| 4 | Matt Kemp | RIGHT | 0.319 | 0.209 | 36.2% | 0.459 | OF | $3,600 | OF | $3,700 |
| 5 | Nick Markakis | LEFT | 0.342 | 0.159 | 34.1% | 0.425 | OF | $3,000 | OF | $4,000 |
| 6 | Tyler Flowers | RIGHT | 0.349 | 0.147 | 47.3% | 0.346 | C | $2,400 | C | $3,000 |
| 7 | Jace Peterson | LEFT | 0.341 | 0.146 | 24.6% | 0.379 | 2B | $2,500 | 2B | $3,000 |
| 8 | Dansby Swanson | RIGHT | 0.291 | 0.089 | 32.8% | 0.392 | SS | $2,900 | SS | $2,300 |
| 9 | Aaron Blair | RIGHT | 0.125 | 0.000 | 0.0% | P | $4,100 | P | $4,100 | |
| Team Averages | — | 0.310 | 0.144 | 30.6% | 0.370 | — | — | — | — |
Elite Plays – NONE
Secondary Plays – NONE
Stackability – RED
NY Mets
The Mets’ season long numbers are a bit misleading, as their best hitters have been in and out of the lineup all year. Over the last month of play, they have the sixth highest wOBA of any team in baseball. They draw arguably the top matchup in the slate, as they host Aaron Blair and the Braves. In 12 starts this season, Blair has allowed a .439 wOBA to left-handed hitters and a .357 wOBA to right-handed hitters.
- Mets Offense (2016)
Team wOBA vs. RHP — 0.307 (25 of 30)
Team wOBA L30 Days — 0.328 (6 of 30)
Team ISO vs. RHP — 0.168 (13 of 30)
Team K% vs. RHP — 21.7% (21 of 30)
Pitches Per PA vs. RHP — 3.91 (8 of 30)
Runs Per Game — 3.93 (29 of 30)
Projected Run Total — 4.56 (7 of 22)
Projected Lineup
| # | Player | Bats | wOBA vs. RHP | ISO vs. RHP | HC% vs. RHP | wOBA L14 | FD Position | FD Salary | DK Position | DK Salary |
|---|---|---|---|---|---|---|---|---|---|---|
| 1 | Jose Reyes | SWITCH | 0.281 | 0.127 | 26.2% | 0.324 | 3B | $2,800 | 3B/SS | $4,400 |
| 2 | Asdrubal Cabrera | SWITCH | 0.335 | 0.204 | 36.1% | 0.366 | SS | $3,400 | SS | $4,300 |
| 3 | Yoenis Cespedes | RIGHT | 0.359 | 0.254 | 38.0% | 0.296 | OF | $4,100 | OF | $4,700 |
| 4 | Curtis Granderson | LEFT | 0.335 | 0.245 | 38.8% | 0.427 | OF | $3,700 | OF | $4,700 |
| 5 | Jay Bruce | LEFT | 0.347 | 0.265 | 39.6% | 0.190 | OF | $3,000 | OF | $4,200 |
| 6 | T.J. Rivera | RIGHT | 0.390 | 0.167 | 22.9% | 0.439 | 3B | $2,400 | 2B/3B | $2,900 |
| 7 | James Loney | LEFT | 0.311 | 0.121 | 30.1% | 0.345 | 1B | $2,600 | 1B | $3,200 |
| 8 | Travis D’Arnaud | RIGHT | 0.297 | 0.101 | 31.8% | 0.191 | C | $2,200 | C | $2,800 |
| 9 | Noah Syndergaard | RIGHT | 0.313 | 0.273 | 42.9% | 0.489 | P | $11,000 | P | $11,600 |
| Team Averages | — | 0.330 | 0.195 | 34.0% | 0.341 | — | — | — | — |
Elite Plays – Asdrubal Cabrera, Yoenis Cespedes, Curtis Granderson
Secondary Plays – Jose Reyes, Jay Bruce, T.J. Rivera
Stackability – GREEN
Washington at Miami – 7:10 PM ET
| Washington | Miami | ||||||||
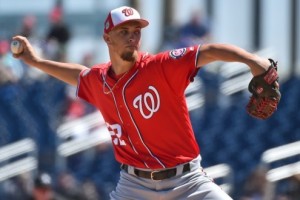
 | A.J. Cole |  | Wei-Yin Chen | ||||||
| RIGHT | LEFT | ||||||||
| Vegas Moneyline | Vegas Over/Under | ||||||||
| WAS -123 | 8.5 | ||||||||
| Stats | wOBA | HR All. | HC% | K% | Stats | wOBA | HR All. | HC% | K% |
|---|---|---|---|---|---|---|---|---|---|
| SP vs. Left (2016) | 0.335 | 3 | 23.4% | 25.0% | SP vs. Left (2016) | 0.320 | 1 | 33.9% | 18.4% |
| SP vs. Right (2016) | 0.307 | 3 | 21.2% | 26.0% | SP vs. Right (2016) | 0.341 | 19 | 35.7% | 19.2% |
Pitcher Grind Down
| A.J. Cole | ||||||||||
 | FanDuel | DraftKings | ||||||||
| Salary: | $6,000 | Salary: | $7,400 | |||||||
| FPPG: | 29.2 | FPPG: | 15.7 | |||||||
| Pitcher Rating: | 73.8 | Pitcher Rank: | 5 | |||||||
| Statistics | Starts | PitchPS | SIERA | ERA | K% | BB% | SS% | GB% | FB% | HC% |
|---|---|---|---|---|---|---|---|---|---|---|
| L30 Days | 5 | 98.4 | 4.00 | 4.71 | 25.4% | 7.4% | 10.8% | 31.3% | 57.5% | 22.5% |
| 2016 | 5 | 98.4 | 4.00 | 4.71 | 25.4% | 7.4% | 10.8% | 31.3% | 57.5% | 22.5% |
| 2015 | 1 | 91.0 | 3.27 | 5.79 | 20.5% | 2.3% | 8.3% | 36.4% | 36.4% | 32.4% |
Home (2015-16):—ERA: 5.40 — K%: 28.4% — wOBA Allowed: 0.344
Away (2015-16):—ERA: 4.50 — K%: 19.2% — wOBA Allowed: 0.309
Cole has pitched fairly well in his five starts this season, posting a 4.00 SIERA with a strikeout rate of 25.4% and a walk rate of 7.4%. He generates a healthy number of swinging strikes and he has done a tremendous job of limiting hard contact (22.5%). He comes into tonight’s game as a small favorite against the Marlins, who are ranked 22nd in team wOBA and 29th in team ISO against right-handed pitching this season. Everything lines up for Cole, the only concern is that he is a young pitcher that is on the road.
| Wei-Yin Chen | ||||||||||
 | FanDuel | DraftKings | ||||||||
| Salary: | $8,200 | Salary: | $6,400 | |||||||
| FPPG: | 24.9 | FPPG: | 12.4 | |||||||
| Pitcher Rating: | 63.7 | Pitcher Rank: | 10 | |||||||
| Statistics | Starts | PitchPS | SIERA | ERA | K% | BB% | SS% | GB% | FB% | HC% |
|---|---|---|---|---|---|---|---|---|---|---|
| 2016 | 19 | 90.0 | 4.22 | 4.99 | 19.1% | 4.9% | 9.1% | 39.4% | 39.1% | 35.4% |
| 2015 | 31 | 97.1 | 3.97 | 3.34 | 19.3% | 5.2% | 8.6% | 40.5% | 39.4% | 28.3% |
Home (2015-16):—ERA: 4.10 — K%: 19.2% — wOBA Allowed: 0.331
Away (2015-16):—ERA: 3.75 — K%: 19.2% — wOBA Allowed: 0.327
Chen has been out for the last two months dealing with an elbow injury. He wasn’t expected to rejoin the rotation this season, but he has made it through a few simulated starts without any issues. He will likely be on a pitch count tonight, as he takes on the Nationals. Even if Chen was completely healthy, he would be an easy fade in daily fantasy. The Nationals are ranked fifth in team wOBA and second in team ISO against left-handed pitching this season.
Batter Grind Down
Washington
The Nationals have been a top offense against southpaws this season. While Marlins Park isn’t great for home runs, it is a good ballpark for doubles and triples. They draw a favorable matchup tonight against Wei-Yin Chen. In terms of his splits, Chen has allowed a .320 wOBA to left-handed hitters and a .341 wOBA to right-handed hitters this season.
- Nationals Offense (2016)
Team wOBA vs. LHP — 0.332 (5 of 30)
Team wOBA L30 Days — 0.318 (18 of 30)
Team ISO vs. LHP — 0.198 (2 of 30)
Team K% vs. LHP — 20.7% (11 of 30)
Pitches Per PA vs. LHP — 3.82 (22 of 30)
Runs Per Game — 4.71 (9 of 30)
Projected Run Total — 4.39 (9 of 22)
Projected Lineup
| # | Player | Bats | wOBA vs. LHP | ISO vs. LHP | HC% vs. LHP | wOBA L14 | FD Position | FD Salary | DK Position | DK Salary |
|---|---|---|---|---|---|---|---|---|---|---|
| 1 | Trea Turner | RIGHT | 0.327 | 0.060 | 43.9% | 0.515 | OF | $4,600 | 2B/OF | $5,500 |
| 2 | Jayson Werth | RIGHT | 0.437 | 0.289 | 46.1% | 0.226 | OF | $3,700 | OF | $3,900 |
| 3 | Daniel Murphy | LEFT | 0.383 | 0.219 | 31.2% | 0.450 | 2B | $4,000 | 2B | $4,700 |
| 4 | Bryce Harper | LEFT | 0.329 | 0.226 | 33.0% | 0.216 | OF | $3,700 | OF | $4,400 |
| 5 | Anthony Rendon | RIGHT | 0.362 | 0.156 | 37.2% | 0.370 | 3B | $3,600 | 3B | $4,500 |
| 6 | Wilson Ramos | RIGHT | 0.389 | 0.292 | 32.6% | 0.249 | C | $3,500 | C | $3,600 |
| 7 | Ryan Zimmerman | RIGHT | 0.283 | 0.219 | 38.1% | 0.205 | 1B | $3,000 | 1B | $3,300 |
| 8 | Danny Espinosa | SWITCH | 0.293 | 0.257 | 41.3% | 0.222 | SS | $2,700 | SS | $3,000 |
| 9 | A.J. Cole | RIGHT | 0.000 | 0.000 | 0.0% | 0.000 | P | $6,000 | P | $7,400 |
| Team Averages | — | 0.311 | 0.191 | 33.7% | 0.273 | — | — | — | — |
Elite Plays – Trea Turner, Jayson Werth, Anthony Rendon
Secondary Plays – Daniel Murphy, Bryce Harper, Wilson Ramos
Stackability – YELLOW / GREEN
Miami
The Marlins have been ice cold at the plate, ranking 28th in team wOBA over the last month of play. They come into the game with the sixth lowest run projection in the slate, as they square off against rookie A.J. Cole. Even though the Marlins could get to Cole early, it’s hard to justify recommending any of their hitters as elite plays.
- Marlins Offense (2016)
Team wOBA vs. RHP — 0.311 (22 of 30)
Team wOBA L30 Days — 0.283 (28 of 30)
Team ISO vs. RHP — 0.130 (29 of 30)
Team K% vs. RHP — 18.9% (4 of 30)
Pitches Per PA vs. RHP — 3.80 (26 of 30)
Runs Per Game — 4.10 (27 of 30)
Projected Run Total — 4.11 (17 of 22)
Projected Lineup
| # | Player | Bats | wOBA vs. RHP | ISO vs. RHP | HC% vs. RHP | wOBA L14 | FD Position | FD Salary | DK Position | DK Salary |
|---|---|---|---|---|---|---|---|---|---|---|
| 1 | Dee Gordon | LEFT | 0.277 | 0.067 | 18.6% | 0.292 | 2B | $2,800 | 2B | $4,600 |
| 2 | Ichiro Suzuki | LEFT | 0.317 | 0.090 | 23.5% | 0.389 | OF | $2,400 | OF | $4,000 |
| 3 | Martin Prado | RIGHT | 0.306 | 0.098 | 25.4% | 0.278 | 3B | $3,400 | 3B | $3,700 |
| 4 | Christian Yelich | LEFT | 0.388 | 0.211 | 42.0% | 0.241 | OF | $2,900 | OF | $4,600 |
| 5 | Marcell Ozuna | RIGHT | 0.320 | 0.163 | 34.2% | 0.343 | OF | $3,200 | OF | $3,600 |
| 6 | Justin Bour | LEFT | 0.360 | 0.254 | 37.9% | 0.214 | 1B | $2,100 | 1B | $3,600 |
| 7 | J.T. Realmuto | RIGHT | 0.357 | 0.122 | 30.8% | 0.360 | C | $2,700 | C | $4,300 |
| 8 | Adeiny Hechavarria | RIGHT | 0.260 | 0.069 | 31.0% | 0.205 | SS | $2,000 | SS | $2,400 |
| 9 | Wei-Yin Chen | LEFT | 0.000 | 0.000 | 0.0% | P | $8,200 | P | $6,400 | |
| Team Averages | — | 0.287 | 0.119 | 27.0% | 0.290 | — | — | — | — |
Elite Plays – NONE
Secondary Plays – Dee Gordon (FD), Christian Yelich
Stackability – ORANGE
Cincinnati at Chicago Cubs – 8:05 PM ET
| Cincinnati | Chicago Cubs | ||||||||
 | Tim Adleman |  | Jason Hammel | ||||||
| RIGHT | RIGHT | ||||||||
| Vegas Moneyline | Vegas Over/Under | ||||||||
| CHC -227 | 9.5 | ||||||||
| Stats | wOBA | HR All. | HC% | K% | Stats | wOBA | HR All. | HC% | K% |
|---|---|---|---|---|---|---|---|---|---|
| SP vs. Left (2016) | 0.391 | 7 | 31.3% | 21.1% | SP vs. Left (2016) | 0.350 | 11 | 33.7% | 20.2% |
| SP vs. Right (2016) | 0.322 | 4 | 35.4% | 11.6% | SP vs. Right (2016) | 0.284 | 12 | 32.3% | 21.4% |
Pitcher Grind Down
| Tim Adleman | ||||||||||
 | FanDuel | DraftKings | ||||||||
| Salary: | $5,800 | Salary: | $5,400 | |||||||
| FPPG: | 20.8 | FPPG: | 10.1 | |||||||
| Pitcher Rating: | 35.2 | Pitcher Rank: | 20 | |||||||
| Statistics | Starts | PitchPS | SIERA | ERA | K% | BB% | SS% | GB% | FB% | HC% |
|---|---|---|---|---|---|---|---|---|---|---|
| L30 Days | 6 | 84.7 | 5.25 | 4.50 | 13.5% | 6.8% | 10.0% | 35.0% | 45.0% | 36.9% |
| 2016 | 10 | 84.4 | 5.06 | 4.21 | 15.7% | 8.3% | 9.6% | 39.0% | 42.9% | 33.8% |
Home (2015-16):—ERA: 4.45 — K%: 17.1% — wOBA Allowed: 0.336
Away (2015-16):—ERA: 3.91 — K%: 14.0% — wOBA Allowed: 0.376
Adleman has been one of the most hittable pitchers in baseball this season. He has a 5.06 SIERA with a strikeout rate of 15.7% and a hard contact rate of 33.8%. To make matters worse, he is facing a Cubs’ offense in Wrigley Field with a generous wind blowing out to center field. It’s hard to imagine a fly ball pitcher with a low strikeout rate performing well in this spot. Avoid Adleman and stack the hitters against him.
| Jason Hammel | ||||||||||
 | FanDuel | DraftKings | ||||||||
| Salary: | $8,400 | Salary: | $7,700 | |||||||
| FPPG: | 26.0 | FPPG: | 13.3 | |||||||
| Pitcher Rating: | 77.5 | Pitcher Rank: | 4 | |||||||
| Statistics | Starts | PitchPS | SIERA | ERA | K% | BB% | SS% | GB% | FB% | HC% |
|---|---|---|---|---|---|---|---|---|---|---|
| L30 Days | 5 | 86.6 | 4.53 | 8.61 | 19.8% | 7.8% | 11.8% | 32.5% | 42.5% | 46.3% |
| 2016 | 28 | 88.2 | 4.29 | 3.60 | 20.9% | 7.8% | 10.0% | 42.5% | 38.0% | 32.9% |
| 2015 | 31 | 88.7 | 3.45 | 3.74 | 24.2% | 5.6% | 10.9% | 38.3% | 37.2% | 32.9% |
Home (2015-16):—ERA: 2.94 — K%: 22.0% — wOBA Allowed: 0.287
Away (2015-16):—ERA: 4.39 — K%: 23.2% — wOBA Allowed: 0.329
Hammel has had a roller coaster season. We seem to be to the part of the roller coaster that tickles your stomach (the downhill part). In this last five starts, he has an ERA of 8.61 with a strikeout rate of 19.8%. He is only averaging 88.2 pitches per game this season, which limits his upside. Even though he is the largest favorite in the slate, I’m not a huge fan of Hammel tonight. The Reds have the fifth highest team wOBA over the last month of play and as I mentioned above, the wind is blowing out to center field.
Batter Grind Down
Cincinnati
The Reds come into tonight’s game with the fourth lowest run projection, but I see them as a sneaky contrarian stack. They have quietly been a top five offense over the last month of play and they get to face a struggling pitcher with the wind blowing out to center field. Give a sizable advantage to the left-handed hitters here, as Hammel has allowed a .350 wOBA to lefties this season.
- Reds Offense (2016)
Team wOBA vs. RHP — 0.313 (18 of 30)
Team wOBA L30 Days — 0.330 (5 of 30)
Team ISO vs. RHP — 0.155 (21 of 30)
Team K% vs. RHP — 20.7% (15 of 30)
Pitches Per PA vs. RHP — 3.79 (27 of 30)
Runs Per Game — 4.42 (17 of 30)
Projected Run Total — 4.02 (19 of 22)
Projected Lineup
| # | Player | Bats | wOBA vs. RHP | ISO vs. RHP | HC% vs. RHP | wOBA L14 | FD Position | FD Salary | DK Position | DK Salary |
|---|---|---|---|---|---|---|---|---|---|---|
| 1 | Jose Peraza | RIGHT | 0.329 | 0.069 | 21.0% | 0.321 | SS | $3,000 | OF/SS | $3,500 |
| 2 | Eugenio Suarez | RIGHT | 0.302 | 0.147 | 34.8% | 0.318 | 3B | $3,000 | 3B | $3,100 |
| 3 | Joey Votto | LEFT | 0.413 | 0.237 | 42.6% | 0.362 | 1B | $3,900 | 1B | $4,900 |
| 4 | Adam Duvall | RIGHT | 0.341 | 0.276 | 38.9% | 0.286 | OF | $2,900 | OF | $3,900 |
| 5 | Brandon Phillips | RIGHT | 0.327 | 0.125 | 28.7% | 0.369 | 2B | $3,200 | 2B | $3,400 |
| 6 | Scott Schebler | LEFT | 0.321 | 0.168 | 35.0% | 0.362 | OF | $3,000 | OF | $3,300 |
| 7 | Ivan De Jesus | RIGHT | 0.263 | 0.064 | 24.8% | 0.227 | SS | $2,100 | 3B/SS | $2,500 |
| 8 | Tucker Barnhart | SWITCH | 0.319 | 0.139 | 31.7% | 0.229 | C | $2,200 | C | $2,700 |
| 9 | Tim Adleman | RIGHT | 0.124 | 0.100 | 0.0% | 0.530 | P | $5,800 | P | $5,400 |
| Team Averages | — | 0.304 | 0.147 | 28.6% | 0.334 | — | — | — | — |
Elite Plays – Joey Votto
Secondary Plays – Jose Peraza, Adam Duvall, Scott Schebler
Stackability – YELLOW
Chicago Cubs
The Cubs come into the game with the third highest implied team total in the slate. All signs point to a Cubs’ stack in all formats, as they draw a favorable matchup against Tim Adleman at home. Adleman is a fly-ball pitcher that has allowed a 33.8% hard contact rate. Hitters from both sides of the plate are in play here, but give a slight edge to the left-handed batters.
- Cubs Offense (2016)
Team wOBA vs. RHP — 0.326 (8 of 30)
Team wOBA L30 Days — 0.315 (19 of 30)
Team ISO vs. RHP — 0.168 (13 of 30)
Team K% vs. RHP — 21.9% (23 of 30)
Pitches Per PA vs. RHP — 3.98 (3 of 30)
Runs Per Game — ( of 30)
Projected Run Total — 5.48 (3 of 22)
Projected Lineup
| # | Player | Bats | wOBA vs. RHP | ISO vs. RHP | HC% vs. RHP | wOBA L14 | FD Position | FD Salary | DK Position | DK Salary |
|---|---|---|---|---|---|---|---|---|---|---|
| 1 | Dexter Fowler | SWITCH | 0.353 | 0.162 | 27.7% | 0.356 | OF | $4,000 | OF | $4,700 |
| 2 | Kris Bryant | RIGHT | 0.392 | 0.254 | 41.7% | 0.267 | 3B | $4,000 | 3B/OF | $4,800 |
| 3 | Anthony Rizzo | LEFT | 0.410 | 0.284 | 39.5% | 0.414 | 1B | $4,200 | 1B | $5,400 |
| 4 | Ben Zobrist | SWITCH | 0.348 | 0.166 | 32.9% | 0.314 | 2B | $3,200 | 2B | $4,300 |
| 5 | Addison Russell | RIGHT | 0.313 | 0.157 | 29.5% | 0.332 | SS | $2,500 | SS | $3,900 |
| 6 | Jason Heyward | LEFT | 0.278 | 0.093 | 26.5% | 0.229 | OF | $3,000 | OF | $3,100 |
| 7 | Willson Contreras | RIGHT | 0.329 | 0.181 | 33.6% | 0.217 | C | $2,800 | C/OF | $3,700 |
| 8 | Javier Baez | RIGHT | 0.292 | 0.147 | 27.9% | 0.241 | SS | $2,900 | 2B/3B | $3,500 |
| 9 | Jason Hammel | RIGHT | 0.233 | 0.063 | 18.8% | 0.219 | P | $8,400 | P | $7,700 |
| Team Averages | — | 0.328 | 0.167 | 30.9% | 0.288 | — | — | — | — |