MLB Grind Down: Friday, April 7th

Jump to Page 1 2 3
The RotoGrinders MLB Grind Down will give you an in-depth analysis into the upcoming MLB schedule. This article will break down the numbers for every single game and give you analysis on which trends you can exploit. While matchups are a major factor in daily fantasy baseball, there are plenty of other factors to consider such as injuries, weather, and salaries.
The analysis should point you in the right direction, but it is still up to you to decipher the information and make your own selections. No sport has more variance than baseball. The best choice is not always the right choice but following the trends will win you money over time.
Note: As always, if you want to try a new DFS site, be sure to click through a RotoGrinders link and use our DraftKings promo code and FanDuel promo code to receive the best perks in the industry.
Stackability Rating System:
GREEN – A viable full stack in cash games and GPPs.
YELLOW – A viable mini-stack in cash games and full stack in GPPs.
ORANGE – A viable stack in large field GPPs.
RED – Not a recommended stack for cash games or GPPs.
Atlanta at Pittsburgh – 1:05 PM ET
| Atlanta | Pittsburgh | ||||||||
 | Mike Foltynewicz |  | Ivan Nova | ||||||
| RIGHT | RIGHT | ||||||||
| Vegas Moneyline | Vegas Over/Under | ||||||||
| PIT-147 | 7.5 | ||||||||
| Stats | wOBA | HC% | BB% | K% | Stats | wOBA | HC% | BB% | K% |
|---|---|---|---|---|---|---|---|---|---|
| SP vs. Left (2016) | 0.329 | 33.5% | 8.7% | 21.5% | SP vs. Left (2016) | 0.362 | 37.5% | 3.7% | 13.6% |
| SP vs. Right (2016) | 0.322 | 26.7% | 5.0% | 20.9% | SP vs. Right (2016) | 0.306 | 31.8% | 4.4% | 22.4% |
Pitcher Grind Down
| Mike Foltynewicz | |||||||||
 | FanDuel | DraftKings | FantasyDraft | ||||||
| Salary: | $6,900 | Salary: | $7,600 | Salary: | |||||
| Salary Rank: | 11 of 30 | Salary Rank: | 8 of 30 | Salary Rank: | of 30 | ||||
| Stats | Starts | SIERA | ERA | K% | BB% | GB% | FB% | HC% | |
|---|---|---|---|---|---|---|---|---|---|
| 2016-17 | 22 | 4.13 | 4.31 | 21.1% | 6.7% | 41.2% | 37.4% | 29.8% | |
First off, happy Friday everyone. We made it! We are awarded with a 15-game slate on tap Friday – five early games and ten late games. FanDuel and DraftKings both offer early-only, all-day, and main slates, so we will cover every game on the schedule.
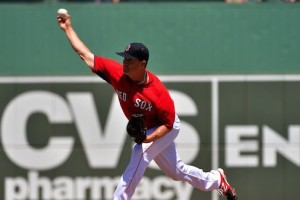
Foltynewicz has one of the coolest last names in all of baseball. If I could change my actual name to anything, I would be Notorious Foltynewicz. Anyway, the real Foltynewicz will be on the mound today against the Pirates. He is a right-handed pitcher that can throw some heat (95+ MPH), but he hasn’t been able to turn that into an elite strikeout rate at the major league level. While his “stuff” gives him upside, he is pitching on the road against a Pirates’ offense that doesn’t strikeout all that often.
Analysis: Deep Tournament Play
| Ivan Nova | |||||||||
 | FanDuel | DraftKings | FantasyDraft | ||||||
| Salary: | $6,900 | Salary: | $7,000 | Salary: | |||||
| Salary Rank: | 11 of 30 | Salary Rank: | 13 of 30 | Salary Rank: | of 30 | ||||
| Stats | Starts | SIERA | ERA | K% | BB% | GB% | FB% | HC% | |
|---|---|---|---|---|---|---|---|---|---|
| 2016-17 | 26 | 3.76 | 4.17 | 18.6% | 4.1% | 53.6% | 27.7% | 34.4% | |
Nova pitched well in the second half of 2016 and benefitted from a trade to the National League. He isn’t a high strikeout pitcher, but he plays in a pitcher-friendly park and has a very good defense behind him. When Nova is at his best, he is inducing a lot of ground balls and limiting base runners with a low walk rate. There is one pitcher that stands out above the rest in the early-only slate, but Nova is a viable SP2 on multi-pitcher sites. The Braves may not strikeout all that often, but they are a bottom five offense in the National League.
Batter Grind Down
Atlanta
Even though Ivan Nova has an above-average ground ball rate, he doesn’t strike many batters out and he gives up a lot of hard contact to left-handed hitters. In 2016, he allowed a .362 wOBA, a 37.5% hard contact rate, and a measly 13.5% strikeout rate against lefties. The Braves don’t have many left-handed batters in their lineup, but Freddie Freeman and his 42.8% hard contact rate against righties stands out as an elite play.
Projected Lineup (Splits vs. RH Pitching)
| # | Player | Bats | wOBA | ISO | HC% | BB% | K% | FD Pos. | FD Salary | DK Pos. | DK Salary | FDFT Salary |
|---|---|---|---|---|---|---|---|---|---|---|---|---|
| 1 | Ender Inciarte | LEFT | 0.310 | 0.097 | 25.7% | 8.5% | 13.3% | OF | $2,800 | OF | $3,700 | |
| 2 | Dansby Swanson | RIGHT | 0.312 | 0.099 | 33.3% | 8.1% | 23.0% | SS | $2,600 | SS | $3,200 | |
| 3 | Freddie Freeman | LEFT | 0.411 | 0.292 | 42.8% | 14.3% | 22.5% | 1B | $3,500 | 1B | $4,500 | |
| 4 | Matt Kemp | RIGHT | 0.324 | 0.215 | 36.8% | 5.4% | 24.1% | OF | $3,400 | OF | $4,000 | |
| 5 | Nick Markakis | LEFT | 0.339 | 0.157 | 33.1% | 11.6% | 16.1% | OF | $2,900 | OF | $3,500 | |
| 6 | Brandon Phillips | RIGHT | 0.326 | 0.126 | 27.7% | 3.3% | 11.6% | 2B | $2,600 | 2B | $3,400 | |
| 7 | Adonis Garcia | RIGHT | 0.299 | 0.145 | 29.5% | 3.3% | 16.9% | 3B | $2,500 | 3B/OF | $3,300 | |
| 8 | Kurt Suzuki | RIGHT | 0.298 | 0.129 | 31.0% | 5.3% | 11.1% | C | $2,200 | C | $2,400 | |
| 9 | Mike Foltynewicz | RIGHT | 0.138 | 0.031 | 22.2% | 2.8% | 47.2% | P | $6,900 | P | $7,600 |
Elite Plays – Freddie Freeman
Secondary Plays – Ender Inciarte
Stackability – ORANGE
Pittsburgh
When analyzing each game, we have to look at the slate as a whole. It’s not that the Pirates are in a bad matchup today, but there is a game in Coors Field. For every batter that you like in this game, I can pull the one-up card and show you a better one in Coors. Mike Foltynewicz struggles with left-handed hitters, as he allowed a .329 wOBA and a 33.5% hard contact rate to lefties. Adam Frazier and Gregory Polanco are fine plays, but don’t stand out as elite bats in comparison to the other options in the slate.
Projected Lineup (Splits vs. RH Pitching)
| # | Player | Bats | wOBA | ISO | HC% | BB% | K% | FD Pos. | FD Salary | DK Pos. | DK Salary | FDFT Salary |
|---|---|---|---|---|---|---|---|---|---|---|---|---|
| 1 | Adam Frazier | LEFT | 0.329 | 0.126 | 32.7% | 8.5% | 16.3% | SS | $2,100 | 2B/OF | $3,000 | |
| 2 | Starling Marte | RIGHT | 0.354 | 0.153 | 35.1% | 4.3% | 17.3% | OF | $3,700 | OF | $4,500 | |
| 3 | Andrew McCutchen | RIGHT | 0.328 | 0.170 | 36.1% | 9.5% | 21.8% | OF | $3,300 | OF | $4,300 | |
| 4 | Gregory Polanco | LEFT | 0.330 | 0.198 | 36.4% | 8.9% | 18.2% | OF | $2,900 | OF | $4,200 | |
| 5 | David Freese | RIGHT | 0.314 | 0.123 | 33.2% | 8.1% | 28.8% | 3B | $2,500 | 1B/3B | $3,000 | |
| 6 | Francisco Cervelli | RIGHT | 0.306 | 0.068 | 24.2% | 14.2% | 19.3% | C | $2,200 | C | $3,000 | |
| 7 | Josh Bell | SWITCH | 0.353 | 0.158 | 34.3% | 13.4% | 12.7% | 1B | $2,400 | OF | $3,100 | |
| 8 | Jordy Mercer | RIGHT | 0.288 | 0.102 | 24.9% | 7.4% | 14.9% | SS | $2,100 | SS | $3,000 | |
| 9 | Ivan Nova | RIGHT | 0.120 | 0.000 | 0.0% | 0.0% | 70.8% | P | $6,900 | P | $7,000 |
Elite Plays – None
Secondary Plays – Adam Frazier, Gregory Polanco
Stackability – ORANGE
Boston at Detroit – 1:10 PM ET
| Boston | Detroit | ||||||||
 | Steven Wright |  | Michael Fulmer | ||||||
| RIGHT | RIGHT | ||||||||
| Vegas Moneyline | Vegas Over/Under | ||||||||
| DET-118 | 8.0 | ||||||||
| Stats | wOBA | HC% | BB% | K% | Stats | wOBA | HC% | BB% | K% |
|---|---|---|---|---|---|---|---|---|---|
| SP vs. Left (2016) | 0.271 | 21.5% | 8.3% | 18.1% | SP vs. Left (2016) | 0.276 | 30.6% | 7.7% | 17.8% |
| SP vs. Right (2016) | 0.303 | 32.6% | 9.0% | 20.3% | SP vs. Right (2016) | 0.295 | 30.1% | 5.2% | 23.3% |
Pitcher Grind Down
| Steven Wright | |||||||||
 | FanDuel | DraftKings | FantasyDraft | ||||||
| Salary: | $8,600 | Salary: | $8,100 | Salary: | |||||
| Salary Rank: | 2 of 30 | Salary Rank: | 6 of 30 | Salary Rank: | of 30 | ||||
| Stats | Starts | SIERA | ERA | K% | BB% | GB% | FB% | HC% | |
|---|---|---|---|---|---|---|---|---|---|
| 2016-17 | 24 | 4.55 | 3.33 | 19.4% | 8.7% | 43.7% | 36.9% | 27.8% | |
Wright is a knuckleballer, which means you never quite know what to expect start to start. He can look great at times and he can lose his command and give up a lot of runs rather quickly. He finished the 2016 season with a 3.33 ERA, but we can expect some regression this year. There will be opportunities to target him, but this matchup doesn’t suit him. He has serious reverse-splits las season and and the Tigers have a right-handed heavy lineup.
| Michael Fulmer | |||||||||
 | FanDuel | DraftKings | FantasyDraft | ||||||
| Salary: | $8,400 | Salary: | $8,400 | Salary: | |||||
| Salary Rank: | 3 of 30 | Salary Rank: | 4 of 30 | Salary Rank: | of 30 | ||||
| Stats | Starts | SIERA | ERA | K% | BB% | GB% | FB% | HC% | |
|---|---|---|---|---|---|---|---|---|---|
| 2016-17 | 26 | 4.03 | 3.06 | 20.4% | 6.5% | 49.1% | 31.5% | 30.4% | |
Fulmer had a tremendous rookie season, but tailed off in the last couple of months. He pitched so well that he ended up winning the AL Rookie of the Year. We can expect some regression in terms of his ERA, but he has a league-average strikeout rate and he induces a high ground ball rate (49%). The Red Sox are not the same offense away from Fenway Park, but are still not a team that I like to pick on with pitching. They drive up pitch counts and can score runs in bunches.
Batter Grind Down
Boston
The Red Sox are slight underdogs today against Michael Fulmer, whose statistics are not all that exploitable. He limits hard contact to both left and right-handed hitters, he induces a high ground ball rate, and he doesn’t walk many batters. Andrew Benintendi, Mookie Betts, and Jackie Bradley Jr. are all viable tournament plays, but this isn’t a spot to stack the Red Sox.
Projected Lineup (Splits vs. RH Pitching)
| # | Player | Bats | wOBA | ISO | HC% | BB% | K% | FD Pos. | FD Salary | DK Pos. | DK Salary | FDFT Salary |
|---|---|---|---|---|---|---|---|---|---|---|---|---|
| 1 | Dustin Pedroia | RIGHT | 0.356 | 0.134 | 33.3% | 7.6% | 10.0% | 2B | $3,000 | 2B | $3,600 | |
| 2 | Andrew Benintendi | LEFT | 0.417 | 0.262 | 34.3% | 7.6% | 15.2% | OF | $3,200 | OF | $3,400 | |
| 3 | Mookie Betts | RIGHT | 0.389 | 0.207 | 33.1% | 7.1% | 11.1% | OF | $4,800 | OF | $4,800 | |
| 4 | Hanley Ramirez | RIGHT | 0.341 | 0.182 | 37.0% | 9.5% | 19.6% | 1B | $3,400 | 1B/OF | $4,000 | |
| 5 | Mitch Moreland | LEFT | 0.293 | 0.182 | 36.7% | 7.3% | 23.4% | 1B | $2,600 | 1B | $2,800 | |
| 6 | Jackie Bradley Jr. | LEFT | 0.379 | 0.263 | 39.5% | 10.8% | 21.3% | OF | $3,600 | OF | $3,700 | |
| 7 | Chris Young | RIGHT | 0.333 | 0.198 | 39.8% | 9.5% | 22.4% | OF | $2,400 | OF | $2,700 | |
| 8 | Pablo Sandoval | SWITCH | 0.112 | 0.000 | 33.3% | 7.1% | 50.0% | 3B | $2,500 | 3B | $3,200 | |
| 9 | Sandy Leon | SWITCH | 0.331 | 0.142 | 35.3% | 6.3% | 26.1% | C | $2,500 | C | $2,600 |
Elite Plays – None
Secondary Plays – Andrew Benintendi, Mookie Betts, Jackie Bradley Jr.
Stackability – ORANGE
Detroit
We shouldn’t have a ton of exposure to this game as a whole, but I prefer the Tigers’ offense over the Red Sox offense. They are playing at home and Steven Wright gives up a 32.6% hard contact rate to right-handed hitters. I don’t rely on BvP often (especially with small samples), but like to look at it when a knuckleballer is involved. Miguel Cabrera, Nick Castellanos, and Victor Martinez all have hits and RBIs against Wright in limited at-bats. Castellanos looks locked in right now and makes an excellent tournament play.
Projected Lineup (Splits vs. RH Pitching)
| # | Player | Bats | wOBA | ISO | HC% | BB% | K% | FD Pos. | FD Salary | DK Pos. | DK Salary | FDFT Salary |
|---|---|---|---|---|---|---|---|---|---|---|---|---|
| 1 | Ian Kinsler | RIGHT | 0.350 | 0.190 | 33.8% | 6.2% | 16.5% | 2B | $3,400 | 2B | $4,200 | |
| 2 | Nick Castellanos | RIGHT | 0.378 | 0.213 | 35.6% | 7.1% | 23.7% | 3B | $3,100 | 3B | $3,600 | |
| 3 | Miguel Cabrera | RIGHT | 0.403 | 0.257 | 40.8% | 9.9% | 16.2% | 1B | $4,000 | 1B | $4,700 | |
| 4 | Victor Martinez | SWITCH | 0.349 | 0.195 | 40.1% | 8.0% | 14.7% | C | $2,900 | 1B | $3,500 | |
| 5 | Justin Upton | RIGHT | 0.332 | 0.225 | 38.3% | 7.6% | 28.2% | OF | $3,100 | OF | $4,000 | |
| 6 | Tyler Collins | LEFT | 0.332 | 0.182 | 30.0% | 8.2% | 25.4% | OF | $2,000 | OF | $2,600 | |
| 7 | James McCann | RIGHT | 0.226 | 0.067 | 27.5% | 4.6% | 28.2% | C | $2,200 | C | $2,700 | |
| 8 | JaCoby Jones | RIGHT | 0.326 | 0.154 | 25.0% | 0.0% | 7.7% | OF | $2,300 | 3B/SS | $2,700 | |
| 9 | Jose Iglesias | RIGHT | 0.273 | 0.057 | 13.6% | 5.2% | 10.7% | SS | $2,100 | 3B/SS | $2,500 |
Elite Plays – Miguel Cabrera, Nick Castellanos (GPP)
Secondary Plays – Nick Castellanos, Victor Martinez, Tyler Collins
Stackability – YELLOW
Washington at Philadelphia – 3:05 PM ET
| Washington | Philadelphia | ||||||||
 | Max Scherzer |  | Vince Velasquez | ||||||
| RIGHT | RIGHT | ||||||||
| Vegas Moneyline | Vegas Over/Under | ||||||||
| WAS-149 | 7.0 | ||||||||
| Stats | wOBA | HC% | BB% | K% | Stats | wOBA | HC% | BB% | K% |
|---|---|---|---|---|---|---|---|---|---|
| SP vs. Left (2016) | 0.323 | 31.0% | 9.1% | 25.5% | SP vs. Left (2016) | 0.333 | 33.3% | 9.3% | 26.9% |
| SP vs. Right (2016) | 0.206 | 29.0% | 3.2% | 37.8% | SP vs. Right (2016) | 0.322 | 31.8% | 7.0% | 28.3% |
Pitcher Grind Down
| Max Scherzer | |||||||||
 | FanDuel | DraftKings | FantasyDraft | ||||||
| Salary: | $10,300 | Salary: | $13,000 | Salary: | |||||
| Salary Rank: | 1 of 30 | Salary Rank: | 1 of 30 | Salary Rank: | of 30 | ||||
| Stats | Starts | SIERA | ERA | K% | BB% | GB% | FB% | HC% | |
|---|---|---|---|---|---|---|---|---|---|
| 2016-17 | 34 | 3.05 | 2.96 | 31.5% | 6.2% | 33.0% | 47.9% | 30.1% | |
If you are playing cash games in the early slate, it’s hard to justify a fade of Scherzer. He is clearly the top pitching option in the slate and his price isn’t all that expensive on FanDuel ($10,300). Scherzer is coming off of a Cy Young Award season in 2016 where he posted a 3.05 SIERA with a strikeout rate of 31.5% and a walk rate of 6.2%. He also struck out Tim Tebow in a game last month (sorry, Cam). The only knock on Scherzer is that he gives up a lot of home runs, but there are very few baserunners on when he does and single-run shots don’t hurt that bad. He should make quick work of a Phillies’ offense that struggles against right-handed pitching.
| Vince Velasquez | |||||||||
 | FanDuel | DraftKings | FantasyDraft | ||||||
| Salary: | $8,000 | Salary: | $8,900 | Salary: | |||||
| Salary Rank: | 4 of 30 | Salary Rank: | 2 of 30 | Salary Rank: | of 30 | ||||
| Stats | Starts | SIERA | ERA | K% | BB% | GB% | FB% | HC% | |
|---|---|---|---|---|---|---|---|---|---|
| 2016-17 | 24 | 3.62 | 4.12 | 27.6% | 8.2% | 34.8% | 41.2% | 32.6% | |
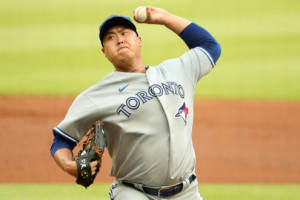
Velasquez may not have Scherzer-type of numbers, but he is mighty impressive in his own right. He finished the 2016 season with a 27.6% strikeout rate, which is huge for his fantasy appeal. Strikeouts make up nearly two-thirds of fantasy production for a pitcher over the course of a season. If you want to fade Max Scherzer in tournaments, Velasquez is an excellent leverage play. It’s not likely, but if Max struggles, you will move ahead of all Scherzer owners in tournaments and potentially capitalize on Velasquez at low ownership. You could even consider playing both Scherzer and Velasquez on DraftKings, but doing so would make it hard to afford hitters from Coors.
Batter Grind Down
Washington
Vince Velasquez has a high strikeout rate, but he is a fly-ball pitcher that gives up a lot of hard contact. In these situations, the masses tend to fade the offense as a whole, but I like to look for low strikeout hitters that could capitalize on the hard contact allowed. Bryce Harper and Daniel Murphy both have a strikeout rate under 16% and a hard contact rate over 35% against right-handed pitching. Trea Turner and Adam Eaton are fine plays, but I will be looking elsewhere at their respective positions.
Projected Lineup (Splits vs. RH Pitching)
| # | Player | Bats | wOBA | ISO | HC% | BB% | K% | FD Pos. | FD Salary | DK Pos. | DK Salary | FDFT Salary |
|---|---|---|---|---|---|---|---|---|---|---|---|---|
| 1 | Trea Turner | RIGHT | 0.405 | 0.254 | 34.0% | 4.5% | 18.0% | SS | $3,700 | OF/SS | $4,700 | |
| 2 | Adam Eaton | LEFT | 0.353 | 0.169 | 32.3% | 9.0% | 16.8% | OF | $3,600 | OF | $4,000 | |
| 3 | Bryce Harper | LEFT | 0.356 | 0.199 | 35.3% | 18.6% | 15.3% | OF | $4,800 | OF | $4,800 | |
| 4 | Daniel Murphy | LEFT | 0.420 | 0.255 | 40.5% | 6.2% | 9.6% | 2B | $3,600 | 2B/3B | $4,400 | |
| 5 | Ryan Zimmerman | RIGHT | 0.279 | 0.146 | 33.5% | 5.1% | 24.5% | 1B | $2,600 | 1B/3B | $3,300 | |
| 6 | Anthony Rendon | RIGHT | 0.337 | 0.187 | 36.6% | 8.2% | 18.9% | 3B | $3,100 | 2B/3B | $3,800 | |
| 7 | Jayson Werth | RIGHT | 0.294 | 0.133 | 32.1% | 11.2% | 24.3% | OF | $2,800 | OF | $3,500 | |
| 8 | Matt Wieters | SWITCH | 0.321 | 0.182 | 32.7% | 6.2% | 17.5% | C | $2,900 | C | $3,100 | |
| 9 | Max Scherzer | RIGHT | 0.190 | 0.017 | 23.9% | 2.8% | 33.3% | P | $10,300 | P | $13,000 |
Elite Plays – Daniel Murphy, Bryce Harper
Secondary Plays – Trea Turner, Adam Eaton
Stackability – ORANGE
Philadelphia
Could Max Scherzer give up a solo home run or two today? Sure, but we shouldn’t be betting against him. Not today and not anytime in the near future. Thanks, but no thanks. (PS – there is a game in Coors Field today).
Projected Lineup (Splits vs. RH Pitching)
| # | Player | Bats | wOBA | ISO | HC% | BB% | K% | FD Pos. | FD Salary | DK Pos. | DK Salary | FDFT Salary |
|---|---|---|---|---|---|---|---|---|---|---|---|---|
| 1 | Cesar Hernandez | SWITCH | 0.333 | 0.118 | 27.0% | 11.3% | 18.2% | 2B | $2,500 | 2B | $3,100 | |
| 2 | Howie Kendrick | RIGHT | 0.316 | 0.136 | 35.5% | 7.8% | 16.9% | OF | $2,500 | 2B/OF | $3,100 | |
| 3 | Odubel Herrera | LEFT | 0.362 | 0.165 | 29.9% | 9.6% | 19.2% | OF | $3,400 | 2B/OF | $3,600 | |
| 4 | Maikel Franco | RIGHT | 0.298 | 0.152 | 29.6% | 6.6% | 16.8% | 3B | $2,900 | 3B | $3,800 | |
| 5 | Michael Saunders | LEFT | 0.335 | 0.205 | 38.6% | 11.2% | 27.8% | OF | $2,600 | OF | $3,300 | |
| 6 | Tommy Joseph | RIGHT | 0.320 | 0.230 | 37.3% | 4.8% | 23.1% | 1B | $2,000 | 1B | $3,400 | |
| 7 | Cameron Rupp | RIGHT | 0.300 | 0.169 | 33.2% | 5.7% | 27.0% | C | $2,400 | C | $2,900 | |
| 8 | Freddy Galvis | SWITCH | 0.305 | 0.182 | 27.5% | 4.8% | 23.1% | SS | $2,700 | 3B/SS | $3,100 | |
| 9 | Vince Velasquez | RIGHT | 0.159 | 0.000 | 9.1% | 2.9% | 34.3% | P | $8,000 | P | $8,900 |
Elite Plays – None
Secondary Plays – None
Stackability – RED
LA Dodgers at Colorado – 4:10 PM ET
| LA Dodgers | Colorado | ||||||||
 | Hyun-Jin Ryu |  | Kyle Freeland | ||||||
| LEFT | LEFT | ||||||||
| Vegas Moneyline | Vegas Over/Under | ||||||||
| LAD-129 | 11.5 | ||||||||
| Stats | wOBA | HC% | BB% | K% | Stats | wOBA | HC% | BB% | K% |
|---|---|---|---|---|---|---|---|---|---|
| SP vs. Left (2016) | 0.314 | 50.0% | 0.0% | 20.0% | SP vs. Left (2016) | ||||
| SP vs. Right (2016) | 0.504 | 42.9% | 10.5% | 15.8% | SP vs. Right (2016) | ||||
Pitcher Grind Down
| Hyun-Jin Ryu | |||||||||
 | FanDuel | DraftKings | FantasyDraft | ||||||
| Salary: | $6,200 | Salary: | $5,700 | Salary: | |||||
| Salary Rank: | 17 of 30 | Salary Rank: | 24 of 30 | Salary Rank: | of 30 | ||||
| Stats | Starts | SIERA | ERA | K% | BB% | GB% | FB% | HC% | |
|---|---|---|---|---|---|---|---|---|---|
| 2016-17 | 1 | 4.81 | 11.57 | 16.7% | 8.3% | 41.2% | 35.3% | 44.4% | |
This is the first Coors Field slate of the season. If you are new to baseball, you will quickly get familiar with Coors. The altitude makes the ball fly in Colorado (more home runs) and Coors has one of the largest outfields in baseball (more doubles and triples). The altitude also hurts the spin on the ball, which makes it tough for pitchers to throw their breaking stuff. Basically, don’t target pitchers in Coors. There will be a few games a year where we see great pitching performances here, but you shouldn’t try to chase them. It is a losing proposition.
| Kyle Freeland | |||||||||
 | FanDuel | DraftKings | FantasyDraft | ||||||
| Salary: | $5,500 | Salary: | $4,000 | Salary: | |||||
| Salary Rank: | 25 of 30 | Salary Rank: | 30 of 30 | Salary Rank: | of 30 | ||||
| Stats | Starts | SIERA | ERA | K% | BB% | GB% | FB% | HC% | |
|---|---|---|---|---|---|---|---|---|---|
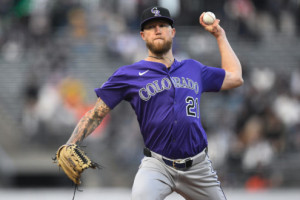
I could just copy and past the paragraph from above, but I wanted to talk about Freeland for a minute. He is one of the Rockies’ top prospects. He was the eighth overall pick in the 2014 draft. He has a good fastball and a nice slider. He looked good this spring and has been rocketed up draft boards in season long leagues. I won’t be targeting him in his major league debut, but I will be paying close attention.
Batter Grind Down
LA Dodgers
Stacking hitters in Coors Field is something that you need to get accustomed to. The run total for this game is set at 11.5, which is a full two runs higher than any other game in the slate. I’ve already outlined why hitters have so much success here. The Dodgers square off against Kyle Freeland, who is a rookie left-handed pitcher that is making his first major league start. All of the right-handed hitters are in play here, as are the left-handed batters with low strikeout rates.
Projected Lineup (Splits vs. LH Pitching)
| # | Player | Bats | wOBA | ISO | HC% | BB% | K% | FD Pos. | FD Salary | DK Pos. | DK Salary | FDFT Salary |
|---|---|---|---|---|---|---|---|---|---|---|---|---|
| 1 | Logan Forsythe | RIGHT | 0.344 | 0.188 | 39.6% | 7.0% | 21.1% | 2B | $3,600 | 2B | $4,900 | |
| 2 | Corey Seager | LEFT | 0.306 | 0.160 | 40.1% | 6.9% | 24.8% | SS | $4,200 | SS | $5,500 | |
| 3 | Justin Turner | RIGHT | 0.288 | 0.131 | 37.5% | 11.4% | 16.8% | 3B | $4,300 | 3B | $4,900 | |
| 4 | Franklin Gutierrez | RIGHT | 0.375 | 0.226 | 52.3% | 12.2% | 28.1% | OF | $2,600 | OF | $4,600 | |
| 5 | Yasiel Puig | RIGHT | 0.323 | 0.203 | 28.9% | 5.9% | 20.7% | OF | $3,500 | OF | $5,100 | |
| 6 | Adrian Gonzalez | LEFT | 0.267 | 0.064 | 23.8% | 4.9% | 16.2% | 1B | $3,500 | 1B | $5,200 | |
| 7 | Yasmani Grandal | SWITCH | 0.351 | 0.198 | 35.0% | 18.8% | 20.8% | C | $3,400 | C | $4,600 | |
| 8 | Kike Hernandez | RIGHT | 0.293 | 0.169 | 31.5% | 15.1% | 24.0% | OF | $2,900 | 2B/OF | $3,700 | |
| 9 | Hyun-Jin Ryu | LEFT | 0.000 | 0.000 | 0.0% | 0.0% | 0.0% | P | $6,200 | P | $5,700 |
Elite Plays – Logan Forsythe, Corey Seager, Justin Turner, Franklin Gutierrez, Yasiel Puig, Yasmani Grandal
Secondary Plays – Adrian Gonzalez
Stackability – GREEN
Colorado
Hyun-Jin Ryu has only made one start in the last two seasons. He showed a lot of promise, but can’t seem to stay healthy. This probably wouldn’t be his ideal spot to make his second start in three years, but he didn’t have a choice in the matters. Rockies’ hitters from both sides of the plate are in play here, even the lefties. In his career, Ryu has actually given up a higher wOBA to lefties than he has to righties. And again, this is the first slate with Coors Field. You don’t want to start off on the wrong foot with Coors. It can be a wily temptress when you fade it.
Projected Lineup (Splits vs. LH Pitching)
| # | Player | Bats | wOBA | ISO | HC% | BB% | K% | FD Pos. | FD Salary | DK Pos. | DK Salary | FDFT Salary |
|---|---|---|---|---|---|---|---|---|---|---|---|---|
| 1 | Charlie Blackmon | LEFT | 0.364 | 0.119 | 24.7% | 5.6% | 14.7% | OF | $4,700 | OF | $5,300 | |
| 2 | DJ LeMahieu | RIGHT | 0.392 | 0.183 | 36.1% | 12.7% | 13.8% | 2B | $3,500 | 2B/3B | $4,500 | |
| 3 | Carlos Gonzalez | LEFT | 0.327 | 0.219 | 40.0% | 2.2% | 26.6% | OF | $3,900 | OF | $5,000 | |
| 4 | Nolan Arenado | RIGHT | 0.363 | 0.235 | 38.0% | 14.3% | 17.5% | 3B | $4,700 | 3B | $5,400 | |
| 5 | Trevor Story | RIGHT | 0.416 | 0.317 | 59.7% | 12.6% | 33.6% | SS | $4,200 | SS | $5,000 | |
| 6 | Gerardo Parra | LEFT | 0.285 | 0.101 | 23.5% | 2.0% | 18.6% | OF | $3,400 | OF | $4,000 | |
| 7 | Mark Reynolds | RIGHT | 0.293 | 0.090 | 29.6% | 10.9% | 25.4% | 1B | $3,700 | 1B/3B | $4,200 | |
| 8 | Tony Wolters | LEFT | 0.247 | 0.071 | 12.5% | 6.7% | 22.2% | C | $3,100 | C | $3,400 | |
| 9 | Kyle Freeland | LEFT | P | $5,500 | P | $4,000 |
Elite Plays – Charlie Blackmon, DJ LeMahieu, Nolan Arenado, Trevor Story
Secondary Plays – Carlos Gonzalez, Mark Reynolds
Stackability – GREEN
San Francisco at San Diego – 6:40 PM ET
| San Francisco | San Diego | ||||||||
 | Matt Cain |  | Luis Perdomo | ||||||
| RIGHT | RIGHT | ||||||||
| Vegas Moneyline | Vegas Over/Under | ||||||||
| SF -112 | 8.0 | ||||||||
| Stats | wOBA | HC% | BB% | K% | Stats | wOBA | HC% | BB% | K% |
|---|---|---|---|---|---|---|---|---|---|
| SP vs. Left (2016) | 0.386 | 27.1% | 7.1% | 18.9% | SP vs. Left (2016) | 0.366 | 40.3% | 6.2% | 14.1% |
| SP vs. Right (2016) | 0.353 | 34.6% | 8.8% | 17.5% | SP vs. Right (2016) | 0.355 | 28.2% | 7.6% | 17.4% |
Pitcher Grind Down
| Matt Cain | |||||||||
 | FanDuel | DraftKings | FantasyDraft | ||||||
| Salary: | $5,200 | Salary: | $5,500 | Salary: | |||||
| Salary Rank: | 28 of 30 | Salary Rank: | 26 of 30 | Salary Rank: | of 30 | ||||
| Stats | Starts | SIERA | ERA | K% | BB% | GB% | FB% | HC% | |
|---|---|---|---|---|---|---|---|---|---|
| 2016-17 | 17 | 4.67 | 5.64 | 18.1% | 8.1% | 37.3% | 38.8% | 31.4% | |
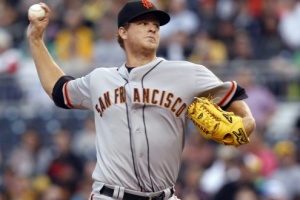
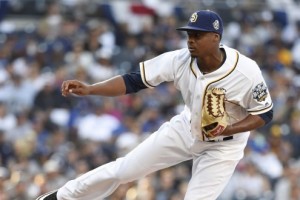
Cain used to be one of the best pitchers in baseball, but that seems like light years ago. Light years means a long time right? I need to brush up on my space lingo. Even though we love targeting pitchers in Petco Park and even though we love targeting pitchers against the Padres, Cain isn’t at the top of my list of pitching targets in this slate. He has a below-average strikeout rate and the Padres actually have some young talent in their lineup.
| Luis Perdomo | |||||||||
 | FanDuel | DraftKings | FantasyDraft | ||||||
| Salary: | $6,400 | Salary: | $5,100 | Salary: | |||||
| Salary Rank: | 16 of 30 | Salary Rank: | 28 of 30 | Salary Rank: | of 30 | ||||
| Stats | Starts | SIERA | ERA | K% | BB% | GB% | FB% | HC% | |
|---|---|---|---|---|---|---|---|---|---|
| 2016 | 20 | 4.04 | 5.71 | 15.9% | 7.0% | 59.0% | 21.3% | 34.0% | |
Perdomo’s peripherals looked a lot better than his ERA did last season, but unless he can improve on his 15.9% strikeout rate, he’s not going to be on our radar anytime soon. He does induce a high ground ball rate, but we like to see that accompanied by a high strikeout rate. I will be taking a wait and see approach on Perdomo. If he shows strikeout potential, he could be viable in DFS moving forward.
Batter Grind Down
San Francisco
The Giants go from one of the best hitter’s parks in the National League (Chase Field) to one of the worst (Petco Park). In addition to the ballpark, they are facing a pitcher with an elite ground ball rate. They are also competing against hitters from Coors Field. Brandon Belt and Hunter Pence are still cheap on FanDuel if you need to save cap space at their respective positions, but I won’t be going overboard on the Giants’ offense.
Projected Lineup (Splits vs. RH Pitching)
| # | Player | Bats | wOBA | ISO | HC% | BB% | K% | FD Pos. | FD Salary | DK Pos. | DK Salary | FDFT Salary |
|---|---|---|---|---|---|---|---|---|---|---|---|---|
| 1 | Denard Span | LEFT | 0.337 | 0.138 | 26.5% | 8.5% | 11.4% | OF | $2,800 | OF | $3,700 | |
| 2 | Brandon Belt | LEFT | 0.376 | 0.205 | 38.8% | 16.8% | 22.5% | 1B | $2,900 | 1B | $3,800 | |
| 3 | Hunter Pence | RIGHT | 0.350 | 0.131 | 28.4% | 9.8% | 21.5% | OF | $2,800 | OF | $4,000 | |
| 4 | Buster Posey | RIGHT | 0.324 | 0.131 | 35.7% | 9.1% | 11.6% | C | $3,800 | 1B/C | $3,900 | |
| 5 | Brandon Crawford | LEFT | 0.337 | 0.185 | 34.7% | 9.8% | 17.1% | SS | $2,700 | SS | $3,500 | |
| 6 | Eduardo Nunez | RIGHT | 0.330 | 0.129 | 27.2% | 4.8% | 15.7% | 3B | $2,800 | 3B/SS | $3,800 | |
| 7 | Jarrett Parker | LEFT | 0.368 | 0.165 | 38.1% | 14.3% | 28.6% | OF | $2,000 | OF | $3,200 | |
| 8 | Joe Panik | LEFT | 0.320 | 0.171 | 27.1% | 10.1% | 6.7% | 2B | $2,700 | 2B | $3,600 | |
| 9 | Matt Cain | RIGHT | 0.000 | 0.000 | 0.0% | 0.0% | 61.5% | P | $5,200 | P | $5,500 |
Elite Plays – None
Secondary Plays – Brandon Belt, Hunter Pence
Stackability – ORANGE
San Diego
Even though the Padres are underdogs, I actually like their offense more than the Giants. Matt Cain is a below-average pitcher at this stage in his career and he gave up a .353+ wOBA to both left and right-handed hitters last season. He also gave up a 34.6% hard contact rate to righties. Wil Myers, Ryan Schimpf, and Hunter Renfroe are all on my radar in tournaments.
Projected Lineup (Splits vs. RH Pitching)
| # | Player | Bats | wOBA | ISO | HC% | BB% | K% | FD Pos. | FD Salary | DK Pos. | DK Salary | FDFT Salary |
|---|---|---|---|---|---|---|---|---|---|---|---|---|
| 1 | Travis Jankowski | LEFT | 0.326 | 0.082 | 27.2% | 12.2% | 25.8% | OF | $2,100 | OF | $3,000 | |
| 2 | Manuel Margot | RIGHT | 0.295 | 0.167 | 26.9% | 0.0% | 13.3% | OF | $2,800 | OF | $3,400 | |
| 3 | Wil Myers | RIGHT | 0.341 | 0.201 | 32.2% | 9.6% | 23.5% | 1B | $3,500 | 1B/OF | $4,600 | |
| 4 | Yangervis Solarte | SWITCH | 0.354 | 0.188 | 33.3% | 6.4% | 13.4% | 3B | $2,600 | 2B/3B | $3,500 | |
| 5 | Ryan Schimpf | LEFT | 0.378 | 0.320 | 38.0% | 13.5% | 29.6% | 2B | $2,900 | 2B/3B | $3,600 | |
| 6 | Hunter Renfroe | RIGHT | 0.445 | 0.355 | 26.9% | 0.0% | 16.1% | OF | $2,200 | OF | $3,300 | |
| 7 | Austin Hedges | RIGHT | 0.067 | 0.000 | 13.3% | 0.0% | 33.3% | C | $2,000 | C | $2,700 | |
| 8 | Erick Aybar | SWITCH | 0.294 | 0.092 | 21.5% | 8.9% | 13.3% | SS | $2,100 | SS | $2,000 | |
| 9 | Luis Perdomo | RIGHT | 0.152 | 0.037 | 5.9% | 3.2% | 38.7% | P | $6,400 | P | $5,100 |