MLB Grind Down: Friday, July 13th

Jump to Page 1 2 3
The RotoGrinders MLB Grind Down will give you an in-depth analysis into the upcoming MLB schedule. This article will break down the numbers for every single game and give you analysis on which trends you can exploit. While matchups are a major factor in daily fantasy baseball, there are plenty of other factors to consider such as injuries, weather, and salaries.
The analysis should point you in the right direction, but it is still up to you to decipher the information and make your own selections. No sport has more variance than baseball. The best choice is not always the right choice but following the trends will win you money over time.
Note: As always, if you want to try a new DFS site, be sure to click through a RotoGrinders link and use our DraftKings promo code, FanDuel promo code, and FantasyDraft promo code to receive the best perks in the industry.

Stackability Rating System:
GREEN – A viable full stack in cash games and GPPs.
YELLOW – A viable mini-stack in cash games and full stack in GPPs.
ORANGE – A viable stack in large field GPPs.
RED – Not a recommended stack for cash games or GPPs.
Implied Run Totals
Ballpark Ratings
Milwaukee at Pittsburgh – 7:05 PM ET
| Milwaukee | Pittsburgh | ||||||||||||||
 | Junior Guerra |  | Nick Kingham | ||||||||||||
| RIGHT | RIGHT | ||||||||||||||
| Vegas Moneyline | Vegas Over/Under | ||||||||||||||
| PIT-101 | 8.0 | ||||||||||||||
| Stats | wOBA | xwOBA | HC% | aEV | K% | GB% | Stats | wOBA | xwOBA | HC% | aEV | K% | GB% | ||
|---|---|---|---|---|---|---|---|---|---|---|---|---|---|---|---|
| SP vs. Left (2016-17) | 0.303 | 0.334 | 41.4% | 89.4 | 25.0% | 37.1% | SP vs. Left (2016-17) | 0.350 | 0.352 | 36.1% | 89.8 | 14.9% | 36.1% | ||
| SP vs. Right (2016-17) | 0.287 | 0.319 | 43.2% | 88.5 | 21.7% | 41.3% | SP vs. Right (2016-17) | 0.266 | 0.314 | 39.3% | 91.2 | 29.5% | 41.7% | ||
Pitcher Grind Down
| Junior Guerra | |||||||||||
 | FanDuel | DraftKings | FantasyDraft | ||||||||
| Salary: | $8,200 | Salary: | $9,200 | Salary: | $17,700 | ||||||
| Salary Rank: | 7 of 30 | Salary Rank: | 5 of 30 | Salary Rank: | 6 of 30 | ||||||
| Stats | Starts | SIERA | ERA | K% | BB% | GB% | HC% | SC% | aFV | SwS% | |
|---|---|---|---|---|---|---|---|---|---|---|---|
| 2017 | 14 | 5.23 | 5.12 | 21.3% | 13.7% | 33.5% | 33.5% | 18.5% | 91.9 | 10.9% | |
| 2018 | 17 | 4.18 | 2.79 | 23.5% | 9.4% | 39.1% | 42.3% | 17.4% | 93.1 | 9.7% | |
| L14 | 3 | 4.17 | 2.65 | 24.0% | 9.3% | 36.0% | 50.0% | 16.0% | 93.1 | 8.3% | |
Per usual Friday tradition, we have 15 games on the schedule tonight. The bigger the slate, the bigger the tournaments we see across the industry and we certainly don’t have a shortage of large GPPs tonight. The first thing I noticed when glancing at the player pool is the lack of elite pitching options. It feels like a good time to load up on the mid-range in order to spend up on hitters. We start with a fairly easy fade in Guerra, who is due for regression in the second half of the season. He’s a fly-ball pitcher that gives up a lot of hard contact (42%) and he doesn’t have the best control (9% walk rate). He’s facing a low-strikeout Pirates’ team on the road in game that is basically set as a pick ‘em.
Quick Breakdown: Avoid Guerra in both cash games and tournaments.
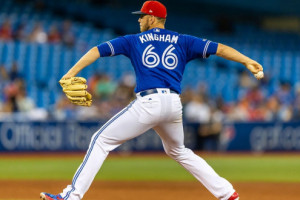
| Nick Kingham | |||||||||||
 | FanDuel | DraftKings | FantasyDraft | ||||||||
| Salary: | $7,700 | Salary: | $7,900 | Salary: | $15,200 | ||||||
| Salary Rank: | 11 of 30 | Salary Rank: | 13 of 30 | Salary Rank: | 15 of 30 | ||||||
| Stats | Starts | SIERA | ERA | K% | BB% | GB% | HC% | SC% | aFV | SwS% | |
|---|---|---|---|---|---|---|---|---|---|---|---|
| 2018 | 8 | 3.92 | 4.26 | 22.2% | 5.8% | 38.6% | 37.6% | 15.0% | 92.4 | 11.9% | |
| L14 | 2 | 4.95 | 6.00 | 15.6% | 8.9% | 46.9% | 39.4% | 12.1% | 92.6 | 12.3% | |
We’ve seen the good and bad Kingham in his two starts since being called up to the majors. He gave up seven runs in only three innings of work against the Dodgers, but bounced back with six strong innings against the Phillies where he struck out five and only gave up one run. Rookie pitchers tend to be more volatile than veterans and we’ve certainly seen that with Kingham this season. While I felt great about Jameson Taillon in this spot last night, I don’t have those same warm and fuzzy feelings for Kingham. It’s not you, it’s me. Well technically, it’s the Brewers, whose projected lineup has a .340 xwOBA and a 42% hard contact rate against right-handed pitching this season.
Quick Breakdown: Pitching is lacking tonight, but Kingham is a deep tournament dart at best.
Batter Grind Down
Milwaukee
The Brewers have an offense that can explode at any time. They are facing a pitcher that has that same quality. The range of outcomes is quite broad here. We are still dealing with a small sample size (eight starts), but Nick Kingham has been a fly-ball pitcher that has struggled against lefties. With a 15% strikeout rate and a .352 xwOBA, we should have some interest in the Brewers’ lefties in tournaments. Eric Thames (.411 xwOBA), Christian Yelich (.394 xwOBA), and Travis Shaw (.400 xwOBA) all bat from the left side and all mash right-handed pitching.
Projected Lineup (Splits vs. RH Pitching)
| # | Player | Bats | xwOBA | aEV | ISO | HC% | BB% | K% | GB% | FD Pos. | FD Sal. | DK Pos. | DK Sal. | FDRFT Pos. | FDRFT Sal. |
|---|---|---|---|---|---|---|---|---|---|---|---|---|---|---|---|
| 1 | Eric Thames | LEFT | 0.411 | 92.6 | 0.328 | 48.8% | 12.1% | 27.0% | 33.3% | OF | $4,000 | 1B/OF | $4,800 | 1B | $9,200 |
| 2 | Lorenzo Cain | RIGHT | 0.329 | 89.1 | 0.112 | 35.3% | 13.4% | 19.4% | 59.3% | OF | $3,600 | OF | $4,300 | CF | $8,500 |
| 3 | Christian Yelich | LEFT | 0.394 | 93.1 | 0.196 | 45.7% | 10.8% | 22.9% | 51.0% | OF | $3,900 | OF | $4,700 | CF | $9,300 |
| 4 | Jesus Aguilar | RIGHT | 0.395 | 90.6 | 0.314 | 46.0% | 7.9% | 27.8% | 31.4% | 1B | $4,100 | 1B | $5,200 | 1B | $9,900 |
| 5 | Travis Shaw | LEFT | 0.400 | 90.2 | 0.276 | 41.8% | 14.2% | 17.6% | 33.9% | 3B | $3,500 | 3B | $4,000 | 3B | $7,200 |
| 6 | Brad Miller | LEFT | 0.351 | 92.1 | 0.191 | 46.6% | 10.7% | 31.5% | 34.0% | SS | $2,400 | 1B/2B | $3,500 | 2B | $6,700 |
| 7 | Tyler Saladino | RIGHT | 0.388 | 87.3 | 0.368 | 44.8% | 4.9% | 24.4% | 32.1% | SS | $2,500 | SS | $2,900 | 3B | $5,900 |
| 8 | Erik Kratz | RIGHT | 0.302 | 92.5 | 0.163 | 56.3% | 2.1% | 23.4% | 40.6% | C | $2,300 | C | $2,600 | C | $4,700 |
| 9 | Junior Guerra | RIGHT | 0.086 | 71.4 | 0.000 | 10.0% | 0.0% | 33.3% | 37.5% | P | $8,200 | P | $9,200 | P | $17,700 |
| Team Averages | 0.340 | 88.8 | 0.216 | 41.7% | 8.5% | 25.3% | 39.2% |
Elite Plays – Eric Thames (GPP), Christian Yelich (GPP), Travis Shaw (GPP)
Secondary Plays – Eric Thames (Cash), Christian Yelich (Cash), Travis Shaw (Cash)
Stackability – YELLOW
Pittsburgh
The Pirates have been a favorite target of mine recently thanks to some suppressed salaries across the industry. Unfortunately, that’s no longer the case, although Colin Moran and Francisco Cervelli seem immune to price hikes. Even though this isn’t the greatest ballpark for hitters, a matchup against Junior Guerra is intriguing. He’s a fly-ball pitcher that gives up a lot of hard contact to both left (41%) and right-handed hitters (43%). The Pirates are a fly-ball hitting offense, which could lead to home runs or a lot of fly outs. They aren’t stack worthy, but Gregory Polanco, Moran, and Cervelli are all viable in this matchup.
Projected Lineup (Splits vs. RH Pitching)
| # | Player | Bats | xwOBA | aEV | ISO | HC% | BB% | K% | GB% | FD Pos. | FD Sal. | DK Pos. | DK Sal. | FDRFT Pos. | FDRFT Sal. |
|---|---|---|---|---|---|---|---|---|---|---|---|---|---|---|---|
| 1 | Corey Dickerson | LEFT | 0.339 | 87.7 | 0.159 | 34.2% | 4.1% | 11.8% | 33.3% | OF | $3,400 | OF | $4,000 | LF | $7,300 |
| 2 | Starling Marte | RIGHT | 0.319 | 86.6 | 0.167 | 29.9% | 6.2% | 20.7% | 47.3% | OF | $3,700 | OF | $5,000 | CF | $9,500 |
| 3 | Gregory Polanco | LEFT | 0.362 | 90.8 | 0.221 | 35.5% | 13.9% | 22.9% | 33.6% | OF | $3,600 | OF | $4,100 | RF | $8,000 |
| 4 | Colin Moran | LEFT | 0.374 | 88.5 | 0.168 | 34.5% | 8.9% | 14.8% | 41.5% | 3B | $2,700 | 3B | $3,200 | 3B | $6,300 |
| 5 | Francisco Cervelli | RIGHT | 0.412 | 89.7 | 0.243 | 38.4% | 13.3% | 19.4% | 33.9% | C | $2,700 | C | $3,400 | C | $6,700 |
| 6 | Josh Bell | SWITCH | 0.327 | 88.4 | 0.129 | 29.7% | 9.9% | 16.8% | 52.1% | 1B | $2,700 | 1B | $3,300 | 1B | $6,700 |
| 7 | Josh Harrison | RIGHT | 0.278 | 82.8 | 0.090 | 29.9% | 3.8% | 15.3% | 38.3% | 2B | $2,700 | 2B | $3,100 | 2B | $5,800 |
| 8 | Jordy Mercer | RIGHT | 0.317 | 88.1 | 0.136 | 26.5% | 7.5% | 23.3% | 41.3% | SS | $2,400 | SS | $2,800 | SS | $5,900 |
| 9 | Nick Kingham | RIGHT | 0.147 | 79.2 | 0.143 | 25.0% | 12.5% | 37.5% | 50.0% | P | $7,700 | P | $7,900 | P | $15,200 |
| Team Averages | 0.319 | 86.9 | 0.162 | 31.5% | 8.9% | 20.3% | 41.3% |
Elite Plays – Colin Moran, Francisco Cervelli (DK)
Secondary Plays – Francisco Cervelli (FD), Gregory Polanco
Stackability – ORANGE / YELLOW
Texas at Baltimore – 7:05 PM ET
| Texas | Baltimore | ||||||||||||||
 | Cole Hamels |  | Alex Cobb | ||||||||||||
| LEFT | RIGHT | ||||||||||||||
| Vegas Moneyline | Vegas Over/Under | ||||||||||||||
| TEX-104 | 9.5 | ||||||||||||||
| Stats | wOBA | xwOBA | HC% | aEV | K% | GB% | Stats | wOBA | xwOBA | HC% | aEV | K% | GB% | ||
|---|---|---|---|---|---|---|---|---|---|---|---|---|---|---|---|
| SP vs. Left (2016-17) | 0.342 | 0.339 | 34.0% | 85.8 | 16.4% | 50.0% | SP vs. Left (2016-17) | 0.385 | 0.364 | 34.8% | 88.4 | 18.3% | 42.4% | ||
| SP vs. Right (2016-17) | 0.347 | 0.363 | 47.0% | 89.7 | 24.7% | 42.3% | SP vs. Right (2016-17) | 0.383 | 0.361 | 33.7% | 90.5 | 12.3% | 56.4% | ||
Pitcher Grind Down
| Cole Hamels | |||||||||||
 | FanDuel | DraftKings | FantasyDraft | ||||||||
| Salary: | $7,300 | Salary: | $9,000 | Salary: | $17,800 | ||||||
| Salary Rank: | 16 of 30 | Salary Rank: | 6 of 30 | Salary Rank: | 5 of 30 | ||||||
| Stats | Starts | SIERA | ERA | K% | BB% | GB% | HC% | SC% | aFV | SwS% | |
|---|---|---|---|---|---|---|---|---|---|---|---|
| 2017 | 24 | 4.90 | 4.20 | 17.1% | 8.6% | 47.5% | 36.0% | 13.7% | 92.0 | 9.7% | |
| 2018 | 18 | 4.01 | 4.28 | 23.5% | 8.7% | 43.5% | 44.9% | 16.2% | 91.2 | 12.3% | |
| L14 | 3 | 3.07 | 11.81 | 24.1% | 5.2% | 53.7% | 41.5% | 14.6% | 91.9 | 17.5% | |
Hamels has been around for a very long time. I still remember targeting him in my very first days of DFS. Ah, those were the glory days. While we didn’t have much in terms of big payouts, the rake was low, there were freerolls galore, and the referral bonuses were to die for. While Hamels has improved his strikeout rate (24%) and swinging strike rate this season (12%), he’s not inducing as many ground balls and his hard contact rate is up to 45%. His struggles have largely come against righties and he will likely face nine of them tonight against the Orioles.
Quick Breakdown: Hamels is a no from me. It’s a tough matchup on the road in a hitter-friendly ballpark.
| Alex Cobb | |||||||||||
 | FanDuel | DraftKings | FantasyDraft | ||||||||
| Salary: | $5,800 | Salary: | $5,000 | Salary: | $9,900 | ||||||
| Salary Rank: | 29 of 30 | Salary Rank: | 28 of 30 | Salary Rank: | 28 of 30 | ||||||
| Stats | Starts | SIERA | ERA | K% | BB% | GB% | HC% | SC% | aFV | SwS% | |
|---|---|---|---|---|---|---|---|---|---|---|---|
| 2017 | 29 | 4.48 | 3.66 | 17.3% | 5.9% | 47.8% | 36.9% | 14.9% | 91.7 | 6.7% | |
| 2018 | 16 | 4.58 | 6.57 | 15.2% | 6.3% | 50.0% | 34.2% | 18.9% | 92.0 | 7.2% | |
| L14 | 3 | 5.21 | 6.61 | 14.1% | 9.0% | 48.2% | 34.5% | 12.1% | 92.3 | 7.7% | |
While I’m not a big fan of Alex Cobb (at least not his skill set), I do love me a good piece of corn on the cob. Although, if you are one of those people that use a knife and cut their corn off the cob, I’m not sure that we can be friends. Back to the Cobb with two Bs, he has a 4.58 SIERA with a strikeout rate of 15%. His ground ball rate is nice, but not enough to overcome a lack of talent. He has one of the lowest swinging strike rates of the slate and should be avoided against the Rangers, whose projected lineup has a .337 xwOBA and a 40% hard contact rate against right-handed pitching.
Quick Breakdown: If you are playing Cobb in a 15-game slate, you probably should head over to RotoAcademy.
Batter Grind Down
Texas
The Rangers go from one hitter’s park in Texas to another in Baltimore. Even though Alex Cobb owns a 56% ground ball rate against right-handed hitters, he hasn’t had much success against batters from either side of the plate. When you have a low strikeout rate and give up a lot of hard contact, it’s not surprising that he has allowed a .360+ xwOBA to both left and right-handed hitters this season. I wouldn’t call any of the Rangers’ hitters priority plays, but Adrian Beltre and Rougned Odor offer nice salary cap relief in the middle of the order, while Shin-Soo Choo and Nomar Mazara provide power from the left side of the plate.
Projected Lineup (Splits vs. RH Pitching)
| # | Player | Bats | xwOBA | aEV | ISO | HC% | BB% | K% | GB% | FD Pos. | FD Sal. | DK Pos. | DK Sal. | FDRFT Pos. | FDRFT Sal. |
|---|---|---|---|---|---|---|---|---|---|---|---|---|---|---|---|
| 1 | Shin-Soo Choo | LEFT | 0.428 | 90.9 | 0.256 | 49.7% | 15.1% | 20.8% | 48.6% | OF | $3,300 | OF | $5,100 | RF | $9,600 |
| 2 | Elvis Andrus | RIGHT | 0.313 | 87.2 | 0.129 | 30.9% | 7.7% | 12.5% | 50.6% | SS | $3,000 | SS | $4,100 | SS | $8,500 |
| 3 | Nomar Mazara | LEFT | 0.372 | 90.9 | 0.173 | 39.4% | 9.7% | 19.0% | 53.7% | OF | $3,100 | OF | $4,300 | RF | $8,000 |
| 4 | Adrian Beltre | RIGHT | 0.339 | 88.9 | 0.130 | 43.6% | 8.6% | 19.4% | 41.9% | 3B | $2,700 | 3B | $3,400 | 3B | $6,600 |
| 5 | Rougned Odor | LEFT | 0.327 | 87.5 | 0.158 | 40.6% | 9.1% | 25.5% | 36.7% | 2B | $3,000 | 2B | $4,500 | 2B | $8,900 |
| 6 | Jurickson Profar | SWITCH | 0.333 | 87.1 | 0.176 | 34.3% | 7.4% | 15.2% | 43.6% | 3B | $3,200 | SS | $4,300 | SS | $8,500 |
| 7 | Joey Gallo | LEFT | 0.387 | 94.5 | 0.245 | 48.8% | 14.1% | 34.3% | 31.2% | OF | $2,800 | 1B/OF | $4,400 | 1B | $8,400 |
| 8 | Robinson Chirinos | RIGHT | 0.289 | 88.5 | 0.206 | 49.4% | 7.9% | 40.0% | 31.8% | C | $2,500 | C | $3,800 | C | $7,400 |
| 9 | Delino DeShields | RIGHT | 0.245 | 79.6 | 0.057 | 25.8% | 10.6% | 24.6% | 47.8% | OF | $2,500 | OF | $3,500 | CF | $6,500 |
| Team Averages | 0.337 | 88.3 | 0.170 | 40.3% | 10.0% | 23.5% | 42.9% |
Elite Plays – Shin-Soo Choo (GPP), Rougned Odor (GPP)
Secondary Plays – Shin-Soo Choo (Cash), Rougned Odor (Cash), Elvis Andrus, Nomar Mazara, Adrian Beltre
Stackability – YELLOW
Baltimore
We don’t have to do a deep dive into the splits of Cole Hamels because the Orioles are likely going to roll out an exclusively right-handed lineup tonight. On the season, Hamels has allowed a .363 xwOBA and a 47% hard contact rate to righties. The issue is that he also has a 25% k-rate against batters from that side of the plate and we know that the Orioles aren’t shy when it comes to striking out. Tim Beckham offers nice salary cap relief batting leadoff, while Manny Machado and Danny Valencia both boast a .220+ ISO against southpaws this season.
Projected Lineup (Splits vs. LH Pitching)
| # | Player | Bats | xwOBA | aEV | ISO | HC% | BB% | K% | GB% | FD Pos. | FD Sal. | DK Pos. | DK Sal. | FDRFT Pos. | FDRFT Sal. |
|---|---|---|---|---|---|---|---|---|---|---|---|---|---|---|---|
| 1 | Tim Beckham | RIGHT | 0.334 | 87.4 | 0.179 | 42.1% | 12.5% | 28.1% | 33.3% | 3B | $2,500 | 3B | $3,300 | SS | $6,700 |
| 2 | Adam Jones | RIGHT | 0.320 | 88.9 | 0.062 | 28.4% | 2.0% | 10.0% | 38.4% | OF | $2,700 | OF | $3,300 | CF | $6,600 |
| 3 | Manny Machado | RIGHT | 0.382 | 91.7 | 0.220 | 34.9% | 7.9% | 6.9% | 37.2% | SS | $4,100 | SS | $5,000 | 3B | $9,700 |
| 4 | Mark Trumbo | RIGHT | 0.336 | 93.9 | 0.140 | 39.0% | 7.9% | 25.4% | 46.3% | OF | $3,200 | 1B/OF | $3,700 | DH | $7,700 |
| 5 | Jonathan Schoop | RIGHT | 0.297 | 86.1 | 0.079 | 24.6% | 8.3% | 13.1% | 45.3% | 2B | $3,300 | 2B | $3,700 | 2B | $7,200 |
| 6 | Danny Valencia | RIGHT | 0.413 | 90.4 | 0.221 | 31.1% | 11.1% | 14.1% | 41.9% | OF | $2,600 | 3B/OF | $3,200 | 3B | $6,400 |
| 7 | Joey Rickard | RIGHT | 0.268 | 82.9 | 0.205 | 22.6% | 6.4% | 27.7% | 29.0% | OF | $2,300 | OF | $3,000 | RF | $5,900 |
| 8 | Trey Mancini | RIGHT | 0.293 | 88.7 | 0.129 | 27.4% | 7.3% | 25.5% | 68.5% | OF | $2,400 | 1B/OF | $3,200 | IF/OF | $6,700 |
| 9 | Caleb Joseph | RIGHT | 0.289 | 85.7 | 0.063 | 18.4% | 2.0% | 20.0% | 39.5% | C | $2,200 | C | $2,500 | C | $5,100 |
| Team Averages | 0.326 | 88.4 | 0.144 | 29.8% | 7.3% | 19.0% | 42.2% |
Elite Plays – Tim Beckham, Manny Machado (GPP), Danny Valencia (GPP)
Secondary Plays – Manny Machado (Cash), Danny Valencia (Cash), Adam Jones
Stackability – YELLOW
NY Yankees at Cleveland – 7:10 PM ET
| NY Yankees | Cleveland | ||||||||||||||
 | Domingo German |  | Shane Bieber | ||||||||||||
| RIGHT | RIGHT | ||||||||||||||
| Vegas Moneyline | Vegas Over/Under | ||||||||||||||
| NYY-113 | 9.5 | ||||||||||||||
| Stats | wOBA | xwOBA | HC% | aEV | K% | GB% | Stats | wOBA | xwOBA | HC% | aEV | K% | GB% | ||
|---|---|---|---|---|---|---|---|---|---|---|---|---|---|---|---|
| SP vs. Left (2016-17) | 0.334 | 0.296 | 36.2% | 86.9 | 21.5% | 37.1% | SP vs. Left (2016-17) | 0.422 | 0.378 | 55.6% | 92.3 | 22.8% | 37.0% | ||
| SP vs. Right (2016-17) | 0.309 | 0.310 | 38.4% | 88.1 | 31.6% | 39.4% | SP vs. Right (2016-17) | 0.267 | 0.261 | 37.9% | 87.7 | 23.4% | 53.4% | ||
Pitcher Grind Down
| Domingo German | |||||||||||
 | FanDuel | DraftKings | FantasyDraft | ||||||||
| Salary: | $7,000 | Salary: | $7,400 | Salary: | $14,700 | ||||||
| Salary Rank: | 19 of 30 | Salary Rank: | 17 of 30 | Salary Rank: | 16 of 30 | ||||||
| Stats | Starts | SIERA | ERA | K% | BB% | GB% | HC% | SC% | aFV | SwS% | |
|---|---|---|---|---|---|---|---|---|---|---|---|
| 2017 | 0 | 3.93 | 3.14 | 29.0% | 14.5% | 54.5% | 28.6% | 25.7% | 96.4 | 11.1% | |
| 2018 | 11 | 3.56 | 5.06 | 26.9% | 8.1% | 38.2% | 37.3% | 17.7% | 94.8 | 15.0% | |
| L14 | 2 | 4.26 | 3.18 | 24.0% | 10.0% | 30.3% | 24.2% | 18.2% | 94.3 | 13.3% | |
German doesn’t get the respect that he deserves, largely thanks to an ERA that’s currently sitting above 5.00 on the season. His advanced numbers suggest some positive regression moving forward — 3.56 SIERA with a 27% strikeout rate. He’s a fly-ball pitcher, but there is a lot to like with his skill set. He has elite fastball velocity and his swinging strike rate (15%) is tied with Noah Syndergaard for the best on the slate. Unfortunately, all of this isn’t enough to overcome a matchup against the Indians. Their projected lineup has a .360 xwOBA, a .197 ISO, and a 40% hard contact rate against right-handed pitching.
Quick Breakdown: I love the skill set, but will wait for a better matchup to target German.
| Shane Bieber | |||||||||||
 | FanDuel | DraftKings | FantasyDraft | ||||||||
| Salary: | $7,900 | Salary: | $8,100 | Salary: | $16,200 | ||||||
| Salary Rank: | 9 of 30 | Salary Rank: | 11 of 30 | Salary Rank: | 11 of 30 | ||||||
| Stats | Starts | SIERA | ERA | K% | BB% | GB% | HC% | SC% | aFV | SwS% | |
|---|---|---|---|---|---|---|---|---|---|---|---|
| 2018 | 6 | 3.48 | 3.47 | 23.1% | 3.9% | 45.5% | 46.4% | 8.9% | 92.3 | 11.5% | |
| L14 | 3 | 4.19 | 4.50 | 17.5% | 3.8% | 41.0% | 47.5% | 8.2% | 91.8 | 11.0% | |
The other day, my wife looked at me and said, “you’ll never guess what happened today.” Ok I’ll bite — what’s up? “Justin Bieber got engaged.” She acted like this would shock me to the core. I cared so little that I didn’t even respond. Maybe tonight send one her way, “you’ll never believe what happened, Shane Bieber gave up four runs in five innings of work against the Yankees.” While Bieber has shown some positives this season, I didn’t target Corey Kluber against the Yankees, so there is no chance that I will roster Bieber against them.
Quick Breakdown: Avoid Bieber in both cash games and tournaments.
Batter Grind Down
NY Yankees
Looking at the PlateIQ tool here on RotoGrinders, Shane Bieber basically has three pitches in his repertoire (not including the changeup since he only throws is 5% of the time). The fastball and slider are his most thrown pitches (78% of the time). Even though he’s been tough on right-handed hitters this season, there are two batters in particular that mash those two pitch types — Aaron Judge and Giancarlo Stanton. Both make excellent tournament plays in the outfield. As far as the usual splits, Bieber has allowed a .378 xwOBA and a 56% hard contact rate to lefties, which brings Brett Gardner, Didi Gregorius, Aaron Hicks, and Greg Bird into play.
Projected Lineup (Splits vs. RH Pitching)
| # | Player | Bats | xwOBA | aEV | ISO | HC% | BB% | K% | GB% | FD Pos. | FD Sal. | DK Pos. | DK Sal. | FDRFT Pos. | FDRFT Sal. |
|---|---|---|---|---|---|---|---|---|---|---|---|---|---|---|---|
| 1 | Brett Gardner | LEFT | 0.308 | 87.1 | 0.152 | 29.9% | 12.4% | 15.3% | 50.3% | OF | $3,100 | OF | $4,800 | LF | $8,900 |
| 2 | Aaron Judge | RIGHT | 0.401 | 96.5 | 0.300 | 49.0% | 14.1% | 30.9% | 46.3% | OF | $4,400 | OF | $5,700 | RF | $10,600 |
| 3 | Didi Gregorius | LEFT | 0.349 | 88.5 | 0.245 | 39.7% | 9.2% | 12.7% | 34.2% | SS | $3,700 | SS | $4,700 | SS | $9,300 |
| 4 | Giancarlo Stanton | RIGHT | 0.300 | 91.3 | 0.183 | 33.8% | 8.3% | 33.9% | 53.9% | OF | $4,300 | OF | $4,700 | RF | $9,400 |
| 5 | Aaron Hicks | SWITCH | 0.361 | 88.9 | 0.217 | 38.4% | 14.1% | 18.6% | 43.5% | OF | $3,500 | OF | $5,000 | CF | $9,500 |
| 6 | Greg Bird | LEFT | 0.318 | 88.8 | 0.227 | 37.1% | 9.1% | 26.3% | 38.7% | 1B | $3,100 | 1B | $4,200 | 1B | $8,400 |
| 7 | Miguel Andujar | RIGHT | 0.352 | 90.2 | 0.202 | 36.6% | 2.8% | 17.2% | 49.4% | 3B | $3,200 | 3B | $4,000 | 3B | $7,600 |
| 8 | Austin Romine | RIGHT | 0.372 | 88.4 | 0.194 | 37.0% | 12.7% | 19.0% | 41.5% | C | $2,100 | C | $3,200 | C | $6,400 |
| 9 | Neil Walker | SWITCH | 0.337 | 88.3 | 0.080 | 35.9% | 10.3% | 21.2% | 41.9% | 2B | $2,300 | 1B/2B | $3,300 | 2B | $6,300 |
| Team Averages | 0.344 | 89.8 | 0.200 | 37.5% | 10.3% | 21.7% | 44.4% |
Elite Plays – Didi Gregorius, Aaron Judge (GPP), Giancarlo Stanton (GPP)
Secondary Plays – Aaron Judge (Cash), Giancarlo Stanton (Cash), Brett Gardner, Aaron Hicks, Greg Bird
Stackability – YELLOW
Cleveland
The Indians are one of the best offenses in baseball. They are loaded with left and right-handed power throughout their lineup and are incredibly tough at home. With that said, a matchup against Domingo German is far from perfect. On the season, he has held both left and right-handed hitters under a .310 xwOBA. Outside of Edwin Encarnacion, Cleveland has actually struggled against the curveball this season, which is German’s most thrown pitch (37% of the time). This isn’t a reason to target German, but it might be enough of a reason to bump the Indians’ hitters down to secondary plays.
Projected Lineup (Splits vs. RH Pitching)
| # | Player | Bats | xwOBA | aEV | ISO | HC% | BB% | K% | GB% | FD Pos. | FD Sal. | DK Pos. | DK Sal. | FDRFT Pos. | FDRFT Sal. |
|---|---|---|---|---|---|---|---|---|---|---|---|---|---|---|---|
| 1 | Francisco Lindor | SWITCH | 0.411 | 89.4 | 0.290 | 41.1% | 9.9% | 19.5% | 35.7% | SS | $4,500 | SS | $5,900 | SS | $11,000 |
| 2 | Michael Brantley | LEFT | 0.412 | 91.2 | 0.207 | 43.1% | 6.8% | 8.8% | 42.1% | OF | $3,800 | OF | $5,200 | LF | $9,800 |
| 3 | Jose Ramirez | SWITCH | 0.424 | 89.5 | 0.342 | 39.1% | 16.8% | 11.5% | 31.2% | 3B | $4,600 | 3B | $5,800 | IF/OF | $10,600 |
| 4 | Edwin Encarnacion | RIGHT | 0.392 | 90.5 | 0.269 | 42.9% | 8.3% | 23.4% | 38.1% | 1B | $3,400 | 1B | $4,300 | 1B | $8,000 |
| 5 | Yonder Alonso | LEFT | 0.382 | 90.5 | 0.180 | 40.9% | 9.7% | 20.7% | 38.0% | 1B | $3,000 | 1B | $4,300 | 1B | $8,600 |
| 6 | Jason Kipnis | LEFT | 0.353 | 87.2 | 0.127 | 37.6% | 9.7% | 19.0% | 36.5% | 2B | $3,300 | 2B | $4,100 | 2B | $8,200 |
| 7 | Tyler Naquin | LEFT | 0.320 | 90.1 | 0.086 | 40.0% | 4.0% | 25.8% | 52.9% | OF | $2,400 | OF | $3,400 | CF | $6,300 |
| 8 | Yan Gomes | RIGHT | 0.278 | 88.0 | 0.160 | 40.2% | 4.6% | 32.2% | 37.4% | C | $2,500 | C | $3,700 | C | $7,700 |
| 9 | Greg Allen | SWITCH | 0.266 | 86.0 | 0.116 | 38.0% | 5.8% | 24.3% | 42.6% | OF | $2,200 | OF | $3,200 | CF | $6,400 |
| Team Averages | 0.360 | 89.2 | 0.197 | 40.3% | 8.4% | 20.6% | 39.4% |
Elite Plays – None
Secondary Plays – Francisco Lindor, Michael Brantley, Jose Ramirez, Edwin Encarnacion, Yonder Alonso
Stackability – YELLOW
Philadelphia at Miami – 7:10 PM ET
| Philadelphia | Miami | ||||||||||||||
 | Jake Arrieta |  | Wei-Yin Chen | ||||||||||||
| RIGHT | LEFT | ||||||||||||||
| Vegas Moneyline | Vegas Over/Under | ||||||||||||||
| PHI-130 | 8.0 | ||||||||||||||
| Stats | wOBA | xwOBA | HC% | aEV | K% | GB% | Stats | wOBA | xwOBA | HC% | aEV | K% | GB% | ||
|---|---|---|---|---|---|---|---|---|---|---|---|---|---|---|---|
| SP vs. Left (2016-17) | 0.308 | 0.329 | 27.4% | 87.3 | 16.4% | 54.1% | SP vs. Left (2016-17) | 0.261 | 0.260 | 36.8% | 88.7 | 32.2% | 50.0% | ||
| SP vs. Right (2016-17) | 0.294 | 0.298 | 29.7% | 86.8 | 17.9% | 56.5% | SP vs. Right (2016-17) | 0.377 | 0.335 | 34.1% | 86.0 | 12.6% | 34.5% | ||
Pitcher Grind Down
| Jake Arrieta | |||||||||||
 | FanDuel | DraftKings | FantasyDraft | ||||||||
| Salary: | $8,000 | Salary: | $8,900 | Salary: | $17,000 | ||||||
| Salary Rank: | 8 of 30 | Salary Rank: | 7 of 30 | Salary Rank: | 8 of 30 | ||||||
| Stats | Starts | SIERA | ERA | K% | BB% | GB% | HC% | SC% | aFV | SwS% | |
|---|---|---|---|---|---|---|---|---|---|---|---|
| 2017 | 30 | 4.15 | 3.53 | 23.1% | 7.8% | 45.1% | 29.4% | 20.0% | 92.1 | 8.7% | |
| 2018 | 17 | 4.27 | 3.47 | 17.3% | 7.5% | 55.5% | 28.7% | 20.3% | 93.0 | 7.4% | |
| L14 | 3 | 3.76 | 3.71 | 20.3% | 5.4% | 54.7% | 34.6% | 23.6% | 93.2 | 11.1% | |
Arrieta has a lot of green boxes in his pitching table above. He has a lot of good real life pitcher skills. Unfortunately, one of his only yellow boxes is his strikeout rate (17%). With such a low k-rate, he needs to pitch deep into games or face a high-strikeout offense in order to rack up enough fantasy points to reach value. While he does have an exploitable matchup against the Marlins in a pitcher-friendly ballpark, Miami is a team with a fairly low strikeout rate. I like Arrieta’s chances to pitch deep into this one and he has a decent floor, but he’s unlikely to make the final cut for me in this slate.
Quick Breakdown: Arrieta isn’t a terrible play tonight, but he’s not going to make my lineups in a 15-game slate.
| Wei-Yin Chen | |||||||||||
 | FanDuel | DraftKings | FantasyDraft | ||||||||
| Salary: | $6,000 | Salary: | $4,800 | Salary: | $9,000 | ||||||
| Salary Rank: | 27 of 30 | Salary Rank: | 29 of 30 | Salary Rank: | 29 of 30 | ||||||
| Stats | Starts | SIERA | ERA | K% | BB% | GB% | HC% | SC% | aFV | SwS% | |
|---|---|---|---|---|---|---|---|---|---|---|---|
| 2017 | 5 | 4.61 | 3.82 | 18.9% | 6.8% | 36.6% | 29.9% | 24.7% | 90.9 | 8.7% | |
| 2018 | 14 | 5.02 | 6.14 | 16.5% | 9.1% | 37.2% | 34.6% | 15.5% | 90.9 | 8.0% | |
| L14 | 3 | 3.75 | 4.41 | 19.7% | 4.6% | 48.0% | 42.0% | 16.0% | 92.1 | 8.4% | |
Chen isn’t a pitcher that I trust. His numbers are so bad against righties that he would have to face a left-handed heavy lineup to deserve consideration. There are very few offenses in baseball that will throw out more than three lefties when facing a southpaw and the Phillies aren’t one of them. They are projected to have eight righties in their lineup today. This is important to note because Chen has allowed a .335 xwOBA to righties with a k-rate of 13% and a ground ball rate of 35%.
Quick Breakdown: Avoid Chen in both cash games and tournaments.
Batter Grind Down
Philadelphia
The Phillies have one of the easiest matchups of the slate to disentangle. Wei-Yin Chen has held lefties to a .260 xwOBA and a 50% ground ball rate, while allowing a .335 xwOBA, a 35% hard contact rate, and a strikeout rate of only 13% to right-handed hitters. Rhys Hoskins is the highlighted play from this game. He owns a .367 xwOBA against southpaws this season. More importantly, Chen throws mostly fastballs (57% of the time) and Hoskins has a .317 ISO with a ground ball rate of only 19% against that pitch this season. I’m calling my shot — home run for Mr. Hoskins tonight.
Projected Lineup (Splits vs. LH Pitching)
| # | Player | Bats | xwOBA | aEV | ISO | HC% | BB% | K% | GB% | FD Pos. | FD Sal. | DK Pos. | DK Sal. | FDRFT Pos. | FDRFT Sal. |
|---|---|---|---|---|---|---|---|---|---|---|---|---|---|---|---|
| 1 | Cesar Hernandez | SWITCH | 0.350 | 88.5 | 0.057 | 32.4% | 16.2% | 19.0% | 50.0% | 2B | $3,200 | 2B | $4,200 | 2B | $8,400 |
| 2 | Rhys Hoskins | RIGHT | 0.367 | 90.1 | 0.138 | 28.9% | 21.5% | 19.0% | 22.2% | OF | $3,500 | OF | $4,600 | IF/OF | $9,100 |
| 3 | Odubel Herrera | LEFT | 0.308 | 86.5 | 0.174 | 23.3% | 4.1% | 19.4% | 47.9% | OF | $3,300 | OF | $4,400 | IF/OF | $8,300 |
| 4 | Carlos Santana | SWITCH | 0.369 | 89.3 | 0.202 | 41.6% | 11.8% | 11.8% | 46.8% | 1B | $3,000 | 1B | $4,000 | 1B | $7,700 |
| 5 | Aaron Altherr | RIGHT | 0.326 | 87.4 | 0.145 | 34.9% | 16.0% | 26.7% | 46.5% | OF | $2,000 | OF | $3,100 | RF | $5,800 |
| 6 | Scott Kingery | RIGHT | 0.252 | 84.5 | 0.078 | 25.5% | 7.2% | 31.3% | 34.0% | SS | $2,500 | SS | $3,100 | SS | $5,500 |
| 7 | Jorge Alfaro | RIGHT | 0.311 | 91.3 | 0.150 | 37.1% | 6.3% | 39.1% | 40.0% | C | $2,200 | C | $2,800 | C | $5,700 |
| 8 | Maikel Franco | RIGHT | 0.370 | 88.1 | 0.217 | 34.9% | 10.1% | 10.1% | 46.0% | 3B | $2,800 | 3B | $3,900 | 3B | $7,400 |
| 9 | Jake Arrieta | RIGHT | 0.379 | 68.0 | 0.000 | 16.7% | 12.5% | 12.5% | 25.0% | P | $8,000 | P | $8,900 | P | $17,000 |
| Team Averages | 0.337 | 86.0 | 0.129 | 30.6% | 11.7% | 21.0% | 39.8% |
Elite Plays – Rhys Hoskins, Carlos Santana (GPP)
Secondary Plays – Carlos Santana (Cash), Cesar Hernandez, Aaron Altherr, Scott Kingery
Stackability – YELLOW
Miami
Like most ground ball pitchers, Jake Arrieta throws primarily sinkers (57% of the time). This pitch has allowed him to induce a 54%+ ground ball rate to both left and right-handed hitters. While he doesn’t offer much in terms of strikeout upside, he has still managed to hold both batters from both sides under a .330 xwOBA and under a 30% hard contact rate this season. The only hitter that comes close to fitting the mold that we are looking for is Justin Bour. He is a fly-ball hitter that owns a 46% hard contact rate against the sinker this season.
Projected Lineup (Splits vs. RH Pitching)
| # | Player | Bats | xwOBA | aEV | ISO | HC% | BB% | K% | GB% | FD Pos. | FD Sal. | DK Pos. | DK Sal. | FDRFT Pos. | FDRFT Sal. |
|---|---|---|---|---|---|---|---|---|---|---|---|---|---|---|---|
| 1 | Derek Dietrich | LEFT | 0.350 | 88.2 | 0.160 | 36.0% | 6.3% | 21.0% | 41.9% | OF | $2,900 | OF | $3,800 | IF/OF | $7,700 |
| 2 | Brian Anderson | RIGHT | 0.356 | 89.9 | 0.112 | 37.9% | 7.8% | 18.9% | 51.5% | OF | $3,200 | 3B/OF | $4,000 | IF/OF | $7,500 |
| 3 | J.T. Realmuto | RIGHT | 0.399 | 91.3 | 0.268 | 42.7% | 5.9% | 16.0% | 43.3% | C | $3,300 | C | $4,600 | C | $9,000 |
| 4 | Justin Bour | LEFT | 0.385 | 90.5 | 0.239 | 42.6% | 16.9% | 25.1% | 39.3% | 1B | $3,200 | 1B | $3,900 | 1B | $7,600 |
| 5 | Starlin Castro | RIGHT | 0.315 | 87.7 | 0.127 | 36.4% | 5.9% | 19.0% | 48.8% | 2B | $3,500 | 2B | $4,000 | 2B | $7,200 |
| 6 | Martin Prado | RIGHT | 0.287 | 89.1 | 0.082 | 25.0% | 4.5% | 19.1% | 44.1% | 3B | $2,600 | 3B | $3,000 | 3B | $5,900 |
| 7 | JT Riddle | LEFT | 0.323 | 88.0 | 0.212 | 35.4% | 4.5% | 21.6% | 42.5% | SS | $2,700 | SS | $3,600 | SS | $7,400 |
| 8 | Cameron Maybin | RIGHT | 0.298 | 88.5 | 0.076 | 38.4% | 10.4% | 24.6% | 49.4% | OF | $2,600 | OF | $3,100 | CF | $6,000 |
| 9 | Wei-Yin Chen | LEFT | 0.113 | 73.5 | 0.000 | 0.0% | 0.0% | 37.5% | 88.9% | P | $6,000 | P | $4,800 | P | $9,000 |
| Team Averages | 0.314 | 87.4 | 0.142 | 32.7% | 6.9% | 22.5% | 50.0% |
Elite Plays – None
Secondary Plays – Justin Bour
Stackability – ORANGE
Toronto at Boston – 7:10 PM ET
| Toronto | Boston | ||||||||||||||
 | Ryan Borucki |  | Rick Porcello | ||||||||||||
| LEFT | RIGHT | ||||||||||||||
| Vegas Moneyline | Vegas Over/Under | ||||||||||||||
| BOS-210 | 9.5 | ||||||||||||||
| Stats | wOBA | xwOBA | HC% | aEV | K% | GB% | Stats | wOBA | xwOBA | HC% | aEV | K% | GB% | ||
|---|---|---|---|---|---|---|---|---|---|---|---|---|---|---|---|
| SP vs. Left (2016-17) | 0.243 | 0.269 | 28.6% | 86.4 | 12.5% | 42.9% | SP vs. Left (2016-17) | 0.304 | 0.328 | 39.3% | 89.2 | 26.9% | 33.8% | ||
| SP vs. Right (2016-17) | 0.289 | 0.325 | 31.1% | 89.7 | 21.5% | 44.4% | SP vs. Right (2016-17) | 0.286 | 0.300 | 25.5% | 87.5 | 19.3% | 53.4% | ||
Pitcher Grind Down
| Ryan Borucki | |||||||||||
 | FanDuel | DraftKings | FantasyDraft | ||||||||
| Salary: | $6,400 | Salary: | $6,000 | Salary: | $11,700 | ||||||
| Salary Rank: | 24 of 30 | Salary Rank: | 25 of 30 | Salary Rank: | 24 of 30 | ||||||
| Stats | Starts | SIERA | ERA | K% | BB% | GB% | HC% | SC% | aFV | SwS% | |
|---|---|---|---|---|---|---|---|---|---|---|---|
| 2018 | 3 | 4.21 | 2.25 | 19.8% | 7.4% | 44.1% | 30.5% | 11.9% | 91.8 | 9.0% | |
| L14 | 3 | 4.21 | 2.25 | 19.8% | 7.4% | 44.1% | 30.5% | 11.9% | 91.8 | 9.0% | |
Borucki is making his fourth career major league start tonight in Fenway. While this is a great ballpark to visit, this is not a great ballpark to pitch in. That green monster is so intimidating that throwing out the first pitch would give most people nerves, let alone actually making a start here. While Borucki has been very good at run prevention throughout his career in the minors, he doesn’t offer much in terms of strikeouts. He’s a southpaw that will be facing some of the best right-handed power hitters in baseball.
Quick Breakdown: Avoid Borucki in both cash games and tournaments.
| Rick Porcello | |||||||||||
 | FanDuel | DraftKings | FantasyDraft | ||||||||
| Salary: | $9,600 | Salary: | $9,800 | Salary: | $18,600 | ||||||
| Salary Rank: | 2 of 30 | Salary Rank: | 3 of 30 | Salary Rank: | 4 of 30 | ||||||
| Stats | Starts | SIERA | ERA | K% | BB% | GB% | HC% | SC% | aFV | SwS% | |
|---|---|---|---|---|---|---|---|---|---|---|---|
| 2017 | 33 | 4.28 | 4.65 | 20.5% | 5.4% | 39.2% | 38.3% | 17.1% | 91.1 | 9.4% | |
| 2018 | 19 | 3.72 | 3.58 | 22.7% | 5.4% | 45.4% | 31.2% | 21.5% | 90.4 | 8.7% | |
| L14 | 3 | 3.87 | 4.34 | 22.6% | 6.0% | 40.0% | 40.0% | 15.0% | 90.1 | 6.8% | |
For some strange reason, people hate targeting Porcello in DFS. It’s similar to the hate Tiger Woods gets in the higher stakes tournaments across the industry. I don’t really understand it, but I will continue to exploit it. On the season, Porcello owns a respectable 3.72 SIERA with a strikeout rate of 23%. He’s really worked hard to lower his hard contact rate and improve his soft contact rate. While his strikeout rate is higher when facing a lefty, he has held righties to a .300 xwOBA on a 53% ground ball rate. He’ll likely face five righties tonight against the Blue Jays — a team that he has dominated in the past.
Quick Breakdown: In a slate that lacks elite pitching, I’ll take Porcello in all formats at a price under $10,000.
Batter Grind Down
Toronto
The Blue Jays haven’t had much success against Rick Porcello in the past. Their current roster has a .287 wOBA against him with 49 strikeouts in 236 plate appearances. The fact that they only ever face him in hitter-friendly ballparks makes those numbers for Porcello even more impressive. He has been tough on righties this season, but has allowed a 39% hard contact rate with a high fly-ball rate to lefties. While far from core plays, Curtis Granderson, Justin Smoak, and Kendrys Morales are all viable one-offs for tournaments.
Projected Lineup (Splits vs. RH Pitching)
| # | Player | Bats | xwOBA | aEV | ISO | HC% | BB% | K% | GB% | FD Pos. | FD Sal. | DK Pos. | DK Sal. | FDRFT Pos. | FDRFT Sal. |
|---|---|---|---|---|---|---|---|---|---|---|---|---|---|---|---|
| 1 | Curtis Granderson | LEFT | 0.352 | 88.1 | 0.216 | 36.6% | 13.3% | 27.9% | 33.8% | OF | $2,600 | OF | $3,700 | RF | $7,300 |
| 2 | Yangervis Solarte | SWITCH | 0.338 | 88.5 | 0.170 | 30.1% | 8.2% | 15.5% | 40.3% | 3B | $2,700 | 2B/3B | $3,700 | 3B | $7,600 |
| 3 | Justin Smoak | SWITCH | 0.396 | 91.9 | 0.239 | 36.2% | 17.6% | 26.0% | 34.6% | 1B | $3,700 | 1B | $4,200 | 1B | $8,500 |
| 4 | Teoscar Hernandez | RIGHT | 0.388 | 92.0 | 0.234 | 39.7% | 5.2% | 24.5% | 37.0% | OF | $2,800 | OF | $3,800 | LF | $7,300 |
| 5 | Kendrys Morales | SWITCH | 0.396 | 93.4 | 0.220 | 44.6% | 8.0% | 23.3% | 42.9% | 1B | $2,400 | 1B | $3,400 | 1B | $6,800 |
| 6 | Russell Martin | RIGHT | 0.312 | 90.4 | 0.141 | 31.1% | 16.0% | 23.8% | 46.2% | C | $2,200 | C | $2,900 | C | $5,500 |
| 7 | Kevin Pillar | RIGHT | 0.331 | 87.8 | 0.159 | 34.8% | 4.0% | 19.8% | 38.2% | OF | $2,500 | OF | $3,300 | CF | $6,700 |
| 8 | Aledmys Diaz | RIGHT | 0.345 | 89.2 | 0.189 | 34.5% | 3.0% | 12.7% | 42.4% | SS | $2,800 | SS | $3,300 | SS | $6,700 |
| 9 | Devon Travis | RIGHT | 0.278 | 87.7 | 0.105 | 23.7% | 5.9% | 22.8% | 62.4% | 2B | $2,500 | 2B | $3,500 | 2B | $6,600 |
| Team Averages | 0.348 | 89.9 | 0.186 | 34.6% | 9.0% | 21.8% | 42.0% |
Elite Plays – None
Secondary Plays – Curtis Granderson, Justin Smoak, Kendrys Morales
Stackability – ORANGE
Boston
We are still dealing with a small sample size, but Ryan Borucki has thrown a ton of sinkers (over 60%) in his first few major league starts. It’s always difficult to weigh all of the different hitting splits that we can look at. For instance, Mookie Betts has mashed southpaws to the tune of a .475 xwOBA this season. However, his numbers against the sinker aren’t appealing for a player at his price point. The same goes for Steve Pearce (who left yesterday’s game after being hit by a pitch) and Xander Bogaerts. This is an approach that could make me look like a genius or a fool, but I will only be playing one Red Sox hitter tonight. J.D. Martinez always hits lefties well and currently carries a 64% hard contact rate against the sinker this season.
Projected Lineup (Splits vs. LH Pitching)
| # | Player | Bats | xwOBA | aEV | ISO | HC% | BB% | K% | GB% | FD Pos. | FD Sal. | DK Pos. | DK Sal. | FDRFT Pos. | FDRFT Sal. |
|---|---|---|---|---|---|---|---|---|---|---|---|---|---|---|---|
| 1 | Mookie Betts | RIGHT | 0.475 | 91.2 | 0.388 | 38.3% | 13.8% | 11.3% | 38.3% | OF | $5,200 | OF | $6,100 | RF | $11,200 |
| 2 | Andrew Benintendi | LEFT | 0.282 | 85.1 | 0.200 | 17.9% | 9.4% | 23.5% | 44.6% | OF | $4,500 | OF | $5,300 | LF | $9,800 |
| 3 | J.D. Martinez | RIGHT | 0.405 | 94.2 | 0.231 | 49.0% | 6.0% | 32.5% | 41.2% | OF | $5,100 | OF | $5,800 | RF | $10,300 |
| 4 | Steve Pearce | RIGHT | 0.447 | 87.1 | 0.232 | 32.6% | 6.7% | 16.7% | 39.1% | 1B | $3,300 | 1B/OF | $4,000 | IF/OF | $7,200 |
| 5 | Xander Bogaerts | RIGHT | 0.368 | 91.3 | 0.143 | 31.9% | 16.0% | 21.3% | 36.2% | SS | $4,000 | SS | $5,100 | SS | $9,500 |
| 6 | Eduardo Nunez | RIGHT | 0.317 | 87.3 | 0.088 | 28.8% | 6.9% | 17.2% | 49.2% | 2B | $2,800 | 2B/SS | $3,600 | 2B | $7,300 |
| 7 | Brock Holt | LEFT | 0.312 | 85.0 | 0.080 | 15.8% | 16.7% | 20.0% | 55.6% | 2B | $2,900 | 2B/SS | $3,500 | 2B | $6,400 |
| 8 | Sandy Leon | SWITCH | 0.365 | 85.5 | 0.121 | 42.3% | 8.1% | 21.6% | 30.8% | C | $2,300 | C | $3,300 | C | $6,700 |
| 9 | Jackie Bradley | LEFT | 0.294 | 88.7 | 0.078 | 28.6% | 2.9% | 31.4% | 59.5% | OF | $2,800 | OF | $3,500 | CF | $6,400 |
| Team Averages | 0.363 | 88.4 | 0.173 | 31.7% | 9.6% | 21.7% | 43.8% |
Elite Plays – J.D. Martinez
Secondary Plays – Mookie Betts, Steve Pearce (if active), Xander Bogaerts
Stackability – YELLOW
Note: Unless noted, all statistics in the Grind Down are from the 2018 season.