MLB Grind Down: Saturday, September 24th

Jump to Page 1 2 3
The RotoGrinders MLB Grind Down will give you an in-depth analysis into the upcoming MLB schedule. This article will break down the numbers for every single game and give you analysis on which trends you can exploit. While matchups are a major factor in daily fantasy baseball, there are plenty of other factors to consider such as injuries, weather, and salaries.
The analysis should point you in the right direction, but it is still up to you to decipher the information and make your own selections. No sport has more variance than baseball. The best choice is not always the right choice but following the trends will win you money over time.
Note: As always, if you want to try a new DFS site, be sure to click through a RotoGrinders link and use our DraftKings promo code and FanDuel promo code to receive the best perks in the industry.
Stackability Rating System:
GREEN – One of the top stacks of the day, viable in cash games and GPPs
YELLOW – A viable stack option in most formats, specifically GPPs
ORANGE – There are better stacks out there, but playable in large GPPs
RED – Not a recommended stack for cash games or GPPs
St. Louis at Chicago Cubs – 4:00 AM ET
| St. Louis | Chicago Cubs | ||||||||
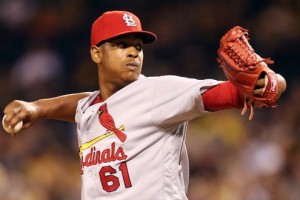
 | Alex Reyes |  | Jason Hammel | ||||||
| RIGHT | RIGHT | ||||||||
| Vegas Moneyline | Vegas Over/Under | ||||||||
| CHC -142 | 8.5 | ||||||||
| Stats | wOBA | HR All. | HC% | K% | Stats | wOBA | HR All. | HC% | K% |
|---|---|---|---|---|---|---|---|---|---|
| SP vs. Left (2016) | 0.264 | 0 | 15.8% | 19.3% | SP vs. Left (2016) | 0.346 | 11 | 32.8% | 20.4% |
| SP vs. Right (2016) | 0.208 | 1 | 31.8% | 34.9% | SP vs. Right (2016) | 0.281 | 13 | 32.1% | 21.4% |
Pitcher Grind Down
| Alex Reyes | ||||||||||
 | FanDuel | DraftKings | ||||||||
| Salary: | $5,500 | Salary: | $7,700 | |||||||
| FPPG: | 24.9 | FPPG: | 14.0 | |||||||
| Pitcher Rating: | 61.9 | Pitcher Rank: | 15 | |||||||
| Statistics | Starts | PitchPS | SIERA | ERA | K% | BB% | SS% | GB% | FB% | HC% |
|---|---|---|---|---|---|---|---|---|---|---|
| L30 Days | 2 | 198.0 | 4.30 | 1.64 | 28.0% | 15.1% | 12.4% | 42.0% | 48.0% | 26.4% |
| 2016 | 3 | 193.0 | 3.90 | 1.03 | 28.6% | 12.9% | 12.3% | 44.3% | 44.3% | 24.4% |
Home (2015-16):—ERA: 0.73 — K%: 24.5% — wOBA Allowed: 0.228
Away (2015-16):—ERA: 1.19 — K%: 31.0% — wOBA Allowed: 0.232
Reyes has now fully taken over a starting rotation spot, as Garcia has continued to struggle. On the season, he has a solid 1.03 ERA to go along with an elite 28.6% strikeout rate. His SIERA sits almost three full runs higher at 3.90, which shows a bit of regression may be in order, and that could happen today against a Cubs squad that is ranked eighth in wOBA and third in runs per game. There are better daytime options, but he Reyes very cheap at FD today.
| Jason Hammel | ||||||||||
 | FanDuel | DraftKings | ||||||||
| Salary: | $8,500 | Salary: | $8,800 | |||||||
| FPPG: | 26.6 | FPPG: | 13.6 | |||||||
| Pitcher Rating: | 68.9 | Pitcher Rank: | 8 | |||||||
| Statistics | Starts | PitchPS | SIERA | ERA | K% | BB% | SS% | GB% | FB% | HC% |
|---|---|---|---|---|---|---|---|---|---|---|
| L30 Days | 5 | 86.6 | 4.53 | 8.61 | 19.8% | 7.8% | 11.8% | 32.5% | 42.5% | 46.3% |
| 2016 | 29 | 88.6 | 4.25 | 3.56 | 21.0% | 7.7% | 10.2% | 42.7% | 37.9% | 32.4% |
| 2015 | 31 | 88.7 | 3.45 | 3.74 | 24.2% | 5.6% | 10.9% | 38.3% | 37.2% | 32.9% |
Home (2015-16):—ERA: 2.93 — K%: 22.1% — wOBA Allowed: 0.285
Away (2015-16):—ERA: 4.39 — K%: 23.2% — wOBA Allowed: 0.329
Hammel bounced back from two subpar starts to go seven strong with just two earned runs in his last start. He will look to continue that form against a solid Cards lineup that has hit him for 10 earned runs over 24.2 innings. This Cardinals offense has been solid all year, as they are ranked fourth in wOBA and second in ISO against right-handed pitching. With that said, Vegas has him as a decent favorite, and he is in play if you do not want to pay the premium for Darvish in the early slate.
Batter Grind Down
St. Louis
If you want to attack Hammel, do it from the left side of the plate, where he has allowed a .346 wOBA to lefties. The Cardinals have a low projected run total, and I won’t have too much exposure, except for one off lefties.
- Cardinals Offense (2016)
Team wOBA vs. RHP — 0.331 (4 of 30)
Team wOBA L30 Days — 0.312 (17 of 30)
Team ISO vs. RHP — 0.194 (2 of 30)
Team K% vs. RHP — 21.1% (18 of 30)
Pitches Per PA vs. RHP — 3.84 (21 of 30)
Runs Per Game — 4.79 (5 of 30)
Projected Run Total — 4.00 (22 of 30)
Projected Lineup
| # | Player | Bats | wOBA vs. RHP | ISO vs. RHP | HC% vs. RHP | wOBA L14 | FD Position | FD Salary | DK Position | DK Salary |
|---|---|---|---|---|---|---|---|---|---|---|
| 1 | Matt Carpenter | LEFT | 0.388 | 0.266 | 47.1% | 0.311 | 2B | $3,500 | 2B/3B | $4,100 |
| 2 | Aledmys Diaz | RIGHT | 0.396 | 0.238 | 35.1% | 0.304 | SS | $3,300 | SS | $4,700 |
| 3 | Stephen Piscotty | RIGHT | 0.319 | 0.156 | 33.1% | 0.256 | OF | $3,100 | OF | $3,600 |
| 4 | Matt Adams | LEFT | 0.326 | 0.214 | 37.6% | 0.373 | 1B | $2,700 | 1B | $3,600 |
| 5 | Yadier Molina | RIGHT | 0.329 | 0.112 | 32.7% | 0.295 | C | $2,800 | C | $3,100 |
| 6 | Randal Grichuk | RIGHT | 0.331 | 0.252 | 41.9% | 0.343 | OF | $3,500 | OF | $4,400 |
| 7 | Jhonny Peralta | RIGHT | 0.304 | 0.153 | 33.6% | 0.225 | SS | $2,800 | 3B | $2,800 |
| 8 | Kolten Wong | LEFT | 0.298 | 0.116 | 24.6% | 0.241 | 2B | $2,700 | 2B | $2,700 |
| 9 | Alex Reyes | RIGHT | 0.098 | 0.000 | 0.0% | 0.000 | P | $5,500 | P | $7,700 |
| Team Averages | — | 0.310 | 0.167 | 31.7% | 0.261 | — | — | — | — |
Elite Plays – Matt Carpenter
Secondary Plays – Matt Adams, Kolten Wong
Stackability – RED
Chicago Cubs
The Cubs are decent favorites today and come in with a projected run total of 4.50, which is the 11th-highest of the entire slate. They are a decent offense to attack in the early slate.
- Cubs Offense (2016)
Team wOBA vs. RHP — 0.327 (8 of 30)
Team wOBA L30 Days — 0.316 (14 of 30)
Team ISO vs. RHP — 0.168 (13 of 30)
Team K% vs. RHP — 21.7% (22 of 30)
Pitches Per PA vs. RHP — 3.97 (3 of 30)
Runs Per Game — 4.97 (3 of 30)
Projected Run Total — 4.50 (11 of 30)
Projected Lineup
| # | Player | Bats | wOBA vs. RHP | ISO vs. RHP | HC% vs. RHP | wOBA L14 | FD Position | FD Salary | DK Position | DK Salary |
|---|---|---|---|---|---|---|---|---|---|---|
| 1 | Dexter Fowler | SWITCH | 0.356 | 0.165 | 28.1% | 0.478 | OF | $4,000 | OF | $5,100 |
| 2 | Kris Bryant | RIGHT | 0.388 | 0.253 | 41.2% | 0.316 | 3B | $4,200 | 3B/OF | $4,800 |
| 3 | Anthony Rizzo | LEFT | 0.408 | 0.277 | 39.1% | 0.357 | 1B | $4,500 | 1B | $5,200 |
| 4 | Ben Zobrist | SWITCH | 0.345 | 0.159 | 32.9% | 0.293 | 2B | $3,000 | 2B | $4,000 |
| 5 | Addison Russell | RIGHT | 0.314 | 0.163 | 29.4% | 0.338 | SS | $2,400 | SS | $3,700 |
| 6 | Jason Heyward | LEFT | 0.284 | 0.097 | 27.1% | 0.348 | OF | $2,900 | OF | $3,200 |
| 7 | Chris Coghlan | LEFT | 0.262 | 0.135 | 29.8% | 0.466 | OF | $3,000 | 2B/OF | $2,800 |
| 8 | Miguel Montero | LEFT | 0.314 | 0.161 | 30.1% | 0.347 | C | $2,500 | C | $3,500 |
| 9 | Jason Hammel | RIGHT | 0.224 | 0.060 | 18.2% | 0.219 | P | $8,500 | P | $8,800 |
| Team Averages | — | 0.322 | 0.163 | 30.7% | 0.351 | — | — | — | — |
Elite Plays – Anthony Rizzo, Kris Bryant
Secondary Plays – Dexter Fowler, Ben Zobrist
Stackability – ORANGE
NY Yankees at Toronto – 1:07 PM ET
| NY Yankees | Toronto | ||||||||
 | CC Sabathia |  | Marcus Stroman | ||||||
| LEFT | RIGHT | ||||||||
| Vegas Moneyline | Vegas Over/Under | ||||||||
| TOR -188 | 9.0 | ||||||||
| Stats | wOBA | HR All. | HC% | K% | Stats | wOBA | HR All. | HC% | K% |
|---|---|---|---|---|---|---|---|---|---|
| SP vs. Left (2016) | 0.307 | 4 | 22.2% | 23.8% | SP vs. Left (2016) | 0.323 | 11 | 33.8% | 19.5% |
| SP vs. Right (2016) | 0.320 | 17 | 26.3% | 18.9% | SP vs. Right (2016) | 0.310 | 10 | 29.3% | 20.0% |
Pitcher Grind Down
| CC Sabathia | ||||||||||
 | FanDuel | DraftKings | ||||||||
| Salary: | $7,100 | Salary: | $7,400 | |||||||
| FPPG: | 28.1 | FPPG: | 14.1 | |||||||
| Pitcher Rating: | 49.2 | Pitcher Rank: | 23 | |||||||
| Statistics | Starts | PitchPS | SIERA | ERA | K% | BB% | SS% | GB% | FB% | HC% |
|---|---|---|---|---|---|---|---|---|---|---|
| L30 Days | 5 | 96.0 | 3.55 | 2.40 | 22.9% | 5.1% | 10.8% | 54.2% | 33.7% | 25.0% |
| 2016 | 28 | 96.9 | 4.36 | 4.19 | 19.8% | 8.4% | 9.9% | 49.2% | 33.6% | 25.5% |
| 2015 | 29 | 93.2 | 4.08 | 4.73 | 18.9% | 6.9% | 9.1% | 45.9% | 32.4% | 29.1% |
Home (2015-16):—ERA: 5.14 — K%: 19.9% — wOBA Allowed: 0.336
Away (2015-16):—ERA: 3.88 — K%: 18.9% — wOBA Allowed: 0.326
Sabathia has not been terrible this year, as he sports a 4.35 SIERA and 19.8 percent strikeout rate. Still, the matchup today is one that can easily pick him apart, as he takes on a Blue Jays squad in Rogers Centre. Due to the park and the team, Sabathia is an easy fade today.
| Marcus Stroman | ||||||||||
 | FanDuel | DraftKings | ||||||||
| Salary: | $7,600 | Salary: | $8,500 | |||||||
| FPPG: | 28.9 | FPPG: | 14.6 | |||||||
| Pitcher Rating: | 71.7 | Pitcher Rank: | 7 | |||||||
| Statistics | Starts | PitchPS | SIERA | ERA | K% | BB% | SS% | GB% | FB% | HC% |
|---|---|---|---|---|---|---|---|---|---|---|
| L30 Days | 5 | 96.6 | 3.19 | 4.15 | 22.7% | 7.0% | 11.6% | 64.0% | 15.7% | 30.0% |
| 2016 | 30 | 96.9 | 3.54 | 4.50 | 19.7% | 6.1% | 9.4% | 60.4% | 20.1% | 31.6% |
| 2015 | 4 | 93.3 | 3.28 | 1.67 | 17.5% | 5.8% | 7.2% | 64.1% | 17.9% | 21.8% |
Home (2015-16):—ERA: 4.33 — K%: 18.1% — wOBA Allowed: 0.307
Away (2015-16):—ERA: 3.98 — K%: 20.7% — wOBA Allowed: 0.310
Stroman has been a solid mid-priced pitcher this year for fantasy purposes. He never gets priced too high because his strikeout rate is just 19.7 percent, but he does have a 3.54 SIERA in 30 starts this year. He gets a matchup against the Yankees today, who are an average offense on the season, but do have the eighth-highest team wOBA in the last 30 days. Stroman is in play as an SP2 and could be used on FD as he should be in line for the win today.
Batter Grind Down
NY Yankees
Stroman has allowed a .323 wOBA to left-handed batters, which could bode well for a few of the Yankee bats depending on who they throw out there. I will not have too much exposure though, as Vegas has the Yankees projected to score the seventh-fewest runs of any team on the day.
- Yankees Offense (2016)
Team wOBA vs. RHP — 0.314 (17 of 30)
Team wOBA L30 Days — 0.330 (8 of 30)
Team ISO vs. RHP — 0.162 (17 of 30)
Team K% vs. RHP — 20.1% (10 of 30)
Pitches Per PA vs. RHP — 3.83 (23 of 30)
Runs Per Game — 4.26 (20 of 30)
Projected Run Total — 3.99 (24 of 30)
Projected Lineup
| # | Player | Bats | wOBA vs. RHP | ISO vs. RHP | HC% vs. RHP | wOBA L14 | FD Position | FD Salary | DK Position | DK Salary |
|---|---|---|---|---|---|---|---|---|---|---|
| 1 | Brett Gardner | LEFT | 0.325 | 0.108 | 26.6% | 0.329 | OF | $3,200 | OF | $4,000 |
| 2 | Jacoby Ellsbury | LEFT | 0.330 | 0.133 | 27.5% | 0.270 | OF | $3,000 | OF | $3,500 |
| 3 | Gary Sanchez | RIGHT | 0.519 | 0.416 | 42.3% | 0.483 | C | $4,300 | C | $5,000 |
| 4 | Brian McCann | LEFT | 0.334 | 0.182 | 37.2% | 0.408 | C | $3,100 | C | $3,800 |
| 5 | Mark Teixeira | SWITCH | 0.269 | 0.159 | 31.9% | 0.374 | 1B | $2,600 | 1B | $3,100 |
| 6 | Didi Gregorius | LEFT | 0.311 | 0.181 | 25.8% | 0.274 | SS | $2,900 | SS | $3,300 |
| 7 | Chase Headley | SWITCH | 0.319 | 0.163 | 32.7% | 0.306 | 3B | $2,700 | 3B | $3,200 |
| 8 | Mason Williams | LEFT | 0.399 | 0.000 | 33.3% | 0.362 | OF | $2,400 | ||
| 9 | Ronald Torreyes | RIGHT | 0.335 | 0.152 | 22.5% | 0.168 | 3B | $2,400 | 3B/SS | $2,400 |
| Team Averages | — | 0.349 | 0.166 | 31.1% | 0.330 | — | — | — | — |
Elite Plays – Brett Gardner, Jacoby Ellsbury
Secondary Plays – Gary Sanchez
Stackability – RED
Toronto
Toronto is a huge favorite today against Sabathia, who has allowed a .307+ wOBA from both sides of the plate this year. The Jays have a projected run total of 5.01, which is the highest of the entire 30 teams on the schedule today. Stack ‘em up against Sabathia with confidence today.
- Blue Jays Offense (2016)
Team wOBA vs. LHP — 0.329 (7 of 30)
Team wOBA L30 Days — 0.326 (9 of 30)
Team ISO vs. LHP — 0.175 (7 of 30)
Team K% vs. LHP — 20.0% (7 of 30)
Pitches Per PA vs. LHP — 3.92 (8 of 30)
Runs Per Game — 4.75 (7 of 30)
Projected Run Total — 5.01 (1 of 30)
Projected Lineup
| # | Player | Bats | wOBA vs. LHP | ISO vs. LHP | HC% vs. LHP | wOBA L14 | FD Position | FD Salary | DK Position | DK Salary |
|---|---|---|---|---|---|---|---|---|---|---|
| 1 | Devon Travis | RIGHT | 0.260 | 0.078 | 25.7% | 0.366 | 2B | $3,700 | 2B | $3,800 |
| 2 | Jose Bautista | RIGHT | 0.318 | 0.212 | 41.4% | 0.367 | OF | $3,900 | OF | $4,100 |
| 3 | Edwin Encarnacion | RIGHT | 0.377 | 0.287 | 38.8% | 0.372 | 1B | $4,100 | 1B | $5,100 |
| 4 | Russell Martin | RIGHT | 0.311 | 0.155 | 47.8% | 0.284 | C | $3,000 | C | $3,900 |
| 5 | Troy Tulowitzki | RIGHT | 0.335 | 0.167 | 33.3% | 0.282 | SS | $3,200 | SS | $3,400 |
| 6 | Melvin Upton | RIGHT | 0.377 | 0.279 | 29.9% | 0.198 | OF | $3,400 | OF | $3,800 |
| 7 | Kevin Pillar | RIGHT | 0.310 | 0.128 | 33.9% | 0.294 | OF | $2,800 | OF | $3,300 |
| 8 | Ezequiel Carrera | LEFT | 0.397 | 0.138 | 25.9% | 0.376 | OF | $2,300 | OF | $3,100 |
| 9 | Darwin Barney | RIGHT | 0.343 | 0.115 | 31.3% | 0.277 | 2B | $2,100 | 2B/3B | $2,700 |
| Team Averages | — | 0.336 | 0.173 | 34.2% | 0.313 | — | — | — | — |
Elite Plays – Edwin Encarnacion, Josh Donaldson, Devon Travis, Russell Martin
Secondary Plays – Troy Tulowitzki, Melvin Upton, Kevin Pillar
Stackability – GREEN
Texas at Oakland – 4:05 PM ET
| Texas | Oakland | ||||||||
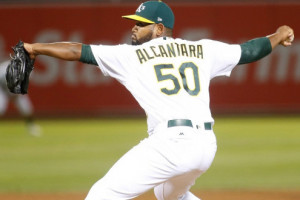
 | Yu Darvish |  | Raul Alcantara | ||||||
| RIGHT | RIGHT | ||||||||
| Vegas Moneyline | Vegas Over/Under | ||||||||
| TEX -200 | 8.0 | ||||||||
| Stats | wOBA | HR All. | HC% | K% | Stats | wOBA | HR All. | HC% | K% |
|---|---|---|---|---|---|---|---|---|---|
| SP vs. Left (2016) | 0.282 | 4 | 33.3% | 28.9% | SP vs. Left (2016) | 0.310 | 1 | 46.4% | 6.3% |
| SP vs. Right (2016) | 0.305 | 8 | 26.8% | 31.2% | SP vs. Right (2016) | 0.443 | 2 | 40.9% | 16.1% |
Pitcher Grind Down
| Yu Darvish | ||||||||||
 | FanDuel | DraftKings | ||||||||
| Salary: | $10,700 | Salary: | $10,400 | |||||||
| FPPG: | 36.3 | FPPG: | 20.0 | |||||||
| Pitcher Rating: | 86.6 | Pitcher Rank: | 4 | |||||||
| Statistics | Starts | PitchPS | SIERA | ERA | K% | BB% | SS% | GB% | FB% | HC% |
|---|---|---|---|---|---|---|---|---|---|---|
| L30 Days | 5 | 94.2 | 4.07 | 6.04 | 27.1% | 11.6% | 9.8% | 44.2% | 41.6% | 26.0% |
| 2016 | 15 | 92.2 | 3.28 | 3.81 | 30.2% | 7.9% | 11.9% | 40.4% | 39.6% | 29.8% |
Home (2015-16):—ERA: 4.59 — K%: 27.4% — wOBA Allowed: 0.313
Away (2015-16):—ERA: 2.72 — K%: 34.2% — wOBA Allowed: 0.269
Darvish comes in with a 3.21 SIERA and elite 30.2% strikeout rate. He is in a fantastic spot today against the Athletics, who ranked 27th in wOBA and 23rd in ISO. He also should get plenty of run support as he gets to face Alcantara on the mound against him and is a -200 favorite. He gets a great ballpark boost, and his strikeout rate should outweigh the fact that the A’s strike out at a low 18.9 percent rate. He is the best option of the early slate.
| Raul Alcantara | ||||||||||
 | FanDuel | DraftKings | ||||||||
| Salary: | $5,600 | Salary: | $4,300 | |||||||
| FPPG: | 16.3 | FPPG: | 6.2 | |||||||
| Pitcher Rating: | 24.1 | Pitcher Rank: | 30 | |||||||
| Statistics | Starts | PitchPS | SIERA | ERA | K% | BB% | SS% | GB% | FB% | HC% |
|---|---|---|---|---|---|---|---|---|---|---|
| L30 Days | 3 | 83.3 | 5.23 | 5.65 | 11.1% | 3.2% | 5.2% | 36.0% | 46.0% | 46.0% |
| 2016 | 3 | 83.3 | 5.22 | 5.65 | 11.1% | 3.2% | 5.2% | 36.0% | 46.0% | 44.0% |
Home (2015-16):—ERA: 7.27 — K%: 9.8% — wOBA Allowed: 0.443
Away (2015-16):—ERA: 3.18 — K%: 13.6% — wOBA Allowed: 0.251
Alcantara is someone who is never really an option for DFS. He has a 5.21 SIERA with a low strikeout rate of 11.1 percent after his first three starts. Today, he has a very difficult matchup against the Rangers, who are a top-10 offense on the year and have been rolling lately, as they have the fourth-highest team wOBA in the last 30 days. Avoid Alcantara today.
Batter Grind Down
Texas
In a short sample size, Alcantara has given up a very high .443 wOBA to righties and .310 to lefties. This puts the majority of the Texas lineup in play today, as they have a 4.58 projected total (seventh-highest). It’s worth noting, though, that Texas clinched the AL West last night, so odds are we’ll see lots of reserves in the lineup today.
- Rangers Offense (2016)
Team wOBA vs. RHP — 0.326 (9 of 30)
Team wOBA L30 Days — 0.343 (4 of 30)
Team ISO vs. RHP — 0.177 (7 of 30)
Team K% vs. RHP — 19.8% (7 of 30)
Pitches Per PA vs. RHP — 3.83 (22 of 30)
Runs Per Game — 4.78 (6 of 30)
Projected Run Total — 4.58 (7 of 30)
Projected Lineup
| # | Player | Bats | wOBA vs. RHP | ISO vs. RHP | HC% vs. RHP | wOBA L14 | FD Position | FD Salary | DK Position | DK Salary |
|---|---|---|---|---|---|---|---|---|---|---|
| 1 | Carlos Gomez | RIGHT | 0.291 | 0.158 | 30.3% | 0.390 | OF | $3,500 | OF | $3,400 |
| 2 | Ian Desmond | RIGHT | 0.332 | 0.169 | 30.3% | 0.302 | OF | $3,900 | OF | $3,600 |
| 3 | Carlos Beltran | SWITCH | 0.342 | 0.207 | 34.5% | 0.339 | OF | $3,800 | OF | $3,700 |
| 4 | Adrian Beltre | RIGHT | 0.351 | 0.197 | 33.2% | 0.452 | 3B | $3,000 | 3B | $4,100 |
| 5 | Rougned Odor | LEFT | 0.347 | 0.247 | 33.8% | 0.263 | 2B | $3,700 | 2B | $4,300 |
| 6 | Jonathan Lucroy | RIGHT | 0.371 | 0.193 | 32.4% | 0.278 | C | $3,300 | C | $4,400 |
| 7 | Mitch Moreland | LEFT | 0.313 | 0.198 | 35.8% | 0.188 | 1B | $3,100 | 1B | $2,900 |
| 8 | Nomar Mazara | LEFT | 0.351 | 0.195 | 30.2% | 0.381 | OF | $3,500 | OF | $4,100 |
| 9 | Elvis Andrus | RIGHT | 0.327 | 0.123 | 25.9% | 0.426 | SS | $2,800 | SS | $3,900 |
| Team Averages | — | 0.336 | 0.187 | 31.8% | 0.335 | — | — | — | — |
Elite Plays – Carlos Gomez, Adrian Beltre
Secondary Plays – Ian Desmond, Carlos Beltran, Rougned Odor
Stackability – YELLOW
Oakland
There is no need to spend any salary dollars on the Athletics bats today. They are huge underdogs, are facing Darvish, and have the fourth-lowest team total of the entire day.
- Athletics Offense (2016)
Team wOBA vs. RHP — 0.303 (27 of 30)
Team wOBA L30 Days — 0.302 (25 of 30)
Team ISO vs. RHP — 0.148 (23 of 30)
Team K% vs. RHP — 18.9% (4 of 30)
Pitches Per PA vs. RHP — 3.85 (19 of 30)
Runs Per Game — 4.10 (26 of 30)
Projected Run Total — 3.42 (27 of 30)
Projected Lineup
| # | Player | Bats | wOBA vs. RHP | ISO vs. RHP | HC% vs. RHP | wOBA L14 | FD Position | FD Salary | DK Position | DK Salary |
|---|---|---|---|---|---|---|---|---|---|---|
| 1 | Joey Wendle | LEFT | 0.289 | 0.057 | 30.4% | 0.303 | 2B | $2,400 | 2B | $2,400 |
| 2 | Stephen Vogt | LEFT | 0.316 | 0.157 | 27.0% | 0.302 | C | $3,000 | C | $3,200 |
| 3 | Ryon Healy | RIGHT | 0.353 | 0.195 | 28.0% | 0.439 | 3B | $3,500 | 3B | $3,500 |
| 4 | Danny Valencia | RIGHT | 0.324 | 0.145 | 31.6% | 0.311 | 3B | $2,900 | 3B/OF | $3,300 |
| 5 | Yonder Alonso | LEFT | 0.307 | 0.119 | 34.7% | 0.347 | 1B | $2,500 | 1B | $2,800 |
| 6 | Marcus Semien | RIGHT | 0.301 | 0.180 | 27.4% | 0.281 | SS | $3,000 | SS | $3,200 |
| 7 | Bruce Maxwell | LEFT | 0.349 | 0.137 | 43.2% | 0.438 | C | $2,800 | C | $2,400 |
| 8 | Brett Eibner | RIGHT | 0.262 | 0.163 | 21.2% | 0.318 | OF | $2,000 | OF | $3,000 |
| 9 | Jake Smolinski | RIGHT | 0.256 | 0.069 | 28.6% | 0.170 | OF | $2,400 | OF | $2,300 |
| Team Averages | — | 0.306 | 0.136 | 30.2% | 0.323 | — | — | — | — |
Elite Plays – None
Secondary Plays – None
Stackability – RED
Boston at Tampa Bay – 6:10 PM ET
| Boston | Tampa Bay | ||||||||
 | Rick Porcello |  | Matt Andriese | ||||||
| RIGHT | RIGHT | ||||||||
| Vegas Moneyline | Vegas Over/Under | ||||||||
| BOS -140 | 8.0 | ||||||||
| Stats | wOBA | HR All. | HC% | K% | Stats | wOBA | HR All. | HC% | K% |
|---|---|---|---|---|---|---|---|---|---|
| SP vs. Left (2016) | 0.253 | 8 | 32.9% | 21.6% | SP vs. Left (2016) | 0.298 | 7 | 33.9% | 19.0% |
| SP vs. Right (2016) | 0.291 | 14 | 28.7% | 20.1% | SP vs. Right (2016) | 0.314 | 8 | 33.2% | 21.6% |
Pitcher Grind Down
| Rick Porcello | ||||||||||
 | FanDuel | DraftKings | ||||||||
| Salary: | $9,800 | Salary: | $12,600 | |||||||
| FPPG: | 38.4 | FPPG: | 20.6 | |||||||
| Pitcher Rating: | 78.9 | Pitcher Rank: | 5 | |||||||
| Statistics | Starts | PitchPS | SIERA | ERA | K% | BB% | SS% | GB% | FB% | HC% |
|---|---|---|---|---|---|---|---|---|---|---|
| L30 Days | 6 | 109.5 | 3.44 | 2.47 | 23.0% | 1.8% | 9.4% | 42.3% | 40.7% | 30.1% |
| 2016 | 31 | 102.9 | 3.78 | 3.08 | 20.9% | 3.5% | 8.0% | 44.4% | 37.2% | 30.9% |
| 2015 | 28 | 98.0 | 3.73 | 4.92 | 20.2% | 5.2% | 8.5% | 45.7% | 32.5% | 32.8% |
Home (2015-16):—ERA: 3.49 — K%: 21.2% — wOBA Allowed: 0.295
Away (2015-16):—ERA: 4.28 — K%: 20.0% — wOBA Allowed: 0.311
Porcello has been extremely consistent over the course of his last 10 games and for the majority of the second have of the season. He rocks a 3.44 SIERA and 23 percent strikeout rate over the last month of play and he has been great against this Rays squad, as he has a 2.86 ERA after 34.2 innings with 37 strikeouts. His price is tough to play at DK, but is fully in play at FanDuel today.
| Matt Andriese | ||||||||||
 | FanDuel | DraftKings | ||||||||
| Salary: | $5,800 | Salary: | $5,800 | |||||||
| FPPG: | 21.0 | FPPG: | 10.9 | |||||||
| Pitcher Rating: | 53.9 | Pitcher Rank: | 17 | |||||||
| Statistics | Starts | PitchPS | SIERA | ERA | K% | BB% | SS% | GB% | FB% | HC% |
|---|---|---|---|---|---|---|---|---|---|---|
| L30 Days | 6 | 87.3 | 3.93 | 7.34 | 20.1% | 3.6% | 9.4% | 41.5% | 38.7% | 29.3% |
| 2016 | 17 | 106.9 | 3.90 | 4.41 | 20.4% | 4.8% | 10.3% | 43.8% | 36.8% | 33.5% |
| 2015 | 8 | 136.0 | 4.02 | 4.11 | 17.4% | 6.4% | 8.6% | 48.1% | 34.8% | 32.9% |
Home (2015-16):—ERA: 4.03 — K%: 20.1% — wOBA Allowed: 0.296
Away (2015-16):—ERA: 4.65 — K%: 18.2% — wOBA Allowed: 0.327
Andriese has a 3.90 SIERA on the year with a decent 20.4 percent strikeout rate. While those are good numbers, he has to face the Red Sox today, who are arguably the best offense in baseball, and against whom he has a 7.11 ERA against on the year. He is an easy fade this afternoon.
Batter Grind Down
Boston
The Red Sox get a major downgrade in parks today and Vegas adapts accordingly. They are decent favorites today, but they just have a middle-of-the-road projected run total of 4.23 (16th-highest). The big bats are always in play against a non-elite pitcher, but there are better offenses late.
- Red Sox Offense (2016)
Team wOBA vs. RHP — 0.351 (1 of 30)
Team wOBA L30 Days — 0.351 (2 of 30)
Team ISO vs. RHP — 0.187 (5 of 30)
Team K% vs. RHP — 18.1% (3 of 30)
Pitches Per PA vs. RHP — 3.93 (7 of 30)
Runs Per Game — 5.56 (1 of 30)
Projected Run Total — 4.23 (16 of 30)
Projected Lineup
| # | Player | Bats | wOBA vs. RHP | ISO vs. RHP | HC% vs. RHP | wOBA L14 | FD Position | FD Salary | DK Position | DK Salary |
|---|---|---|---|---|---|---|---|---|---|---|
| 1 | Dustin Pedroia | RIGHT | 0.359 | 0.129 | 33.2% | 0.293 | 2B | $3,200 | 2B | $3,400 |
| 2 | Xander Bogaerts | RIGHT | 0.339 | 0.147 | 29.1% | 0.329 | SS | $3,900 | SS | $4,300 |
| 3 | Mookie Betts | RIGHT | 0.388 | 0.216 | 33.6% | 0.370 | OF | $4,100 | OF | $5,400 |
| 4 | David Ortiz | LEFT | 0.448 | 0.365 | 46.9% | 0.442 | 1B | $3,900 | 1B | $5,500 |
| 5 | Hanley Ramirez | RIGHT | 0.345 | 0.189 | 37.6% | 0.547 | 1B | $4,100 | 1B | $4,900 |
| 6 | Travis Shaw | LEFT | 0.331 | 0.184 | 36.3% | 0.212 | 3B | $3,200 | 1B/3B | $3,300 |
| 7 | Jackie Bradley Jr. | LEFT | 0.387 | 0.269 | 39.5% | 0.386 | OF | $3,600 | OF | $4,400 |
| 8 | Sandy Leon | SWITCH | 0.338 | 0.152 | 34.7% | 0.197 | C | $2,900 | C | $3,100 |
| 9 | Andrew Benintendi | LEFT | 0.433 | 0.274 | 35.3% | 0.428 | OF | $3,100 | OF | $2,700 |
| Team Averages | — | 0.374 | 0.214 | 36.2% | 0.356 | — | — | — | — |
Elite Plays – David Ortiz, Mookie Betts
Secondary Plays – Dustin Pedroia, Xander Bogaerts
Stackability – ORANGE
Tampa Bay
The Rays are another early offense that we can mostly avoid. They have a projected run total of 3.77, which is the fifth-lowest of the day. They have struggled against Porcello this year, and that should continue today.
- Rays Offense (2016)
Team wOBA vs. RHP — 0.316 (15 of 30)
Team wOBA L30 Days — 0.325 (10 of 30)
Team ISO vs. RHP — 0.193 (4 of 30)
Team K% vs. RHP — 24.1% (28 of 30)
Pitches Per PA vs. RHP — 3.89 (13 of 30)
Runs Per Game — 4.24 (21 of 30)
Projected Run Total — 3.77 (26 of 30)
Projected Lineup
| # | Player | Bats | wOBA vs. RHP | ISO vs. RHP | HC% vs. RHP | wOBA L14 | FD Position | FD Salary | DK Position | DK Salary |
|---|---|---|---|---|---|---|---|---|---|---|
| 1 | Logan Forsythe | RIGHT | 0.345 | 0.180 | 36.1% | 0.311 | 2B | $3,000 | 2B | $2,900 |
| 2 | Kevin Kiermaier | LEFT | 0.319 | 0.167 | 30.4% | 0.369 | OF | $3,500 | OF | $3,200 |
| 3 | Evan Longoria | RIGHT | 0.366 | 0.268 | 37.8% | 0.364 | 3B | $3,400 | 3B | $3,600 |
| 4 | Brad Miller | LEFT | 0.346 | 0.270 | 36.1% | 0.326 | SS | $3,600 | 1B/SS | $3,500 |
| 5 | Corey Dickerson | LEFT | 0.329 | 0.263 | 30.4% | 0.453 | OF | $3,100 | OF | $3,300 |
| 6 | Curt Casali | RIGHT | 0.223 | 0.128 | 31.8% | 0.000 | C | $2,200 | C | $2,000 |
| 7 | Alexei Ramirez | RIGHT | 0.240 | 0.089 | 22.4% | 0.294 | SS | $2,300 | SS | $2,000 |
| 8 | Richie Shaffer | RIGHT | 0.270 | 0.217 | 33.3% | 0.212 | 1B | $2,100 | 1B/3B | $2,100 |
| 9 | Mikie Mahtook | RIGHT | 0.200 | 0.053 | 28.9% | 0.157 | OF | $2,000 | OF | $2,000 |
| Team Averages | — | 0.293 | 0.182 | 31.9% | 0.276 | — | — | — | — |
Elite Plays – None
Secondary Plays – None
Stackability – RED
Arizona at Baltimore – 7:05 PM ET
| Arizona | Baltimore | ||||||||
 | Robbie Ray |  | Wade Miley | ||||||
| LEFT | LEFT | ||||||||
| Vegas Moneyline | Vegas Over/Under | ||||||||
| BAL -137 | 9.5 | ||||||||
| Stats | wOBA | HR All. | HC% | K% | Stats | wOBA | HR All. | HC% | K% |
|---|---|---|---|---|---|---|---|---|---|
| SP vs. Left (2016) | 0.293 | 3 | 35.1% | 31.9% | SP vs. Left (2016) | 0.303 | 3 | 37.8% | 20.0% |
| SP vs. Right (2016) | 0.336 | 18 | 37.3% | 27.6% | SP vs. Right (2016) | 0.364 | 21 | 30.9% | 17.4% |
Pitcher Grind Down
| Robbie Ray | ||||||||||
 | FanDuel | DraftKings | ||||||||
| Salary: | $8,200 | Salary: | $8,300 | |||||||
| FPPG: | 32.3 | FPPG: | 16.9 | |||||||
| Pitcher Rating: | 68.3 | Pitcher Rank: | 9 | |||||||
| Statistics | Starts | PitchPS | SIERA | ERA | K% | BB% | SS% | GB% | FB% | HC% |
|---|---|---|---|---|---|---|---|---|---|---|
| L30 Days | 5 | 98.6 | 3.09 | 4.94 | 35.0% | 10.3% | 14.4% | 46.9% | 42.2% | 35.9% |
| 2016 | 30 | 100.4 | 3.46 | 4.66 | 28.7% | 8.6% | 11.8% | 46.0% | 32.4% | 36.8% |
| 2015 | 23 | 98.1 | 4.05 | 3.52 | 21.8% | 9.0% | 9.0% | 43.3% | 34.6% | 35.0% |
Home (2015-16):—ERA: 5.16 — K%: 24.7% — wOBA Allowed: 0.352
Away (2015-16):—ERA: 3.29 — K%: 26.7% — wOBA Allowed: 0.293
Ray has struggled over his last two games, but on the season he has a 3.46 SIERA. The upside is usually there for him as well, as he has an elite 28.7 percent strikeout rate. He gets a tough matchup in theory, but it’s one that the DFS world is starting to see can be exploitable, as the Orioles are not as dominant as they should be against lefties. With that said, Ray is an underdog in a high-total game, which means there’s risk attached. He should be used as a deep tournament play only.
| Wade Miley | ||||||||||
 | FanDuel | DraftKings | ||||||||
| Salary: | $6,100 | Salary: | $5,000 | |||||||
| FPPG: | 22.0 | FPPG: | 10.2 | |||||||
| Pitcher Rating: | 52.9 | Pitcher Rank: | 19 | |||||||
| Statistics | Starts | PitchPS | SIERA | ERA | K% | BB% | SS% | GB% | FB% | HC% |
|---|---|---|---|---|---|---|---|---|---|---|
| L30 Days | 5 | 79.0 | 3.71 | 9.45 | 25.3% | 8.4% | 8.9% | 45.0% | 23.3% | 37.7% |
| 2016 | 28 | 89.5 | 4.42 | 5.65 | 18.0% | 7.4% | 8.7% | 47.6% | 30.6% | 32.3% |
| 2015 | 32 | 99.8 | 4.24 | 4.46 | 17.7% | 7.7% | 8.3% | 48.8% | 30.5% | 24.7% |
Home (2015-16):—ERA: 4.83 — K%: 20.2% — wOBA Allowed: 0.321
Away (2015-16):—ERA: 5.11 — K%: 15.9% — wOBA Allowed: 0.347
Miley is an easy avoid tonight against a Diamondbacks team that is ranked first in wOBA and ISO against left-handed pitching. Miley has been terrible over this last five starts, as he has put up a 9.45 ERA during that span. This is not a matchup to even think about using him. Avoid in all formats.
Batter Grind Down
Arizona
Miley has really struggled against right-handed bats, as he has allowed a .364 wOBA to righties on the year. This bodes well for the Diamondback bats, who have the ninth-highest projected run total on the day. There is a ton of green and blue on the list below, making them a great offense in all formats.
- Diamondbacks Offense (2016)
Team wOBA vs. LHP — 0.350 (1 of 30)
Team wOBA L30 Days — 0.323 (11 of 30)
Team ISO vs. LHP — 0.206 (1 of 30)
Team K% vs. LHP — 23.4% (25 of 30)
Pitches Per PA vs. LHP — 3.83 (19 of 30)
Runs Per Game — 4.66 (10 of 30)
Projected Run Total — 4.53 (9 of 30)
Projected Lineup
| # | Player | Bats | wOBA vs. LHP | ISO vs. LHP | HC% vs. LHP | wOBA L14 | FD Position | FD Salary | DK Position | DK Salary |
|---|---|---|---|---|---|---|---|---|---|---|
| 1 | Jean Segura | RIGHT | 0.327 | 0.163 | 27.3% | 0.418 | 2B | $3,600 | 2B | $5,400 |
| 2 | Chris Owings | RIGHT | 0.359 | 0.194 | 28.4% | 0.275 | SS | $2,500 | OF/SS | $4,000 |
| 3 | Paul Goldschmidt | RIGHT | 0.447 | 0.233 | 43.5% | 0.399 | 1B | $3,400 | 1B | $5,700 |
| 4 | Brandon Drury | RIGHT | 0.313 | 0.180 | 34.7% | 0.506 | OF | $3,600 | 3B/OF | $4,600 |
| 5 | Welington Castillo | RIGHT | 0.372 | 0.255 | 51.8% | 0.287 | C | $3,000 | C | $4,200 |
| 6 | Yasmany Tomas | RIGHT | 0.456 | 0.320 | 46.2% | 0.411 | OF | $2,700 | OF | $4,500 |
| 7 | Mitch Haniger | RIGHT | 0.282 | 0.211 | 50.0% | 0.356 | OF | $2,400 | OF | $4,600 |
| 8 | Kyle Jensen | RIGHT | 0.735 | 0.800 | 44.4% | 0.473 | OF | $2,600 | OF | $3,000 |
| 9 | Phil Gosselin | RIGHT | 0.293 | 0.063 | 24.3% | 0.256 | 2B | $2,000 | 2B/3B | $3,600 |
| Team Averages | — | 0.398 | 0.269 | 39.0% | 0.376 | — | — | — | — |
Elite Plays – Paul Goldschmidt, Jean Segura, Wellington Castillo
Secondary Plays – Brandon Drury, Chris Owings, Yasmany Tomas
Stackability – YELLOW
Baltimore
Ray has allowed a .336 wOBA to righties on the year, which puts some big bats in play for the Orioles, such as Adam Jones and Manny Machado. This game has a huge total, and the Orioles have the second-highest of the entire day. They are stack-worthy in all formats.
- Orioles Offense (2016)
Team wOBA vs. LHP — 0.298 (26 of 30)
Team wOBA L30 Days — 0.312 (17 of 30)
Team ISO vs. LHP — 0.156 (20 of 30)
Team K% vs. LHP — 22.1% (17 of 30)
Pitches Per PA vs. LHP — 3.91 (11 of 30)
Runs Per Game — 4.64 (11 of 30)
Projected Run Total — 4.97 (2 of 30)
Projected Lineup
| # | Player | Bats | wOBA vs. LHP | ISO vs. LHP | HC% vs. LHP | wOBA L14 | FD Position | FD Salary | DK Position | DK Salary |
|---|---|---|---|---|---|---|---|---|---|---|
| 1 | Adam Jones | RIGHT | 0.253 | 0.102 | 31.4% | 0.325 | OF | $3,500 | OF | $3,600 |
| 2 | Chris Davis | LEFT | 0.318 | 0.197 | 33.0% | 0.262 | 1B | $3,400 | 1B | $3,500 |
| 3 | Manny Machado | RIGHT | 0.390 | 0.211 | 37.5% | 0.264 | 3B | $3,800 | 3B/SS | $3,900 |
| 4 | Mark Trumbo | RIGHT | 0.270 | 0.226 | 36.8% | 0.223 | OF | $3,400 | OF | $3,700 |
| 5 | Trey Mancini | RIGHT | 1.006 | 1.500 | 50.0% | 0.503 | 1B | $2,600 | 1B | $2,500 |
| 6 | Jonathan Schoop | RIGHT | 0.282 | 0.159 | 21.8% | 0.278 | 2B | $3,000 | 2B | $2,900 |
| 7 | J.J. Hardy | RIGHT | 0.325 | 0.188 | 44.7% | 0.430 | SS | $2,100 | SS | $3,200 |
| 8 | Drew Stubbs | RIGHT | 0.282 | 0.065 | 32.1% | 0.143 | OF | $2,400 | OF | $2,900 |
| 9 | Caleb Joseph | RIGHT | 0.101 | 0.000 | 15.4% | 0.207 | C | $2,100 | C | $2,100 |
| Team Averages | — | 0.359 | 0.294 | 33.6% | 0.293 | — | — | — | — |