MLB Grind Down: Thursday, May 12th
The RotoGrinders MLB Grind Down will give you an in-depth analysis into the upcoming MLB schedule. This article will break down the numbers for every single game and give you analysis on which trends you can exploit. While matchups are a major factor in daily fantasy baseball, there are plenty of other factors to consider such as injuries, weather, and salaries.
The analysis should point you in the right direction, but it is still up to you to decipher the information and make your own selections. No sport has more variance than baseball. The best choice is not always the right choice but following the trends will win you money over time.
Note: As always, if you want to try a new DFS site, be sure to click through a RotoGrinders link and use our DraftKings promo code and FanDuel promo code to receive the best perks in the industry.
Detroit at Baltimore – 7:05 PM
| Detroit | Baltimore |
 | |  | |
| RIGHT | RIGHT |
| Vegas Moneyline | Vegas Over/Under |
| BAL -165 | 9.5 |
| Stats | wOBA | HR All. | K% | BB% | Stats | wOBA | HR All. | K% | BB% |
| SP vs. Left | 0.384 | 9 | 11.6% | 11.1% | SP vs. Left | 0.324 | 15 | 22.5% | 8.7% |
| SP vs. Right | 0.321 | 8 | 12.0% | 3.0% | SP vs. Right | 0.329 | 9 | 20.3% | 9.0% |
Pitcher Grind Down
| Mike Pelfrey |
 | FanDuel | DraftKings |
| Salary: | $5,200 | Salary: | $4,400 |
| FPPG: | 12.2 | FPPG: | 3.5 |
| Pitcher Rating: | 25.1 | Pitcher Rank: | 15 |
| Statistics | Starts | SIERA | K% | BB% | SS% | GB% | FB% | HH% | HR/9 |
| L14 Days | 2 | 4.28 | 13.6% | 6.8% | 11.0% | 54.3% | 22.9% | 31.4% | 3.00 |
| 2016 | 6 | 5.43 | 10.5% | 10.5% | 8.2% | 49.1% | 26.8% | 38.9% | 1.78 |
| 2015 | 30 | 4.59 | 12.0% | 6.3% | 5.6% | 50.8% | 26.4% | 26.1% | 0.60 |
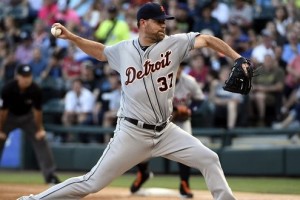
Pelfrey is not the prototypical DFS pitcher. He has one of the lowest strikeout rates of any starter in baseball and he isn’t particularly effective against left or right-handed hitters. He comes into tonight’s game as a sizable underdog on the road against an Orioles’ offense that has the highest team run total on the board. Pelfrey should be avoided in both cash games and tournaments.
| Ubaldo Jimenez |
 | FanDuel | DraftKings |
| Salary: | $7,300 | Salary: | $7,000 |
| FPPG: | 30.3 | FPPG: | 14.5 |
| Pitcher Rating: | 56.0 | Pitcher Rank: | 8 |
| Statistics | Starts | SIERA | K% | BB% | SS% | GB% | FB% | HH% | HR/9 |
| L14 Days | 2 | 4.24 | 15.8% | 8.8% | 7.5% | 62.5% | 25.0% | 19.5% | 0.71 |
| 2016 | 6 | 3.91 | 22.2% | 10.1% | 8.2% | 55.3% | 25.2% | 30.5% | 1.01 |
| 2015 | 32 | 3.93 | 21.2% | 8.6% | 8.0% | 49.1% | 28.8% | 27.0% | 0.98 |
Jimenez has pitched fairly well this season, posting a 3.91 SIERA with a strikeout rate of 22.2%. His biggest struggle has always been his command, as evidenced by his 10.1% walk rate. He doesn’t generate a ton of swings and misses, but he is at least a large favorite tonight against the Tigers. While Detroit does have a stacked offense, they are a right-handed heavy lineup that has the fifth highest strikeout rate against right-handed pitching this season. While I won’t be targeting him tonight, Jimenez does grade out as the eighth best pitching option.
Batter Grind Down
Detroit
The Tigers come into tonight’s game with the fourth highest team run total on the board. They draw a favorable matchup against , who has allowed a .324 wOBA to both left and right-handed hitters over the last two seasons. I’m not a huge proponent of BvP, but , , and all have at least two home runs against Jimenez in the past.
- Tigers Offense (2016)
Team wOBA vs. RHP — 0.323 (12 of 30)
Team ISO vs. RHP — 0.164 (13 of 30)
Team K% vs. RHP — 25.4% (26 of 30)
Runs Per Game — 4.30 (15 of 30)
Projected Run Total — 4.37 (4 of 16)
Projected Lineup
| # | Player | Bats | wOBA vs. RHP | ISO vs. RHP | wOBA L14 | FD Position | FD Salary | DK Position | DK Salary |
| 1 | | RIGHT | 0.330 | 0.135 | 0.292 | 2B | $4,000 | 2B | $5,000 |
| 2 | | RIGHT | 0.353 | 0.229 | 0.212 | OF | $3,300 | OF | $4,400 |
| 3 | | RIGHT | 0.400 | 0.185 | 0.355 | 1B | $3,800 | 1B | $5,100 |
| 4 | | SWITCH | 0.295 | 0.144 | 0.426 | C | $3,000 | 1B | $4,400 |
| 5 | | RIGHT | 0.344 | 0.207 | 0.312 | OF | $2,700 | OF | $4,700 |
| 6 | | RIGHT | 0.318 | 0.169 | 0.574 | 3B | $3,000 | 3B | $4,500 |
| 7 | | RIGHT | 0.259 | 0.080 | 0.155 | C | $2,100 | C | $3,000 |
| 8 | | LEFT | 0.315 | 0.128 | 0.364 | OF | $2,500 | OF | $3,800 |
| 9 | | RIGHT | 0.286 | 0.056 | 0.190 | SS | $2,300 | SS | $3,200 |
| | Team Averages | — | 0.322 | 0.148 | 0.320 | — | — | — | — |
Elite Plays – ,
Secondary Plays – , , , ,
Stackability – Cash & GPP
Baltimore
The Orioles should be the most popular team to stack tonight – in both cash games and tournaments. They have the highest team run total on the board, as they square off against at home. Over the last two seasons, Pelfrey has allowed a .384 wOBA to left-handed hitters and a .321 wOBA to right-handed hitters. The only question is how many Orioles are too many Orioles?
- Orioles Offense (2016)
Team wOBA vs. RHP — 0.361 (2 of 30)
Team ISO vs. RHP — 0.207 (2 of 30)
Team K% vs. RHP — 25.4% (19 of 30)
Runs Per Game — 4.63 (9 of 30)
Projected Run Total — 5.13 (1 of 16)
Projected Lineup
| # | Player | Bats | wOBA vs. RHP | ISO vs. RHP | wOBA L14 | FD Position | FD Salary | DK Position | DK Salary |
| 1 | | RIGHT | 0.293 | 0.105 | 0.329 | OF | $2,900 | OF | $3,700 |
| 2 | | RIGHT | 0.401 | 0.260 | 0.534 | 3B | $4,300 | 3B/SS | $5,400 |
| 3 | | LEFT | 0.412 | 0.348 | 0.396 | 1B | $4,100 | 1B | $5,200 |
| 4 | | RIGHT | 0.337 | 0.201 | 0.345 | OF | $2,600 | OF | $4,400 |
| 5 | | RIGHT | 0.338 | 0.180 | 0.427 | OF | $3,900 | OF | $4,600 |
| 6 | | SWITCH | 0.312 | 0.134 | 0.254 | C | $2,300 | C | $3,500 |
| 7 | | LEFT | 0.337 | 0.232 | 0.374 | 1B | $2,800 | 1B | $3,800 |
| 8 | | RIGHT | 0.355 | 0.244 | 0.344 | 2B | $2,200 | 2B | $4,000 |
| 9 | | LEFT | 0.277 | 0.147 | 0.267 | 2B | $2,100 | 3B | $3,200 |
| | Team Averages | — | 0.340 | 0.206 | 0.363 | — | — | — | — |
Elite Plays – , , ,
Secondary Plays – , ,
Stackability – Cash & GPP
Kansas City at NY Yankees – 7:05 PM
| Kansas City | NY Yankees |
 | |  | |
| RIGHT | RIGHT |
| Vegas Moneyline | Vegas Over/Under |
| NYY -135 | 8.0 |
| Stats | wOBA | HR All. | K% | BB% | Stats | wOBA | HR All. | K% | BB% |
| SP vs. Left | 0.337 | 18 | 25.2% | 8.2% | SP vs. Left | 0.351 | 7 | 18.4% | 8.4% |
| SP vs. Right | 0.330 | 16 | 23.2% | 6.9% | SP vs. Right | 0.290 | 9 | 19.7% | 5.5% |
Pitcher Grind Down
| Ian Kennedy |
 | FanDuel | DraftKings |
| Salary: | $8,000 | Salary: | $8,600 |
| FPPG: | 40.0 | FPPG: | 21.1 |
| Pitcher Rating: | 55.8 | Pitcher Rank: | 9 |
| Statistics | Starts | SIERA | K% | BB% | SS% | GB% | FB% | HH% | HR/9 |
| L14 Days | 2 | 3.75 | 25.0% | 8.3% | 10.1% | 38.7% | 48.4% | 29.0% | 0.00 |
| 2016 | 6 | 4.00 | 23.2% | 8.6% | 10.7% | 35.7% | 45.9% | 32.3% | 0.71 |
| 2015 | 30 | 3.61 | 24.4% | 7.3% | 10.3% | 38.5% | 38.7% | 35.2% | 1.66 |
Kennedy has cooled off a bit since his hot start, but he still has a 4.00 SIERA with a strikeout rate of 23.2% this season. He is a fly ball pitcher that generally fares better in parks that don’t produce a lot of home runs. This is why we should always consider him when he is pitching at home. The Yankees’ offense has come alive in this series and Kennedy has to face them in their own ballpark.
| Nathan Eovaldi |
 | FanDuel | DraftKings |
| Salary: | $8,900 | Salary: | $7,700 |
| FPPG: | 31.3 | FPPG: | 16.3 |
| Pitcher Rating: | 54.3 | Pitcher Rank: | 10 |
| Statistics | Starts | SIERA | K% | BB% | SS% | GB% | FB% | HH% | HR/9 |
| L14 Days | 2 | 3.10 | 16.1% | 5.4% | 9.2% | 67.4% | 14.0% | 34.9% | 1.38 |
| 2016 | 6 | 3.14 | 23.7% | 5.1% | 9.6% | 55.5% | 28.2% | 35.5% | 1.43 |
| 2015 | 27 | 3.99 | 18.0% | 7.3% | 8.7% | 52.2% | 26.0% | 28.0% | 0.58 |
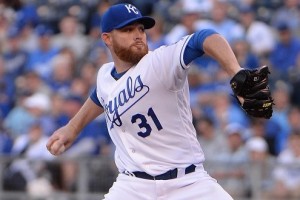
Eovaldi has always had tremendous velocity, but this is the first season that he has been able to turn it into an elite strikeout rate. In his first six starts, he has an elite 3.14 SIERA with a strikeout rate of 23.7%. He draws a decent matchup tonight against the Royals, who are ranked 19th in team wOBA and 25th in team ISO against right-handed pitching this season. While he’s not my favorite play on the board, Eovaldi could make a nice contrarian target in tournaments.
Batter Grind Down
Kansas City
The Royals come into tonight’s game with a mediocre team total of 3.79 runs. They haven’t had the best start offensively this season and they draw a difficult matchup against , who is in the best form of his career. The one split that we can possibly exploit is the .351 wOBA that Eovaldi has allowed to left-handed hitters over the last two seasons.
- Royals Offense (2016)
Team wOBA vs. RHP — 0.308 (19 of 30)
Team ISO vs. RHP — 0.132 (25 of 30)
Team K% vs. RHP — 19.5% (12 of 30)
Runs Per Game — 3.61 (25 of 30)
Projected Run Total — 3.79 (9 of 16)
Projected Lineup
| # | Player | Bats | wOBA vs. RHP | ISO vs. RHP | wOBA L14 | FD Position | FD Salary | DK Position | DK Salary |
| 1 | | RIGHT | 0.268 | 0.061 | 0.333 | SS | $2,200 | SS | $3,300 |
| 2 | | RIGHT | 0.332 | 0.130 | 0.430 | OF | $3,200 | OF | $4,100 |
| 3 | | LEFT | 0.385 | 0.186 | 0.397 | 1B | $3,400 | 1B | $4,300 |
| 4 | | SWITCH | 0.347 | 0.224 | 0.203 | 1B | $2,700 | 1B | $3,200 |
| 5 | | LEFT | 0.345 | 0.161 | 0.337 | OF | $2,600 | OF | $3,500 |
| 6 | | RIGHT | 0.330 | 0.199 | 0.246 | C | $3,300 | C | $3,200 |
| 7 | | RIGHT | 0.243 | 0.095 | 0.182 | 2B | $2,400 | 2B | $2,500 |
| 8 | | RIGHT | 0.323 | 0.186 | 0.308 | 3B | $2,000 | 3B | $2,600 |
| 9 | | LEFT | 0.293 | 0.123 | 0.156 | OF | $2,800 | OF | $3,400 |
| | Team Averages | — | 0.318 | 0.152 | 0.288 | — | — | — | — |
Elite Plays – NONE
Secondary Plays – , ,
Stackability – NONE
NY Yankees
The Yankees haven’t had a ton of success against right-handed pitching early on this season, but they have played well so far in this series. While may boast an above-average strikeout rate, I don’t mind targeting hitters against him in home run friendly ballparks. Over the last two seasons, he has allowed 34 home runs in 36 starts. He has also given up a .330+ wOBA to both left and right-handed hitters.
- Yankees Offense (2016)
Team wOBA vs. RHP — 0.297 (23 of 30)
Team ISO vs. RHP — 0.149 (19 of 30)
Team K% vs. RHP — 19.5% (7 of 30)
Runs Per Game — 3.75 (23 of 30)
Projected Run Total — 4.21 (6 of 16)
Projected Lineup
| # | Player | Bats | wOBA vs. RHP | ISO vs. RHP | wOBA L14 | FD Position | FD Salary | DK Position | DK Salary |
| 1 | | LEFT | 0.333 | 0.160 | 0.350 | OF | $2,900 | OF | $3,800 |
| 2 | | RIGHT | 0.294 | 0.127 | 0.347 | 2B | $3,000 | 2B | $3,100 |
| 3 | | LEFT | 0.333 | 0.207 | 0.360 | C | $3,100 | C | $3,500 |
| 4 | | SWITCH | 0.354 | 0.211 | 0.335 | OF | $2,800 | OF | $3,400 |
| 5 | | LEFT | 0.296 | 0.186 | 0.200 | OF | $2,000 | 1B/OF | $2,900 |
| 6 | | SWITCH | 0.293 | 0.136 | 0.365 | OF | $2,000 | OF | $3,100 |
| 7 | | LEFT | 0.297 | 0.119 | 0.224 | SS | $2,000 | SS | $2,700 |
| 8 | | SWITCH | 0.294 | 0.092 | 0.210 | 3B | $2,200 | 3B | $2,800 |
| 9 | Ben Gamel | LEFT | 0.197 | 0.000 | 0.175 | OF | $3,000 | OF | $2,000 |
| | Team Averages | — | 0.299 | 0.138 | 0.285 | — | — | — | — |
Elite Plays – , ,
Secondary Plays – , ,
Stackability – Cash & GPP
Houston at Boston – 7:10 PM
| Houston | Boston |
 | |  | |
| LEFT | LEFT |
| Vegas Moneyline | Vegas Over/Under |
| BOS -155 | 8.0 |
| Stats | wOBA | HR All. | K% | BB% | Stats | wOBA | HR All. | K% | BB% |
| SP vs. Left | 0.226 | 5 | 23.5% | 3.8% | SP vs. Left | 0.282 | 4 | 21.5% | 3.9% |
| SP vs. Right | 0.280 | 15 | 22.9% | 7.1% | SP vs. Right | 0.281 | 17 | 27.4% | 6.0% |
Pitcher Grind Down
| Dallas Keuchel |
 | FanDuel | DraftKings |
| Salary: | $9,400 | Salary: | $6,900 |
| FPPG: | 28.7 | FPPG: | 13.8 |
| Pitcher Rating: | 56.4 | Pitcher Rank: | 7 |
| Statistics | Starts | SIERA | K% | BB% | SS% | GB% | FB% | HH% | HR/9 |
| L14 Days | 2 | 4.16 | 20.8% | 11.3% | 8.9% | 60.0% | 25.7% | 27.8% | 1.59 |
| 2016 | 7 | 4.01 | 19.9% | 10.0% | 10.9% | 56.5% | 21.4% | 29.9% | 0.61 |
| 2015 | 33 | 2.84 | 23.7% | 5.6% | 10.3% | 61.7% | 19.6% | 21.3% | 0.66 |
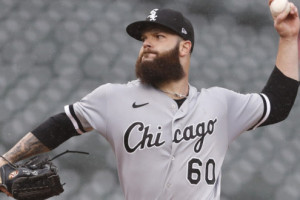
Keuchel has an elite ground ball rate (close to 60%) that allows him to succeed regardless of which ballpark he is pitching in. The issue tonight isn’t Fenway Park, it is his opponent. The Red Sox have scored at least 13 runs in three straight games. They are now ranked second in runs scored per game this season and fifth in team wOBA against left-handed pitching. Keuchel’s price of $6,900 is awfully cheap on DraftKings, but he is at best a deep GPP play in this matchup.
| David Price |
 | FanDuel | DraftKings |
| Salary: | $9,400 | Salary: | $11,100 |
| FPPG: | 34.0 | FPPG: | 16.6 |
| Pitcher Rating: | 79.8 | Pitcher Rank: | 2 |
| Statistics | Starts | SIERA | K% | BB% | SS% | GB% | FB% | HH% | HR/9 |
| L14 Days | 2 | 4.70 | 13.2% | 7.6% | 9.3% | 47.4% | 23.7% | 41.5% | 0.77 |
| 2016 | 7 | 3.02 | 29.0% | 6.6% | 14.1% | 40.0% | 30.9% | 41.2% | 0.87 |
| 2015 | 32 | 3.27 | 25.3% | 5.3% | 11.9% | 40.4% | 36.4% | 28.2% | 0.69 |
Price hasn’t pitched nearly as bad as his 6.75 ERA would suggest. His SIERA is less than half of his ERA, which suggests some positive regression moving forward. The rest of his statistics look decent, as he has a 29% strikeout rate with a 6.6% walk rate this season. He is also generating swings and misses at a higher rate than he did a year ago. While I never love targeting pitchers against the Astros, he is the preferred pitching target in this game. Price is a better target on FanDuel than he is on DraftKings, given the large pricing gap.
Batter Grind Down
Houston
The Astros are ranked sixth in team wOBA against left-handed pitching this season, but they have the fourth lowest team total on the board tonight. They draw a boom or bust matchup against , who should see some positive regression coming his way. You can target the right-handed hitters in this lineup, but they are best suited as GPP plays given their low team total.
- Astros Offense (2016)
Team wOBA vs. LHP — 0.340 (6 of 30)
Team ISO vs. LHP — 0.174 (7 of 30)
Team K% vs. LHP — 23.6% (20 of 30)
Runs Per Game — 4.11 (18 of 30)
Projected Run Total — 3.68 (13 of 16)
Projected Lineup
| # | Player | Bats | wOBA vs. LHP | ISO vs. LHP | wOBA L14 | FD Position | FD Salary | DK Position | DK Salary |
| 1 | | RIGHT | 0.432 | 0.196 | 0.402 | 2B | $4,500 | 2B | $5,300 |
| 2 | | RIGHT | 0.417 | 0.253 | 0.365 | OF | $3,700 | OF | $4,100 |
| 3 | | RIGHT | 0.370 | 0.248 | 0.389 | SS | $4,100 | SS | $4,200 |
| 4 | | LEFT | 0.364 | 0.211 | 0.192 | OF | $3,600 | OF | $3,400 |
| 5 | | RIGHT | 0.271 | 0.250 | 0.229 | 1B | $2,500 | 1B | $3,500 |
| 6 | | SWITCH | 0.373 | 0.212 | 0.386 | 1B | $2,100 | 1B/3B | $2,700 |
| 7 | | RIGHT | 0.298 | 0.123 | 0.279 | OF | $2,600 | OF | $3,300 |
| 8 | | RIGHT | 0.276 | 0.209 | 0.000 | OF | $2,000 | OF | $2,800 |
| 9 | | RIGHT | 0.219 | 0.050 | 0.077 | | | C | $2,000 |
| | Team Averages | — | 0.336 | 0.195 | 0.258 | — | — | — | — |
Elite Plays – NONE
Secondary Plays – , ,
Stackability – GPP
Boston
The Red Sox offense put in a cheat code before their series against the A’s. They scored 40 runs in three games. Basically, if you stacked the Red Sox any of the three nights, you probably made some money in DFS. Boston has the fifth highest team total on the board tonight, but I’m not in love with the matchup. is an extreme ground ball pitcher that has held both left and right-handed hitters under a .280 wOBA over the last two seasons.
- Red Sox Offense (2016)
Team wOBA vs. LHP — 0.347 (5 of 30)
Team ISO vs. LHP — 0.185 (6 of 30)
Team K% vs. LHP — 23.6% (14 of 30)
Runs Per Game — 5.76 (2 of 30)
Projected Run Total — 4.32 (5 of 16)
Projected Lineup
| # | Player | Bats | wOBA vs. LHP | ISO vs. LHP | wOBA L14 | FD Position | FD Salary | DK Position | DK Salary |
| 1 | | RIGHT | 0.343 | 0.186 | 0.272 | OF | $4,400 | OF | $4,900 |
| 2 | | RIGHT | 0.335 | 0.170 | 0.328 | 2B | $3,900 | 2B | $4,300 |
| 3 | | RIGHT | 0.399 | 0.114 | 0.419 | SS | $4,100 | SS | $4,400 |
| 4 | | LEFT | 0.309 | 0.197 | 0.486 | 1B | $3,600 | 1B | $4,400 |
| 5 | | RIGHT | 0.310 | 0.222 | 0.448 | 1B | $3,200 | 1B | $4,400 |
| 6 | Chris Young | RIGHT | 0.419 | 0.253 | 0.425 | OF | $2,100 | OF | $3,200 |
| 7 | | LEFT | 0.371 | 0.261 | 0.379 | 3B | $3,100 | 3B | $4,200 |
| 8 | | RIGHT | 0.275 | 0.071 | 0.312 | C | $2,200 | C | $2,900 |
| 9 | | LEFT | 0.406 | 0.232 | 0.588 | OF | $2,700 | OF | $3,700 |
| | Team Averages | — | 0.352 | 0.190 | 0.406 | — | — | — | — |
Elite Plays – Chris Young (FD)
Secondary Plays – , ,
Stackability – GPP
Philadelphia at Atlanta – 7:10 PM
| Philadelphia | Atlanta |
 | |  | |
| RIGHT | RIGHT |
| Vegas Moneyline | Vegas Over/Under |
| PHI -130 | 7.0 |
| Stats | wOBA | HR All. | K% | BB% | Stats | wOBA | HR All. | K% | BB% |
| SP vs. Left | 0.275 | 5 | 23.9% | 10.0% | SP vs. Left | 0.330 | 0 | 5.9% | 14.7% |
| SP vs. Right | 0.302 | 3 | 30.5% | 6.8% | SP vs. Right | 0.241 | 0 | 9.7% | 12.9% |
Pitcher Grind Down
| Vince Velasquez |
 | FanDuel | DraftKings |
| Salary: | $9,100 | Salary: | $10,900 |
| FPPG: | 44.2 | FPPG: | 25.5 |
| Pitcher Rating: | 78.1 | Pitcher Rank: | 3 |
| Statistics | Starts | SIERA | K% | BB% | SS% | GB% | FB% | HH% | HR/9 |
| L14 Days | 2 | 4.18 | 23.4% | 10.6% | 8.3% | 40.0% | 43.3% | 25.8% | 0.75 |
| 2016 | 6 | 3.07 | 29.9% | 7.5% | 11.7% | 38.2% | 41.6% | 23.1% | 0.72 |
| 2015 | 7 | 3.74 | 25.1% | 9.1% | 10.5% | 31.3% | 46.7% | 27.3% | 0.81 |
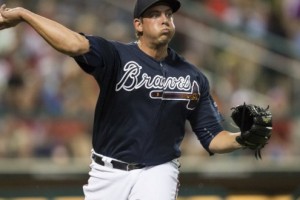
Velasquez hasn’t been as sharp in his last couple of starts, but he still boasts a 3.07 SIERA with a strikeout rate of 29.9% on the season. He draws an excellent matchup tonight against the Braves, who are ranked dead last in team wOBA and team ISO against right-handed pitching this season. Velasquez is in elite play in all league formats tonight, especially considering the fact that this game is being played in the pitcher-friendly Turner Field.
| Aaron Blair |
 | FanDuel | DraftKings |
| Salary: | $5,200 | Salary: | $7,500 |
| FPPG: | 15.3 | FPPG: | 7.2 |
| Pitcher Rating: | 41.3 | Pitcher Rank: | 14 |
| Statistics | Starts | SIERA | K% | BB% | SS% | GB% | FB% | HH% | HR/9 |
| L14 Days | 2 | 6.75 | 9.1% | 15.9% | 5.7% | 36.4% | 30.3% | 24.2% | 0.00 |
| 2016 | 3 | 6.70 | 7.7% | 13.9% | 5.5% | 34.0% | 36.0% | 21.6% | 0.00 |
Blair is making his fourth start of the season. He has not fared well in the first three, posting a 6.70 SIERA with a walk rate that is nearly twice as high as his strikeout rate. While he does draw one of the top matchups on the board, he seems a bit too expensive to use as an SP2. If you are targeting a pitcher in this game, Velasquez is clearly the better choice.
Batter Grind Down
Philadelphia
The Phillies may have the third lowest team total on the board tonight, but we shouldn’t shy away from their matchup against . The sample size is a bit too small to trust his splits, but he has not fared well against left-handed pitchers in his short stint in the majors. The Phillies’ lineup could be a nice source of value tonight, especially if you are looking to roster .
- Phillies Offense (2016)
Team wOBA vs. RHP — 0.281 (28 of 30)
Team ISO vs. RHP — 0.134 (24 of 30)
Team K% vs. RHP — 21.2% (18 of 30)
Runs Per Game — 3.18 (29 of 30)
Projected Run Total — 3.68 (14 of 16)
Projected Lineup
| # | Player | Bats | wOBA vs. RHP | ISO vs. RHP | wOBA L14 | FD Position | FD Salary | DK Position | DK Salary |
| 1 | | LEFT | 0.347 | 0.130 | 0.362 | OF | $3,600 | OF | $3,500 |
| 2 | | RIGHT | 0.294 | 0.076 | 0.235 | 2B | $2,500 | 2B | $2,600 |
| 3 | | RIGHT | 0.340 | 0.194 | 0.236 | 3B | $3,500 | 3B | $3,400 |
| 4 | | LEFT | 0.331 | 0.244 | 0.316 | 1B | $2,100 | 1B | $3,400 |
| 5 | | RIGHT | 0.244 | 0.063 | 0.308 | C | $2,700 | C | $2,500 |
| 6 | | SWITCH | 0.289 | 0.111 | 0.239 | SS | $2,700 | SS | $2,900 |
| 7 | | RIGHT | 0.186 | 0.048 | 0.159 | OF | $2,000 | OF | $3,200 |
| 8 | | RIGHT | 0.086 | 0.000 | 0.315 | P | $9,100 | P | $10,900 |
| 9 | | RIGHT | 0.252 | 0.119 | 0.280 | OF | $2,000 | OF | $2,600 |
| | Team Averages | — | 0.263 | 0.109 | 0.272 | — | — | — | — |
Elite Plays –
Secondary Plays – , ,
Stackability – NONE
Atlanta
- Braves Offense (2016)
Team wOBA vs. RHP — 0.277 (30 of 30)
Team ISO vs. RHP — 0.080 (30 of 30)
Team K% vs. RHP — 21.2% (13 of 30)
Runs Per Game — 3.03 (30 of 30)
Projected Run Total — 3.32 (15 of 16)
The Braves are the worst offense in baseball against right-handed pitching. They average the fewest number of runs per game on the season and they come into tonight’s game with the second lowest team total on the board. The only intriguing hitter in their lineup is . He has a .389 wOBA against right-handed pitching in the last two seasons. He also has a .529 wOBA over the last two weeks of play.
Projected Lineup
| # | Player | Bats | wOBA vs. RHP | ISO vs. RHP | wOBA L14 | FD Position | FD Salary | DK Position | DK Salary |
| 1 | | LEFT | 0.351 | 0.096 | 0.321 | OF | $3,300 | OF | $3,200 |
| 2 | | LEFT | 0.352 | 0.121 | 0.186 | OF | $2,800 | OF | $3,200 |
| 3 | | LEFT | 0.389 | 0.234 | 0.529 | 1B | $3,000 | 1B | $3,700 |
| 4 | | LEFT | 0.318 | 0.162 | 0.391 | 3B | $2,100 | 2B/OF | $2,400 |
| 5 | | LEFT | 0.329 | 0.133 | 0.171 | C | $2,100 | C | $2,600 |
| 6 | | RIGHT | 0.282 | 0.130 | 0.422 | 2B | $2,100 | 3B | $2,000 |
| 7 | | SWITCH | 0.276 | 0.071 | 0.259 | SS | $2,100 | SS | $2,500 |
| 8 | | RIGHT | 0.000 | 0.000 | 0.000 | P | $5,200 | P | $7,500 |
| 9 | | LEFT | 0.318 | 0.137 | 0.384 | OF | $2,300 | OF | $2,900 |
| | Team Averages | — | 0.291 | 0.120 | 0.296 | — | — | — | — |
Elite Plays – NONE
Secondary Plays –
Stackability – NONE
San Diego at Milwaukee – 8:10 PM
| San Diego | Milwaukee |
 | |  | |
| RIGHT | RIGHT |
| Vegas Moneyline | Vegas Over/Under |
| MIL -135 | 8.5 |
| Stats | wOBA | HR All. | K% | BB% | Stats | wOBA | HR All. | K% | BB% |
| SP vs. Left | 0.359 | 24 | 20.2% | 10.9% | SP vs. Left | 0.363 | 16 | 18.7% | 9.8% |
| SP vs. Right | 0.309 | 15 | 27.8% | 8.4% | SP vs. Right | 0.266 | 10 | 20.6% | 8.2% |
Pitcher Grind Down
| James Shields |
 | FanDuel | DraftKings |
| Salary: | $7,900 | Salary: | $8,200 |
| FPPG: | 27.9 | FPPG: | 14.4 |
| Pitcher Rating: | 54.2 | Pitcher Rank: | 11 |
| Statistics | Starts | SIERA | K% | BB% | SS% | GB% | FB% | HH% | HR/9 |
| L14 Days | 2 | 4.06 | 25.0% | 13.5% | 15.2% | 61.3% | 25.8% | 31.3% | 1.50 |
| 2016 | 7 | 4.71 | 18.3% | 10.8% | 10.5% | 45.3% | 34.4% | 30.5% | 1.20 |
| 2015 | 33 | 3.72 | 25.1% | 9.4% | 12.4% | 44.9% | 34.4% | 31.2% | 1.47 |
Shields has let us down one too many times this season. He has been faced with a number of favorable matchups at home and he has yet to churn out a solid fantasy outing. Tonight he heads to Milwaukee to take on the Brewers in the hitter-friendly Miller Park. While Shields does have a decent strikeout rate, he is an underdog in a game that features a total of 8.5 runs.
| Jimmy Nelson |
 | FanDuel | DraftKings |
| Salary: | $7,600 | Salary: | $9,200 |
| FPPG: | 33.1 | FPPG: | 16.6 |
| Pitcher Rating: | 58.1 | Pitcher Rank: | 5 |
| Statistics | Starts | SIERA | K% | BB% | SS% | GB% | FB% | HH% | HR/9 |
| L14 Days | 2 | 4.00 | 21.2% | 7.7% | 6.3% | 41.2% | 32.4% | 38.9% | 1.50 |
| 2016 | 7 | 4.34 | 19.9% | 9.9% | 6.3% | 49.6% | 33.3% | 31.8% | 1.66 |
| 2015 | 30 | 4.09 | 19.7% | 8.6% | 10.0% | 50.6% | 29.4% | 28.9% | 0.91 |
Is day finally upon us? He has shown upside over the last couple of seasons, but he hasn’t been great this season with a 4.34 SIERA and a 19.9% strikeout rate. The good news is that he gets to face the Padres at home. Nelson has great home splits throughout his career and as we know, the Padres are basically the same for a pitcher as Coors Field is to a hitter. San Diego ranked 29th in team wOBA and 28th in strikeout rate against right-handed pitching this season.
Batter Grind Down
San Diego
The Padres have the seventh highest team total on the board tonight. While I do like as a pitching option tonight, that doesn’t mean that we have to automatically fade all hitters against him. Over the last two seasons, Nelson has allowed a .363 wOBA and 16 home runs to hitters from the left side of the plate.
- Padres Offense (2016)
Team wOBA vs. RHP — 0.278 (29 of 30)
Team ISO vs. RHP — 0.122 (28 of 30)
Team K% vs. RHP — 26.0% (28 of 30)
Runs Per Game — 3.74 (24 of 30)
Projected Run Total — 4.04 (7 of 16)
Projected Lineup
| # | Player | Bats | wOBA vs. RHP | ISO vs. RHP | wOBA L14 | FD Position | FD Salary | DK Position | DK Salary |
| 1 | | LEFT | 0.278 | 0.079 | 0.368 | OF | $2,600 | OF | $3,300 |
| 2 | | RIGHT | 0.322 | 0.184 | 0.244 | 1B | $3,300 | 1B | $3,800 |
| 3 | | RIGHT | 0.315 | 0.177 | 0.286 | OF | $3,400 | OF | $4,300 |
| 4 | | LEFT | 0.395 | 0.243 | 0.427 | 1B | $2,300 | 3B | $3,000 |
| 5 | | RIGHT | 0.319 | 0.148 | 0.322 | OF | $2,700 | OF | $3,400 |
| 6 | | RIGHT | 0.267 | 0.097 | 0.239 | SS | $2,800 | SS | $2,900 |
| 7 | | RIGHT | 0.284 | 0.139 | 0.294 | C | $2,100 | C | $3,000 |
| 8 | | RIGHT | 0.280 | 0.165 | 0.128 | 2B | $2,300 | 3B | $2,000 |
| 9 | | RIGHT | 0.174 | 0.031 | 0.442 | P | $7,900 | P | $8,200 |
| | Team Averages | — | 0.293 | 0.140 | 0.306 | — | — | — | — |
Elite Plays – NONE
Secondary Plays – ,
Stackability – NONE
Milwaukee
The Brewers are right up there with the Orioles as one of the top offenses to target tonight. They draw a favorable matchup against , who can’t seem to keep the ball in the park. Over the last two seasons, Shields has given up 39 home runs, 24 of which have come off of the bats of left-handed hitters. The lefties have the edge in this matchup, but the right-handed bats are still in play.
- Brewers Offense (2016)
Team wOBA vs. RHP — 0.326 (10 of 30)
Team ISO vs. RHP — 0.171 (10 of 30)
Team K% vs. RHP — 26.0% (27 of 30)
Runs Per Game — 4.59 (10 of 30)
Projected Run Total — 4.46 (2 of 16)
Projected Lineup
| # | Player | Bats | wOBA vs. RHP | ISO vs. RHP | wOBA L14 | FD Position | FD Salary | DK Position | DK Salary |
| 1 | | RIGHT | 0.293 | 0.153 | 0.316 | OF | $2,600 | OF | $3,100 |
| 2 | | SWITCH | 0.312 | 0.085 | 0.351 | SS | $2,900 | SS | $4,000 |
| 3 | | RIGHT | 0.366 | 0.205 | 0.432 | OF | $4,500 | OF | $4,500 |
| 4 | | RIGHT | 0.348 | 0.153 | 0.473 | C | $2,900 | C | $3,900 |
| 5 | | RIGHT | 0.340 | 0.278 | 0.341 | 1B | $3,200 | 1B | $4,100 |
| 6 | | RIGHT | 0.296 | 0.145 | 0.432 | 3B | $2,100 | 2B/3B | $3,300 |
| 7 | | LEFT | 0.321 | 0.217 | 0.336 | OF | $2,300 | OF | $2,000 |
| 8 | | RIGHT | 0.250 | 0.057 | 0.396 | 3B | $2,000 | 2B/3B | $2,200 |
| 9 | | RIGHT | 0.132 | 0.019 | 0.442 | P | $7,600 | P | $9,200 |
| | Team Averages | — | 0.295 | 0.146 | 0.391 | — | — | — | — |
Elite Plays – , , ,
Secondary Plays – ,
Stackability – Cash & GPP
Jump to Page 1 2
