MLB Grind Down: Tuesday, August 16th
The RotoGrinders MLB Grind Down will give you an in-depth analysis into the upcoming MLB schedule. This article will break down the numbers for every single game and give you analysis on which trends you can exploit. While matchups are a major factor in daily fantasy baseball, there are plenty of other factors to consider such as injuries, weather, and salaries.
The analysis should point you in the right direction, but it is still up to you to decipher the information and make your own selections. No sport has more variance than baseball. The best choice is not always the right choice but following the trends will win you money over time.
Note: As always, if you want to try a new DFS site, be sure to click through a RotoGrinders link and use our DraftKings promo code and FanDuel promo code to receive the best perks in the industry.
Stackability Rating System:
GREEN – One of the top stacks of the day, viable in cash games and GPPs
YELLOW – A viable stack option in most formats, specifically GPPs
ORANGE – There are better stacks out there, but playable in large GPPs
RED – Not a recommended stack for cash games or GPPs
Boston at Baltimore – 7:05 PM ET
| Boston | Baltimore |
 | |  | |
| LEFT | RIGHT |
| Vegas Moneyline | Vegas Over/Under |
| BAL -105 | 10.0 |
| Stats | wOBA | HR All. | HH% | K% | Stats | wOBA | HR All. | HH% | K% |
| SP vs. Left | 0.344 | 8 | 30.2% | 21.7% | SP vs. Left | 0.341 | 15 | 24.3% | 15.7% |
| SP vs. Right | 0.316 | 18 | 30.4% | 17.9% | SP vs. Right | 0.318 | 10 | 28.6% | 15.5% |
Pitcher Grind Down
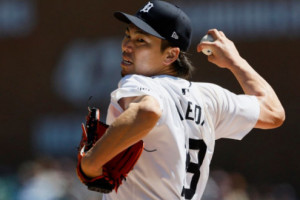
| Eduardo Rodriguez |
 | FanDuel | DraftKings |
| Salary: | $7,100 | Salary: | $5,700 |
| FPPG: | 21.7 | FPPG: | 10.4 |
| Pitcher Rating: | 52.7 | Pitcher Rank: | 20 |
| Statistics | Starts | PitchPS | SIERA | ERA | K% | BB% | SS% | GB% | FB% | HH% |
| L30 Days | 6 | 95.8 | 4.08 | 2.80 | 22.4% | 7.0% | 11.1% | 31.0% | 39.0% | 20.8% |
| 2016 | 12 | 93.0 | 4.66 | 5.43 | 18.9% | 7.9% | 9.6% | 30.9% | 43.1% | 28.3% |
| 2015 | 21 | 95.7 | 4.16 | 3.85 | 18.8% | 7.1% | 7.8% | 43.0% | 33.4% | 31.4% |
Rodriguez seems to be turning a corner. In his last six starts, he has a 2.80 ERA with a strikeout rate of 22.4%. That is a big improvement over his first six starts of the season. Tonight he heads to Baltimore to take on the Orioles in an important series for both teams. Vegas has this game set as a pick ‘em with the over/under set at 10.0 runs. I’d rather take a chance on Rodriguez over , but in a full slate we don’t need to consider either pitcher in this one.
| Yovani Gallardo |
 | FanDuel | DraftKings |
| Salary: | $6,400 | Salary: | $4,200 |
| FPPG: | 19.9 | FPPG: | 8.8 |
| Pitcher Rating: | 37.5 | Pitcher Rank: | 27 |
| Statistics | Starts | PitchPS | SIERA | ERA | K% | BB% | SS% | GB% | FB% | HH% |
| L30 Days | 6 | 98.5 | 5.17 | 4.37 | 17.8% | 11.8% | 7.1% | 43.7% | 39.8% | 27.4% |
| 2016 | 15 | 92.9 | 5.36 | 5.17 | 16.4% | 11.8% | 6.4% | 40.6% | 39.8% | 29.0% |
| 2015 | 33 | 97.8 | 4.59 | 3.42 | 15.3% | 8.6% | 6.5% | 49.3% | 28.7% | 25.5% |
Gallardo has been one of the most hittable pitchers in baseball this season. In 15 starts, he has a 5.36 SIERA with a strikeout rate of 16.4% and a walk rate of 11.8%. He is a fly ball pitcher that isn’t particularly effective against left or right-handed hitters. With a matchup against the Red Sox in a hitter-friendly ballpark, Gallardo is an easy fade in both cash games and tournaments.
Batter Grind Down
Boston
We always love targeting the Red Sox offense at home. Even though they are playing on the road tonight, they are still one of the best offenses in the slate. They are playing in a hitter-friendly ballpark and they draw a favorable matchup against , who has allowed a .341 wOBA to left-handed hitters and a .318 wOBA to right-handed hitters in the last two seasons.
- Red Sox Offense (2016)
Team wOBA vs. RHP — 0.348 (1 of 30)
Team ISO vs. RHP — 0.186 (4 of 30)
Team K% vs. RHP — 18.1% (3 of 30)
Pitches Per PA vs. RHP — 3.93 (6 of 30)
Runs Per Game — 5.52 (1 of 30)
Projected Run Total — 4.97 (7 of 30)
Projected Lineup
| # | Player | Bats | wOBA vs. RHP | ISO vs. RHP | wOBA L14 | FD Position | FD Salary | DK Position | DK Salary |
| 1 | | RIGHT | 0.353 | 0.147 | 0.310 | 2B | $3,800 | 2B | $4,700 |
| 2 | | RIGHT | 0.335 | 0.121 | 0.194 | SS | $3,700 | SS | $3,900 |
| 3 | | RIGHT | 0.364 | 0.209 | 0.422 | OF | $4,400 | OF | $5,600 |
| 4 | | LEFT | 0.425 | 0.338 | 0.255 | 1B | $4,200 | 1B | $5,400 |
| 5 | | LEFT | 0.372 | 0.262 | 0.245 | OF | $3,600 | OF | $4,900 |
| 6 | | LEFT | 0.332 | 0.186 | 0.224 | 3B | $2,600 | 1B/3B | $3,900 |
| 7 | | LEFT | 0.317 | 0.119 | 0.305 | OF | $2,900 | OF | $3,500 |
| 8 | | SWITCH | 0.326 | 0.123 | 0.466 | C | $2,900 | C | $3,800 |
| 9 | | LEFT | 0.418 | 0.091 | 0.381 | OF | $2,900 | OF | $2,800 |
| | Team Averages | — | 0.360 | 0.177 | 0.311 | — | — | — | — |
Elite Plays – ,
Secondary Plays – , ,
Stackability – YELLOW / GREEN
Baltimore
The Orioles have not fared well against left-handed pitching this season, yet they have the fifth highest implied team total on the board. That says a lot about how favorable their matchup is tonight against . In the last two seasons, Rodriguez has allowed a .344 wOBA to left-handed hitters and a .316 wOBA to right-handed hitters.
- Orioles Offense (2016)
Team wOBA vs. LHP — 0.299 (26 of 30)
Team ISO vs. LHP — 0.154 (21 of 30)
Team K% vs. LHP — 21.5% (17 of 30)
Pitches Per PA vs. LHP — 3.89 (11 of 30)
Runs Per Game — 4.66 (9 of 30)
Projected Run Total — 5.03 (5 of 30)
Projected Lineup
| # | Player | Bats | wOBA vs. LHP | ISO vs. LHP | wOBA L14 | FD Position | FD Salary | DK Position | DK Salary |
| 1 | | RIGHT | 0.288 | 0.148 | 0.377 | OF | $3,500 | OF | $4,300 |
| 2 | | RIGHT | 0.281 | 0.124 | 0.288 | 2B | $3,100 | 2B | $3,400 |
| 3 | | RIGHT | 0.353 | 0.186 | 0.358 | 3B | $4,000 | 3B/SS | $5,000 |
| 4 | | RIGHT | 0.334 | 0.253 | 0.230 | OF | $3,700 | OF | $4,400 |
| 5 | | RIGHT | 0.339 | 0.215 | 0.255 | OF | $2,700 | 1B/2B | $4,200 |
| 6 | | LEFT | 0.341 | 0.199 | 0.340 | 1B | $3,700 | 1B | $3,900 |
| 7 | | SWITCH | 0.280 | 0.127 | 0.242 | C | $2,800 | C | $3,100 |
| 8 | | RIGHT | 0.259 | 0.095 | 0.306 | SS | $2,500 | SS | $3,300 |
| 9 | | RIGHT | 0.297 | 0.117 | 0.173 | OF | $2,300 | OF | $2,600 |
| | Team Averages | — | 0.308 | 0.163 | 0.285 | — | — | — | — |
Elite Plays – , Mark Trumbp
Secondary Plays – , ,
Stackability – YELLOW / GREEN
LA Dodgers at Philadelphia – 7:05 PM ET
| LA Dodgers | Philadelphia |
 | |  | |
| RIGHT | RIGHT |
| Vegas Moneyline | Vegas Over/Under |
| LAD -160 | 8.5 |
| Stats | wOBA | HR All. | HH% | K% | Stats | wOBA | HR All. | HH% | K% |
| SP vs. Left | 0.292 | 8 | 33.9% | 20.2% | SP vs. Left | 0.324 | 11 | 30.1% | 25.1% |
| SP vs. Right | 0.264 | 7 | 25.0% | 28.3% | SP vs. Right | 0.320 | 8 | 30.1% | 27.2% |
Pitcher Grind Down
| Kenta Maeda |
 | FanDuel | DraftKings |
| Salary: | $8,700 | Salary: | $9,500 |
| FPPG: | 29.5 | FPPG: | 15.8 |
| Pitcher Rating: | 76.2 | Pitcher Rank: | 7 |
| Statistics | Starts | PitchPS | SIERA | ERA | K% | BB% | SS% | GB% | FB% | HH% |
| L30 Days | 5 | 93.8 | 3.84 | 4.67 | 20.0% | 2.7% | 8.7% | 42.2% | 39.8% | 31.3% |
| 2016 | 23 | 93.1 | 3.68 | 3.31 | 24.5% | 6.5% | 11.5% | 43.2% | 38.1% | 29.2% |
Maeda has pitched well in his first season in the majors, posting a 3.68 SIERA with a strikeout rate of 24.5%. Surprisingly, he has actually pitched better on the road than he has at home. He draws a favorable matchup tonight against the Phillies, who are ranked 17th or worse in team wOBA, team ISO, and team K% against right-handed pitching. I have him ranked as the seventh best pitching option available tonight, which makes him a nice value at his price point.
| Vince Velasquez |
 | FanDuel | DraftKings |
| Salary: | $8,200 | Salary: | $8,000 |
| FPPG: | 31.9 | FPPG: | 16.8 |
| Pitcher Rating: | 57.7 | Pitcher Rank: | 13 |
| Statistics | Starts | PitchPS | SIERA | ERA | K% | BB% | SS% | GB% | FB% | HH% |
| L30 Days | 5 | 99.2 | 4.76 | 5.65 | 21.8% | 12.1% | 9.1% | 34.2% | 39.2% | 42.7% |
| 2016 | 20 | 90.1 | 3.80 | 3.94 | 26.6% | 9.1% | 11.0% | 35.5% | 40.4% | 31.5% |
Velasquez comes into tonight’s game in bad form, posting a 5.65 ERA with a walk rate of 12.1% in his last five starts. While he can come out and have a big outing at any time, I’d like to see him string together a couple of quality starts before going back to the well. He is a large underdog tonight at home against a Dodgers’ offense that continues to climb the rankings in team wOBA against right-handed pitching. I see Velasquez as a deep GPP flier tonight.
Batter Grind Down
LA Dodgers
The Dodgers are ranked above the major league average in both team wOBA and team ISO against right-handed pitching. This isn’t the best matchup on the board, but Citizens Bank Park is a sneaky hitter’s park. The Dodgers have the eighth highest implied team total on the board, as they square off against . Over the last two seasons, he has allowed a .320+ wOBA to both left and right-handed hitters.
- Dodgers Offense (2016)
Team wOBA vs. RHP — 0.323 (10 of 30)
Team ISO vs. RHP — 0.167 (14 of 30)
Team K% vs. RHP — 21.0% (16 of 30)
Pitches Per PA vs. RHP — 3.81 (25 of 30)
Runs Per Game — 4.42 (17 of 30)
Projected Run Total — 4.60 (8 of 30)
Projected Lineup
| # | Player | Bats | wOBA vs. RHP | ISO vs. RHP | wOBA L14 | FD Position | FD Salary | DK Position | DK Salary |
| 1 | | LEFT | 0.306 | 0.136 | 0.289 | 2B | $2,800 | 2B | $3,500 |
| 2 | | LEFT | 0.404 | 0.238 | 0.413 | SS | $3,800 | SS | $4,800 |
| 3 | | RIGHT | 0.384 | 0.227 | 0.416 | 3B | $3,400 | 3B | $5,100 |
| 4 | | LEFT | 0.358 | 0.185 | 0.141 | OF | $3,200 | OF | $3,700 |
| 5 | | LEFT | 0.357 | 0.195 | 0.422 | 1B | $3,100 | 1B | $4,700 |
| 6 | | SWITCH | 0.339 | 0.219 | 0.588 | C | $3,200 | C | $4,600 |
| 7 | | LEFT | 0.359 | 0.238 | 0.481 | OF | $3,500 | OF | $4,500 |
| 8 | | RIGHT | 0.324 | 0.128 | 0.347 | 2B | $3,000 | 2B/OF | $3,600 |
| 9 | | RIGHT | 0.173 | 0.125 | 0.386 | P | $8,700 | P | $9,500 |
| | Team Averages | — | 0.334 | 0.188 | 0.387 | — | — | — | — |
Elite Plays – NONE
Secondary Plays – , , , ,
Stackability – YELLOW
Philadelphia
The Phillies come into tonight’s game with a below-average implied run total. They draw a difficult matchup against , who has held both left and right-handed hitters under a .295 wOBA this season. We have a full slate on tap tonight and there are better matchups to exploit than this one.
- Phillies Offense (2016)
Team wOBA vs. RHP — 0.299 (28 of 30)
Team ISO vs. RHP — 0.158 (17 of 30)
Team K% vs. RHP — 21.5% (19 of 30)
Pitches Per PA vs. RHP — 3.76 (28 of 30)
Runs Per Game — 3.82 (28 of 30)
Projected Run Total — 3.90 (20 of 30)
Projected Lineup
| # | Player | Bats | wOBA vs. RHP | ISO vs. RHP | wOBA L14 | FD Position | FD Salary | DK Position | DK Salary |
| 1 | | SWITCH | 0.302 | 0.090 | 0.335 | 2B | $3,100 | 2B | $3,900 |
| 2 | | RIGHT | 0.370 | 0.248 | 0.320 | OF | $2,900 | OF | $2,900 |
| 3 | | RIGHT | 0.325 | 0.192 | 0.262 | 3B | $3,100 | 3B | $3,500 |
| 4 | | LEFT | 0.327 | 0.247 | 0.647 | 1B | $2,800 | 1B | $3,700 |
| 5 | | RIGHT | 0.296 | 0.148 | 0.422 | C | $3,000 | C | $4,000 |
| 6 | | LEFT | 0.351 | 0.148 | 0.348 | OF | $2,900 | OF | $4,500 |
| 7 | | SWITCH | 0.289 | 0.126 | 0.286 | SS | $2,200 | SS | $3,900 |
| 8 | | RIGHT | 0.279 | 0.146 | 0.418 | OF | $2,600 | OF | $2,700 |
| 9 | | RIGHT | 0.162 | 0.000 | 0.000 | P | $8,200 | P | $8,000 |
| | Team Averages | — | 0.300 | 0.149 | 0.338 | — | — | — | — |
Elite Plays – NONE
Secondary Plays – NONE
Stackability – RED
Toronto at NY Yankees – 7:05 PM ET
| Toronto | NY Yankees |
 | |  | |
| RIGHT | RIGHT |
| Vegas Moneyline | Vegas Over/Under |
| TOR -110 | 8.5 |
| Stats | wOBA | HR All. | HH% | K% | Stats | wOBA | HR All. | HH% | K% |
| SP vs. Left | 0.277 | 23 | 28.0% | 19.5% | SP vs. Left | 0.328 | 16 | 31.0% | 25.0% |
| SP vs. Right | 0.267 | 16 | 30.6% | 21.2% | SP vs. Right | 0.332 | 26 | 31.2% | 24.8% |
Pitcher Grind Down
| Marco Estrada |
 | FanDuel | DraftKings |
| Salary: | $8,600 | Salary: | $9,700 |
| FPPG: | 35.3 | FPPG: | 19.7 |
| Pitcher Rating: | 54.0 | Pitcher Rank: | 18 |
| Statistics | Starts | PitchPS | SIERA | ERA | K% | BB% | SS% | GB% | FB% | HH% |
| L30 Days | 4 | 102.3 | 4.22 | 3.00 | 20.8% | 6.6% | 11.5% | 34.2% | 41.1% | 25.7% |
| 2016 | 20 | 100.9 | 4.22 | 2.95 | 23.4% | 8.9% | 10.8% | 34.3% | 47.2% | 32.0% |
| 2015 | 28 | 104.0 | 4.64 | 3.13 | 18.1% | 7.6% | 9.9% | 32.2% | 52.3% | 27.4% |
Estrada continues to be a top candidate for regression. His SIERA is a full run higher than his ERA this season. The good news is that he does boast an above-average strikeout rate of 23.4% on the season. He draws a decent matchup tonight against the Yankees, although he has to face them in a hitter-friendly ballpark. My biggest concern here is the 23 home runs that Estrada has allowed to left-handed hitters in the last two seasons. We know that Yankee Stadium favors left-handed power bats with that short porch in right field.
| Michael Pineda |
 | FanDuel | DraftKings |
| Salary: | $8,400 | Salary: | $7,900 |
| FPPG: | 30.4 | FPPG: | 15.9 |
| Pitcher Rating: | 77.1 | Pitcher Rank: | 6 |
| Statistics | Starts | PitchPS | SIERA | ERA | K% | BB% | SS% | GB% | FB% | HH% |
| L30 Days | 6 | 98.0 | 3.66 | 4.25 | 25.7% | 7.9% | 14.3% | 47.0% | 34.0% | 40.0% |
| 2016 | 23 | 97.3 | 3.42 | 5.07 | 26.8% | 6.7% | 14.0% | 44.7% | 33.4% | 32.4% |
| 2015 | 27 | 94.4 | 3.09 | 4.37 | 23.4% | 3.1% | 11.9% | 48.2% | 29.9% | 30.1% |
Pineda has the exact opposite issue as . His SIERA is a full run and a half lower than his ERA, which suggests some positive regression moving forward. In 23 starts this season, he has a 3.42 SIERA with a strikeout rate of 26.8%. He is generating an elite swinging strike rate of 26.8% and I’m higher on his fantasy appeal than most. Even in a difficult matchup against the Blue Jays, I see Pineda as a sneaky GPP play and potentially an SP2 on DraftKings.
Batter Grind Down
Toronto
The Blue Jays aren’t as good on the road as they are at home, but they are ranked ninth in team wOBA and third in team ISO against right-handed pitching. Even though we expect numbers to improve the rest of the way, he has allowed a .328+ wOBA to both left and right-handed hitters in the last two seasons. I’m not going to have a lot of exposure to Toronto, but they are certainly in play tonight.
- Blue Jays Offense (2016)
Team wOBA vs. RHP — 0.325 (9 of 30)
Team ISO vs. RHP — 0.188 (3 of 30)
Team K% vs. RHP — 22.8% (25 of 30)
Pitches Per PA vs. RHP — 4.06 (1 of 30)
Runs Per Game — 4.81 (6 of 30)
Projected Run Total — 4.31 (14 of 30)
Projected Lineup
| # | Player | Bats | wOBA vs. RHP | ISO vs. RHP | wOBA L14 | FD Position | FD Salary | DK Position | DK Salary |
| 1 | | RIGHT | 0.369 | 0.195 | 0.377 | 2B | $3,500 | 2B | $4,600 |
| 2 | | RIGHT | 0.395 | 0.268 | 0.332 | 3B | $4,300 | 3B | $4,600 |
| 3 | | RIGHT | 0.391 | 0.285 | 0.386 | 1B | $4,200 | 1B | $4,700 |
| 4 | | LEFT | 0.338 | 0.191 | 0.230 | OF | $3,400 | OF | $3,600 |
| 5 | | RIGHT | 0.319 | 0.175 | 0.355 | SS | $3,100 | SS | $4,400 |
| 6 | | RIGHT | 0.315 | 0.177 | 0.342 | C | $2,800 | C | $3,400 |
| 7 | | SWITCH | 0.328 | 0.226 | 0.228 | 1B | $3,100 | 1B | $3,500 |
| 8 | | RIGHT | 0.288 | 0.140 | 0.162 | OF | $2,800 | OF | $3,100 |
| 9 | | LEFT | 0.233 | 0.085 | 0.138 | OF | $2,100 | OF | $2,500 |
| | Team Averages | — | 0.331 | 0.194 | 0.283 | — | — | — | — |
Elite Plays – NONE
Secondary Plays – , , ,
Stackability – ORANGE / YELLOW
NY Yankees
The Yankees have been awful offensively this season. As crazy as it sounds, their pitching has been what has kept them afloat. They draw a mediocre matchup tonight against . While he has held both left and right-handed hitters under a .280 wOBA, he has allowed 39 home runs over the last two seasons, 23 of which came from left-handed hitters.
- Yankees Offense (2016)
Team wOBA vs. RHP — 0.306 (23 of 30)
Team ISO vs. RHP — 0.152 (22 of 30)
Team K% vs. RHP — 19.7% (8 of 30)
Pitches Per PA vs. RHP — 3.82 (23 of 30)
Runs Per Game — 4.16 (22 of 30)
Projected Run Total — 4.19 (17 of 30)
Projected Lineup
| # | Player | Bats | wOBA vs. RHP | ISO vs. RHP | wOBA L14 | FD Position | FD Salary | DK Position | DK Salary |
| 1 | | LEFT | 0.328 | 0.141 | 0.379 | OF | $3,300 | OF | $4,000 |
| 2 | | LEFT | 0.309 | 0.101 | 0.329 | OF | $3,000 | OF | $3,500 |
| 3 | | SWITCH | 0.345 | 0.262 | 0.381 | 1B | $2,800 | 1B | $3,100 |
| 4 | | LEFT | 0.324 | 0.198 | 0.208 | C | $2,900 | C | $3,000 |
| 5 | | LEFT | 0.313 | 0.149 | 0.348 | SS | $2,800 | SS | $3,500 |
| 6 | | RIGHT | 0.296 | 0.136 | 0.367 | 2B | $2,700 | 2B | $3,500 |
| 7 | | SWITCH | 0.306 | 0.122 | 0.260 | 3B | $2,500 | 3B | $3,000 |
| 8 | | RIGHT | 0.390 | 0.231 | 0.355 | C | $2,600 | C | $2,500 |
| 9 | | RIGHT | 0.724 | 0.750 | 0.724 | OF | $2,900 | OF | $2,700 |
| | Team Averages | — | 0.371 | 0.232 | 0.372 | — | — | — | — |
Elite Plays – NONE
Secondary Plays – , , ,
Stackability – ORANGE / YELLOW
Kansas City at Detroit – 7:08 PM ET
| Kansas City | Detroit |
 | |  | |
| LEFT | RIGHT |
| Vegas Moneyline | Vegas Over/Under |
| DET -135 | 7.0 |
| Stats | wOBA | HR All. | HH% | K% | Stats | wOBA | HR All. | HH% | K% |
| SP vs. Left | 0.241 | 1 | 26.5% | 27.3% | SP vs. Left | 0.270 | 16 | 22.7% | 24.8% |
| SP vs. Right | 0.319 | 28 | 32.7% | 21.1% | SP vs. Right | 0.287 | 16 | 27.0% | 23.2% |
Pitcher Grind Down
| Danny Duffy |
 | FanDuel | DraftKings |
| Salary: | $9,600 | Salary: | $12,700 |
| FPPG: | 23.6 | FPPG: | 13.2 |
| Pitcher Rating: | 65.8 | Pitcher Rank: | 11 |
| Statistics | Starts | PitchPS | SIERA | ERA | K% | BB% | SS% | GB% | FB% | HH% |
| L30 Days | 6 | 100.8 | 3.38 | 2.32 | 26.8% | 4.9% | 13.4% | 33.6% | 45.5% | 40.0% |
| 2016 | 17 | 106.6 | 3.18 | 2.82 | 28.1% | 5.1% | 13.8% | 34.8% | 44.7% | 34.3% |
| 2015 | 24 | 98.3 | 4.63 | 4.08 | 17.4% | 9.0% | 8.4% | 38.8% | 36.5% | 29.5% |
Duffy is coming off of his first complete game of his career. He was dominate against the White Sox, holding them to a single run while striking out six batters. He draws a tough test tonight against the Tigers in Detroit, who will likely throw nine right-handed batters at him tonight. While that’s never ideal for a left-handed pitcher, I do like the fact that Duffy has a 32.7% strikeout rate against righties in the last two seasons. There is still plenty of upside for Duffy tonight, I’m just not sure I want to pay that hefty price tag for him.
| Justin Verlander |
 | FanDuel | DraftKings |
| Salary: | $10,000 | Salary: | $12,900 |
| FPPG: | 39.7 | FPPG: | 21.9 |
| Pitcher Rating: | 85.4 | Pitcher Rank: | 3 |
| Statistics | Starts | PitchPS | SIERA | ERA | K% | BB% | SS% | GB% | FB% | HH% |
| L30 Days | 6 | 112.0 | 3.11 | 1.67 | 29.9% | 6.0% | 12.7% | 35.6% | 42.3% | 21.0% |
| 2016 | 24 | 107.4 | 3.59 | 3.42 | 26.3% | 6.7% | 11.8% | 35.7% | 45.0% | 26.5% |
| 2015 | 20 | 107.5 | 3.95 | 3.37 | 21.1% | 6.0% | 10.0% | 34.6% | 45.5% | 23.0% |
Verlander comes into tonight’s game in great form, posting a 3.11 SIERA with a strikeout rate of 29.9% and a walk rate of only 6%. He doesn’t allow a lot of hard contact and he has been dominant at Comerica Park throughout his career. I’m a big fan of his matchup tonight against the Royals, who are ranked 26th in team wOBA and 30th in team ISO against right-handed pitching this season. Not only that, but the Royals average the fourth fewest pitches per plate appearance. If Verlander is pitching well, there is a decent chance that he gets the complete game.
Batter Grind Down
Kansas City
The Royals come into tonight’s game with the second lowest team total on the board. They draw a difficult matchup against and they have to face him on the road in a ballpark that he has been dominant in for years. Over the last two seasons, Verlander has held both left and right-handed hitters under a .290 wOBA.
- Royals Offense (2016)
Team wOBA vs. RHP — 0.301 (26 of 30)
Team ISO vs. RHP — 0.126 (30 of 30)
Team K% vs. RHP — 20.3% (11 of 30)
Pitches Per PA vs. RHP — 3.76 (27 of 30)
Runs Per Game — 3.91 (27 of 30)
Projected Run Total — 3.29 (29 of 30)
Projected Lineup
| # | Player | Bats | wOBA vs. RHP | ISO vs. RHP | wOBA L14 | FD Position | FD Salary | DK Position | DK Salary |
| 1 | | RIGHT | 0.311 | 0.135 | 0.370 | OF | $3,100 | OF | $3,600 |
| 2 | | RIGHT | 0.324 | 0.157 | 0.362 | 3B | $3,100 | 3B | $3,000 |
| 3 | | RIGHT | 0.311 | 0.116 | 0.180 | OF | $3,000 | OF | $2,800 |
| 4 | | LEFT | 0.362 | 0.170 | 0.263 | 1B | $3,000 | 1B | $2,700 |
| 5 | | SWITCH | 0.349 | 0.211 | 0.333 | 1B | $2,800 | 1B/OF | $2,500 |
| 6 | | RIGHT | 0.326 | 0.194 | 0.252 | C | $3,200 | C | $2,600 |
| 7 | | LEFT | 0.326 | 0.157 | 0.272 | OF | $2,800 | OF | $2,700 |
| 8 | | RIGHT | 0.270 | 0.062 | 0.241 | SS | $2,700 | SS | $2,900 |
| 9 | | SWITCH | 0.200 | 0.083 | 0.153 | 2B | $2,400 | 2B | $2,000 |
| | Team Averages | — | 0.309 | 0.143 | 0.270 | — | — | — | — |
Elite Plays – NONE
Secondary Plays – NONE
Stackability – RED
Detroit
The Tigers may be favored tonight, but they still have the seventh lowest implied team total on the board. They draw a difficult matchup against , who continues to impress this season. With the over/under set at only 7.0 runs, this is an easy game to fade both offenses. However, Duffy has allowed 28 home runs to righties in the last two seasons if you want to look at the Tigers for one-offs in tournaments.
- Tigers Offense (2016)
Team wOBA vs. LHP — 0.328 (11 of 30)
Team ISO vs. LHP — 0.165 (13 of 30)
Team K% vs. LHP — 20.8% (14 of 30)
Pitches Per PA vs. LHP — 3.84 (16 of 30)
Runs Per Game — 4.70 (8 of 30)
Projected Run Total — 3.71 (24 of 30)
Projected Lineup
| # | Player | Bats | wOBA vs. LHP | ISO vs. LHP | wOBA L14 | FD Position | FD Salary | DK Position | DK Salary |
| 1 | | RIGHT | 0.368 | 0.188 | 0.376 | 2B | $3,600 | 2B | $3,900 |
| 2 | | RIGHT | 0.334 | 0.054 | 0.318 | 3B | $2,300 | 1B/3B | $2,000 |
| 3 | | RIGHT | 0.387 | 0.192 | 0.519 | 1B | $3,600 | 1B | $3,800 |
| 4 | | SWITCH | 0.367 | 0.153 | 0.414 | C | $3,400 | 1B | $3,100 |
| 5 | | RIGHT | 0.394 | 0.280 | 0.449 | OF | $3,500 | OF | $3,700 |
| 6 | | RIGHT | 0.263 | 0.123 | 0.213 | OF | $2,500 | OF | $2,200 |
| 7 | | RIGHT | 0.269 | 0.078 | 0.316 | 2B | $2,200 | OF | $2,000 |
| 8 | | RIGHT | 0.381 | 0.265 | 0.357 | C | $2,400 | C | $2,500 |
| 9 | | RIGHT | 0.326 | 0.056 | 0.392 | SS | $2,000 | SS | $2,000 |
| | Team Averages | — | 0.343 | 0.154 | 0.373 | — | — | — | — |
Elite Plays – NONE
Secondary Plays – , ,
Stackability – ORANGE
Chicago White Sox at Cleveland – 7:10 PM ET
| Chicago White Sox | Cleveland |
 | |  | |
| LEFT | RIGHT |
| Vegas Moneyline | Vegas Over/Under |
| CLE -180 | 7.5 |
| Stats | wOBA | HR All. | HH% | K% | Stats | wOBA | HR All. | HH% | K% |
| SP vs. Left | 0.270 | 7 | 29.4% | 21.5% | SP vs. Left | 0.304 | 17 | 27.0% | 24.9% |
| SP vs. Right | 0.308 | 24 | 29.9% | 21.1% | SP vs. Right | 0.242 | 18 | 27.2% | 28.6% |
Pitcher Grind Down
| Jose Quintana |
 | FanDuel | DraftKings |
| Salary: | $8,700 | Salary: | $9,200 |
| FPPG: | 35.6 | FPPG: | 19.4 |
| Pitcher Rating: | 55.4 | Pitcher Rank: | 17 |
| Statistics | Starts | PitchPS | SIERA | ERA | K% | BB% | SS% | GB% | FB% | HH% |
| L30 Days | 5 | 105.6 | 4.07 | 1.59 | 20.6% | 5.2% | 6.4% | 37.8% | 42.9% | 32.0% |
| 2016 | 23 | 103.6 | 3.94 | 2.85 | 22.1% | 5.8% | 7.7% | 39.1% | 41.2% | 32.9% |
| 2015 | 32 | 105.4 | 3.62 | 3.36 | 20.5% | 5.1% | 9.2% | 47.1% | 29.7% | 27.7% |
Quintana’s 2.85 ERA may not hold up the rest of the way, but a 3.94 SIERA with a strikeout rate of 22.1% is nothing to complain about. Unfortunately, he comes into tonight’s game as a sizable underdog against the Indians, who have their ace () on the mound. The Indians may not be the best offensive team against left-handed pitching, but they are certainly capable of scoring a few runs against Quintana. There are better options at similar price points tonight.
| Corey Kluber |
 | FanDuel | DraftKings |
| Salary: | $10,700 | Salary: | $11,400 |
| FPPG: | 39.4 | FPPG: | 22.5 |
| Pitcher Rating: | 91.4 | Pitcher Rank: | 1 |
| Statistics | Starts | PitchPS | SIERA | ERA | K% | BB% | SS% | GB% | FB% | HH% |
| L30 Days | 5 | 97.2 | 3.61 | 1.80 | 25.8% | 6.8% | 14.0% | 39.8% | 38.6% | 26.1% |
| 2016 | 23 | 98.0 | 3.46 | 3.21 | 25.2% | 5.8% | 12.2% | 46.5% | 33.5% | 27.2% |
| 2015 | 32 | 102.3 | 2.98 | 3.49 | 27.7% | 5.1% | 12.9% | 42.4% | 35.9% | 27.0% |
Kluber has been sharp in his last five starts, posting a 1.80 ERA with a strikeout rate of 25.8% and a walk rate of 6.8%. He comes into tonight’s game as a huge favorite at home against the White Sox. Any way you slice it, this is a favorable matchup for Kluber. On the season, Chicago is ranked 23rd in team wOBA and 24th in team ISO against right-handed pitching. The upside is there for Kluber and his price is affordable on both FanDuel and DraftKings, especially if you pair him with a cheaper SP2 on DK.
Batter Grind Down
Chicago White Sox
The White Sox have the lowest projection of the 30 teams in action tonight. In addition to an elite strikeout rate, has held both left and right-handed hitters under a .305 wOBA in the last two seasons. The White Sox can be avoided in both cash games and tournaments.
- White Sox Offense (2016)
Team wOBA vs. RHP — 0.306 (23 of 30)
Team ISO vs. RHP — 0.144 (24 of 30)
Team K% vs. RHP — 20.7% (15 of 30)
Pitches Per PA vs. RHP — 3.85 (18 of 30)
Runs Per Game — 4.00 (26 of 30)
Projected Run Total — 3.29 (30 of 30)
Projected Lineup
| # | Player | Bats | wOBA vs. RHP | ISO vs. RHP | wOBA L14 | FD Position | FD Salary | DK Position | DK Salary |
| 1 | | LEFT | 0.352 | 0.164 | 0.327 | OF | $3,000 | OF | $3,500 |
| 2 | | RIGHT | 0.274 | 0.129 | 0.265 | SS | $3,100 | 2B/SS | $3,100 |
| 3 | | SWITCH | 0.325 | 0.133 | 0.246 | OF | $2,900 | OF | $2,800 |
| 4 | | RIGHT | 0.369 | 0.208 | 0.440 | 1B | $3,100 | 1B | $4,000 |
| 5 | | LEFT | 0.348 | 0.159 | 0.358 | 1B | $2,700 | 1B | $2,800 |
| 6 | | RIGHT | 0.325 | 0.218 | 0.289 | 3B | $3,100 | 3B | $3,000 |
| 7 | | RIGHT | 0.277 | 0.112 | 0.286 | SS | $2,700 | SS | $3,300 |
| 8 | | SWITCH | 0.258 | 0.096 | 0.222 | C | $2,200 | C | $2,200 |
| 9 | | LEFT | 0.264 | 0.099 | 0.302 | OF | $2,000 | OF | $2,300 |
| | Team Averages | — | 0.310 | 0.146 | 0.304 | — | — | — | — |
Elite Plays – NONE
Secondary Plays – NONE
Stackability – RED
Cleveland
The Indians are large favorites tonight at home, but their matchup against is less than ideal. He has been tough on hitters from both sides of the plate, although he has allowed 24 home runs to right-handed hitters in the last two seasons. I hope the Indians give some run support here, but I won’t be actively targeting any of their hitters.
- Indians Offense (2016)
Team wOBA vs. LHP — 0.328 (11 of 30)
Team ISO vs. LHP — 0.155 (18 of 30)
Team K% vs. LHP — 21.3% (16 of 30)
Pitches Per PA vs. LHP — 3.92 (6 of 30)
Runs Per Game — 5.11 (3 of 30)
Projected Run Total — 4.21 (16 of 30)
Projected Lineup
| # | Player | Bats | wOBA vs. LHP | ISO vs. LHP | wOBA L14 | FD Position | FD Salary | DK Position | DK Salary |
| 1 | | RIGHT | 0.319 | 0.173 | 0.358 | OF | $3,100 | OF | $4,500 |
| 2 | | LEFT | 0.315 | 0.149 | 0.375 | 2B | $3,900 | 2B | $4,500 |
| 3 | | SWITCH | 0.360 | 0.164 | 0.345 | SS | $3,500 | SS | $4,300 |
| 4 | | RIGHT | 0.404 | 0.281 | 0.550 | 1B | $3,700 | 1B | $4,800 |
| 5 | | SWITCH | 0.318 | 0.108 | 0.306 | 1B | $3,600 | 1B | $3,600 |
| 6 | Jose Ramirez | SWITCH | 0.320 | 0.130 | 0.492 | P | $4,000 | 3B/OF | $4,900 |
| 7 | | RIGHT | 0.403 | 0.208 | 0.550 | OF | $2,600 | OF | $4,100 |
| 8 | | SWITCH | 0.299 | 0.102 | 0.325 | OF | $2,900 | OF | $3,100 |
| 9 | | RIGHT | 0.318 | 0.138 | 0.186 | C | $2,000 | C | $2,600 |
| | Team Averages | — | 0.340 | 0.161 | 0.387 | — | — | — | — |
Elite Plays – NONE
Secondary Plays – , ,
Stackability – ORANGE
Want to discuss strategy for today’s games? Head over to the RotoGrinders Forums
Jump to Page 1 2 3
