MLB Grind Down: Wednesday, June 14th

Jump to Page 1 2 3
The RotoGrinders MLB Grind Down will give you an in-depth analysis into the upcoming MLB schedule. This article will break down the numbers for every single game and give you analysis on which trends you can exploit. While matchups are a major factor in daily fantasy baseball, there are plenty of other factors to consider such as injuries, weather, and salaries.
The analysis should point you in the right direction, but it is still up to you to decipher the information and make your own selections. No sport has more variance than baseball. The best choice is not always the right choice but following the trends will win you money over time.
Note: As always, if you want to try a new DFS site, be sure to click through a RotoGrinders link and use our DraftKings promo code, FanDuel promo code, and FantasyDraft promo code to receive the best perks in the industry.
Stackability Rating System:
GREEN – A viable full stack in cash games and GPPs.
YELLOW – A viable mini-stack in cash games and full stack in GPPs.
ORANGE – A viable stack in large field GPPs.
RED – Not a recommended stack for cash games or GPPs.
Oakland at Miami – 12:10 PM ET
| Oakland | Miami | ||||||||||||||
 | Daniel Gossett |  | Edinson Volquez | ||||||||||||
| RIGHT | RIGHT | ||||||||||||||
| Vegas Moneyline | Vegas Over/Under | ||||||||||||||
| MIA-157 | 9.0 | ||||||||||||||
| Stats | wOBA | xwOBA | HC% | BB% | K% | GB% | Stats | wOBA | xwOBA | HC% | BB% | K% | GB% | ||
|---|---|---|---|---|---|---|---|---|---|---|---|---|---|---|---|
| SP vs. Left (2016-17) | SP vs. Left (2016-17) | 0.347 | 0.366 | 35.4% | 11.3% | 17.4% | 46.2% | ||||||||
| SP vs. Right (2016-17) | SP vs. Right (2016-17) | 0.321 | 0.313 | 28.0% | 8.1% | 18.5% | 55.6% | ||||||||
Pitcher Grind Down
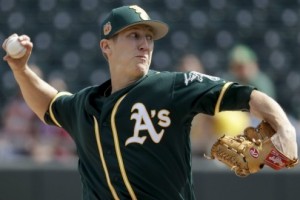
| Daniel Gossett | |||||||||
 | FanDuel | DraftKings | FantasyDraft | ||||||
| Salary: | $6,100 | Salary: | $4,500 | Salary: | |||||
| Salary Rank: | 28 of 30 | Salary Rank: | 28 of 30 | Salary Rank: | of 30 | ||||
| Stats | Starts | SIERA | ERA | K% | BB% | GB% | HC% | SC% | |
|---|---|---|---|---|---|---|---|---|---|
Gossett was never a major pitching prospect, but he seems to improve each and every year in the minors. In 11 Triple-A starts this season, he posted a 3.76 FIP with a strikeout rate of 21% and a walk rate of 7%. He opens his major league career as a sizable underdog against the Marlins. Seeing as how this game isn’t included in the early slates on FanDuel or DraftKings, he is an easy fade in the all-day slate since we have 30 pitchers to choose from.
Quick Breakdown: Take a wait and see approach with Gossett.
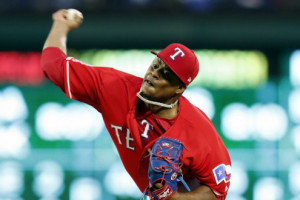
| Edinson Volquez | |||||||||
 | FanDuel | DraftKings | FantasyDraft | ||||||
| Salary: | $8,100 | Salary: | $8,900 | Salary: | |||||
| Salary Rank: | 9 of 30 | Salary Rank: | 5 of 30 | Salary Rank: | of 30 | ||||
| Stats | Starts | SIERA | ERA | K% | BB% | GB% | HC% | SC% | |
|---|---|---|---|---|---|---|---|---|---|
| 2016 | 34 | 4.72 | 5.37 | 16.3% | 8.9% | 51.2% | 31.7% | 19.5% | |
| 2017 | 12 | 4.60 | 3.41 | 22.8% | 12.3% | 48.6% | 32.4% | 19.8% | |
Volquez backed up his no-hitter with another solid outing against the Pirates. In his last two starts combined, he has struck out 18 batters while allowing three hits and zero earned runs. Obviously, this isn’t sustainable, but maybe he’s found something in his mechanics recently. He draws a decent matchup against the A’s, who strikeout at a high rate against right-handed pitching, but he’s only available in the all-day slate. With 30 pitchers taking the mound today, we can find a better one to target.
Quick Breakdown: Volquez would be a nice play in the early slate, but unfortunately, this game isn’t included.
Batter Grind Down
Oakland
If the A’s were facing Edinson Volquez a few starts ago, we would be looking to exploit this matchup. We obviously shouldn’t expect Volquez to have this type of success moving forward, but pitchers can be streaky. As far as the splits go, Volquez allowed a .366 xwOBA and a 35% hard contact rate to lefties in the last two seasons, which brings Jaycob Brugman, Jed Lowrie, and Yonder Alonso into the fold as secondary plays.
Projected Lineup (Splits vs. RH Pitching)
| # | Player | Bats | wOBA | xwOBA | ISO | HC% | BB% | K% | GB% | FD Pos. | FD Sal. | DK Pos. | DK Sal. | FDRFT Pos. | FDRFT Sal. |
|---|---|---|---|---|---|---|---|---|---|---|---|---|---|---|---|
| 1 | Jaycob Brugman | LEFT | 0.321 | 0.000 | 38.5% | 11.1% | 16.7% | 30.8% | OF | $2,200 | OF | $2,100 | N/A | N/A | |
| 2 | Chad Pinder | RIGHT | 0.331 | 0.373 | 0.266 | 34.4% | 6.7% | 29.8% | 37.5% | 2B | $2,600 | 2B/SS | $3,400 | N/A | N/A |
| 3 | Jed Lowrie | SWITCH | 0.326 | 0.324 | 0.138 | 32.8% | 7.9% | 16.5% | 36.1% | 2B | $2,400 | 2B | $4,200 | N/A | N/A |
| 4 | Khris Davis | RIGHT | 0.350 | 0.369 | 0.281 | 40.1% | 7.1% | 29.0% | 42.7% | OF | $3,900 | OF | $4,400 | N/A | N/A |
| 5 | Yonder Alonso | LEFT | 0.341 | 0.371 | 0.173 | 35.2% | 10.0% | 16.1% | 39.1% | 1B | $3,200 | 1B | $4,000 | N/A | N/A |
| 6 | Ryon Healy | RIGHT | 0.337 | 0.332 | 0.208 | 34.1% | 4.1% | 24.6% | 39.9% | 1B | $3,400 | 1B/3B | $3,500 | N/A | N/A |
| 7 | Stephen Vogt | LEFT | 0.312 | 0.318 | 0.164 | 27.6% | 6.9% | 15.6% | 30.4% | C | $2,400 | C | $3,200 | N/A | N/A |
| 8 | Matt Joyce | LEFT | 0.343 | 0.370 | 0.208 | 36.8% | 17.9% | 22.3% | 41.3% | OF | $2,600 | OF | $3,500 | N/A | N/A |
| 9 | Daniel Gossett | RIGHT | P | $6,100 | P | $4,500 | N/A | N/A |
Elite Plays – None
Secondary Plays – Jaycob Brugman, Jed Lowrie, Yonder Alonso
Stackability – ORANGE
Miami
The Marlins get to face a rookie pitcher that is making his major league debut. These situations are always difficult to predict, but more often than not, we want to be on the hitting side of these matchups. Since this game is only included in the all-day slate, I wouldn’t go overboard on my Marlins’ exposure, but Dee Gordon, Giancarlo Stanton, Christian Yelich, and Marcell Ozuna are all viable secondary plays.
Projected Lineup (Splits vs. RH Pitching)
| # | Player | Bats | wOBA | xwOBA | ISO | HC% | BB% | K% | GB% | FD Pos. | FD Sal. | DK Pos. | DK Sal. | FDRFT Pos. | FDRFT Sal. |
|---|---|---|---|---|---|---|---|---|---|---|---|---|---|---|---|
| 1 | Dee Gordon | LEFT | 0.301 | 0.244 | 0.078 | 18.6% | 5.6% | 15.4% | 57.6% | 2B | $2,900 | 2B | $4,700 | N/A | N/A |
| 2 | Giancarlo Stanton | RIGHT | 0.338 | 0.336 | 0.228 | 37.2% | 9.7% | 28.3% | 40.6% | OF | $3,700 | OF | $4,800 | N/A | N/A |
| 3 | Christian Yelich | LEFT | 0.370 | 0.385 | 0.189 | 39.5% | 12.0% | 19.5% | 54.9% | OF | $3,600 | OF | $3,900 | N/A | N/A |
| 4 | Marcell Ozuna | RIGHT | 0.342 | 0.335 | 0.189 | 36.7% | 7.5% | 19.9% | 46.5% | OF | $3,700 | OF | $4,800 | N/A | N/A |
| 5 | Derek Dietrich | LEFT | 0.335 | 0.336 | 0.152 | 29.9% | 7.8% | 19.8% | 37.5% | 3B | $2,800 | 3B | $3,800 | N/A | N/A |
| 6 | J.T. Realmuto | RIGHT | 0.341 | 0.308 | 0.126 | 30.7% | 5.3% | 16.6% | 49.9% | C | $3,300 | C | $3,900 | N/A | N/A |
| 7 | Tyler Moore | RIGHT | 0.373 | 0.317 | 0.357 | 37.5% | 2.2% | 26.7% | 37.5% | OF | $2,200 | 1B/OF | $3,100 | N/A | N/A |
| 8 | JT Riddle | LEFT | 0.299 | 0.317 | 0.165 | 43.4% | 4.0% | 20.0% | 45.9% | SS | $2,600 | SS | $3,000 | N/A | N/A |
| 9 | Edinson Volquez | RIGHT | 0.167 | 0.133 | 0.000 | 12.5% | 0.0% | 30.4% | 71.4% | P | $8,100 | P | $8,900 | N/A | N/A |
Elite Plays – None
Secondary Plays – Dee Gordon, Giancarlo Stanton, Christian Yelich, and Marcell Ozuna
Stackability – ORANGE / YELLOW
Cincinnati at San Diego – 3:40 PM ET
| Cincinnati | San Diego | ||||||||||||||
 | Amir Garrett |  | Jhoulys Chacin | ||||||||||||
| LEFT | RIGHT | ||||||||||||||
| Vegas Moneyline | Vegas Over/Under | ||||||||||||||
| SD -125 | 8.5 | ||||||||||||||
| Stats | wOBA | xwOBA | HC% | BB% | K% | GB% | Stats | wOBA | xwOBA | HC% | BB% | K% | GB% | ||
|---|---|---|---|---|---|---|---|---|---|---|---|---|---|---|---|
| SP vs. Left (2016-17) | 0.373 | 0.327 | 34.6% | 2.8% | 25.0% | 50.0% | SP vs. Left (2016-17) | 0.350 | 0.347 | 35.5% | 9.5% | 13.0% | 51.2% | ||
| SP vs. Right (2016-17) | 0.383 | 0.363 | 40.3% | 12.1% | 15.9% | 40.0% | SP vs. Right (2016-17) | 0.296 | 0.293 | 26.9% | 7.7% | 25.3% | 48.1% | ||
Pitcher Grind Down
| Amir Garrett | |||||||||
 | FanDuel | DraftKings | FantasyDraft | ||||||
| Salary: | $6,900 | Salary: | $4,900 | Salary: | |||||
| Salary Rank: | 21 of 30 | Salary Rank: | 25 of 30 | Salary Rank: | of 30 | ||||
| Stats | Starts | SIERA | ERA | K% | BB% | GB% | HC% | SC% | |
|---|---|---|---|---|---|---|---|---|---|
| 2017 | 10 | 5.14 | 7.40 | 17.4% | 10.6% | 41.7% | 39.4% | 12.3% | |
This is the first of three games that are included in the early-only slate. The theme of today’s slates seems to be a lack of pitching. Garrett got off to a quick start this season, but has been one of the most hittable in baseball over the last six weeks. Overall, he owns a 5.14 SIERA with a strikeout rate of 17% and a walk rate of 10%. We typically love targeting pitchers against the Padres, but there is more risk than potential reward with Garrett.
Quick Breakdown: Even in a three game slate, Garrett will not be making his way into any of my lineups.
| Jhoulys Chacin | |||||||||
 | FanDuel | DraftKings | FantasyDraft | ||||||
| Salary: | $7,000 | Salary: | $7,100 | Salary: | |||||
| Salary Rank: | 20 of 30 | Salary Rank: | 12 of 30 | Salary Rank: | of 30 | ||||
| Stats | Starts | SIERA | ERA | K% | BB% | GB% | HC% | SC% | |
|---|---|---|---|---|---|---|---|---|---|
| 2016 | 22 | 4.38 | 4.81 | 18.8% | 8.7% | 48.4% | 31.6% | 19.0% | |
| 2017 | 13 | 4.24 | 5.35 | 20.3% | 8.2% | 52.3% | 30.9% | 18.9% | |
Chacin wouldn’t be in play in a full slate, but in a three-game slate, we don’t have many options to work with. He gets to pitch at home in a good ballpark and he gets to face a Reds’ lineup that should have more right-handed hitters than left-handed hitters. In the last two seasons, Chacin has a 27% hard contact rate and a 25% strikeout rate against righties. He’s also listed as a small favorite here.
Quick Breakdown: Chacin is in play thanks to a lack of pitching options in the early slate. He’s right there with Tanner Roark as the number two option behind Johnny Cueto.
Batter Grind Down
Cincinnati
The Reds see a significantly negative ballpark shift playing in Petco Park. Their offense has struggled so far in this series and they have a low implied run total again tonight. Jhoulys Chacin is in play as an SP2 in this slate, but if you aren’t playing him, you can look at the lefties in the Reds’ lineup. Over the last two seasons, Chacin has allowed a .347 xwOBA and a 35% hard contact rate to lefties.
Projected Lineup (Splits vs. RH Pitching)
| # | Player | Bats | wOBA | xwOBA | ISO | HC% | BB% | K% | GB% | FD Pos. | FD Sal. | DK Pos. | DK Sal. | FDRFT Pos. | FDRFT Sal. |
|---|---|---|---|---|---|---|---|---|---|---|---|---|---|---|---|
| 1 | Billy Hamilton | SWITCH | 0.300 | 0.254 | 0.076 | 18.7% | 9.0% | 20.2% | 47.6% | OF | $2,900 | OF | $3,900 | N/A | N/A |
| 2 | Zack Cozart | RIGHT | 0.341 | 0.306 | 0.183 | 29.5% | 9.4% | 17.0% | 39.2% | SS | $3,400 | SS | $4,200 | N/A | N/A |
| 3 | Joey Votto | LEFT | 0.423 | 0.437 | 0.253 | 39.8% | 17.4% | 14.3% | 37.5% | 1B | $4,500 | 1B | $5,300 | N/A | N/A |
| 4 | Adam Duvall | RIGHT | 0.333 | 0.329 | 0.254 | 36.7% | 5.8% | 26.9% | 33.6% | OF | $3,500 | OF | $5,100 | N/A | N/A |
| 5 | Eugenio Suarez | RIGHT | 0.318 | 0.316 | 0.156 | 33.4% | 8.2% | 23.6% | 41.0% | 3B | $3,000 | 3B | $4,300 | N/A | N/A |
| 6 | Scott Schebler | LEFT | 0.343 | 0.336 | 0.216 | 36.0% | 7.7% | 21.3% | 49.1% | OF | $3,300 | OF | $4,500 | N/A | N/A |
| 7 | Jose Peraza | RIGHT | 0.303 | 0.295 | 0.080 | 19.2% | 1.8% | 13.9% | 43.6% | 2B | $2,200 | 2B | $3,400 | N/A | N/A |
| 8 | Tucker Barnhart | SWITCH | 0.315 | 0.333 | 0.127 | 31.3% | 9.1% | 14.1% | 45.1% | C | $2,500 | C | $2,600 | N/A | N/A |
| 9 | Amir Garrett | LEFT | 0.095 | 0.130 | 0.077 | 0.0% | 0.0% | 35.7% | 40.0% | P | $6,900 | P | $4,900 | N/A | N/A |
Elite Plays – Joey Votto
Secondary Plays – Billy Hamilton, Scott Schebler
Stackability – ORANGE
San Diego
The Padres’ offense has shown some signs of life in this series and draw an exploitable matchup against Amir Garrett. He hasn’t been particularly great against lefties this season, but his real struggles have come against right-handed hitters, allowing a .363 xwOBA and a massive 40% hard contact rate. Jose Pirela, Wil Myers, and Hunter Renfroe all hit southpaws well and are all cheap across the industry. If you want to do a full Padres’ stack, Yangervis Solarte and Austin Hedges are also worth a look.
Projected Lineup (Splits vs. LH Pitching)
| # | Player | Bats | wOBA | xwOBA | ISO | HC% | BB% | K% | GB% | FD Pos. | FD Sal. | DK Pos. | DK Sal. | FDRFT Pos. | FDRFT Sal. |
|---|---|---|---|---|---|---|---|---|---|---|---|---|---|---|---|
| 1 | Jose Pirela | RIGHT | 0.407 | 0.352 | 0.105 | 40.0% | 13.6% | 18.2% | 46.7% | 2B | $2,600 | 2B | $3,600 | N/A | N/A |
| 2 | Yangervis Solarte | SWITCH | 0.299 | 0.301 | 0.112 | 26.7% | 8.2% | 13.5% | 44.3% | 3B | $3,200 | 2B | $4,000 | N/A | N/A |
| 3 | Wil Myers | RIGHT | 0.342 | 0.349 | 0.188 | 43.8% | 11.1% | 27.1% | 41.6% | 1B | $3,600 | 1B | $3,500 | N/A | N/A |
| 4 | Hunter Renfroe | RIGHT | 0.438 | 0.388 | 0.313 | 32.8% | 14.1% | 11.5% | 36.2% | OF | $3,000 | OF | $3,600 | N/A | N/A |
| 5 | Austin Hedges | RIGHT | 0.256 | 0.244 | 0.111 | 34.0% | 4.5% | 24.2% | 34.0% | C | $2,600 | C | $3,600 | N/A | N/A |
| 6 | Cory Spangenberg | LEFT | 0.301 | 0.241 | 0.146 | 31.0% | 5.7% | 37.7% | 56.0% | 2B | $2,500 | 3B/OF | $3,900 | N/A | N/A |
| 7 | Matt Szczur | RIGHT | 0.278 | 0.259 | 0.158 | 20.8% | 9.4% | 22.6% | 50.7% | OF | $2,000 | OF | $3,000 | N/A | N/A |
| 8 | Chase d’Arnaud | RIGHT | 0.288 | 0.279 | 0.101 | 26.3% | 7.3% | 18.2% | 41.8% | SS | $2,000 | SS | $2,900 | N/A | N/A |
| 9 | Jhoulys Chacin | RIGHT | 0.272 | 0.232 | 0.091 | 20.0% | 0.0% | 23.1% | 0.0% | P | $7,000 | P | $7,100 | N/A | N/A |
Elite Plays – Jose Pirela, Wil Myers, Hunter Renfroe
Secondary Plays – Yangervis Solarte, Austin Hedges
Stackability – YELLOW
Kansas City at San Francisco – 3:45 PM ET
| Kansas City | San Francisco | ||||||||||||||
 | Jason Hammel |  | Johnny Cueto | ||||||||||||
| RIGHT | RIGHT | ||||||||||||||
| Vegas Moneyline | Vegas Over/Under | ||||||||||||||
| SF -175 | 7.5 | ||||||||||||||
| Stats | wOBA | xwOBA | HC% | BB% | K% | GB% | Stats | wOBA | xwOBA | HC% | BB% | K% | GB% | ||
|---|---|---|---|---|---|---|---|---|---|---|---|---|---|---|---|
| SP vs. Left (2016-17) | 0.335 | 0.339 | 32.9% | 10.1% | 20.0% | 37.4% | SP vs. Left (2016-17) | 0.299 | 0.320 | 32.5% | 5.2% | 23.1% | 45.9% | ||
| SP vs. Right (2016-17) | 0.307 | 0.325 | 32.1% | 5.7% | 19.8% | 42.1% | SP vs. Right (2016-17) | 0.277 | 0.285 | 26.9% | 5.7% | 22.5% | 48.9% | ||
Pitcher Grind Down
| Jason Hammel | |||||||||
 | FanDuel | DraftKings | FantasyDraft | ||||||
| Salary: | $6,700 | Salary: | $7,800 | Salary: | |||||
| Salary Rank: | 23 of 30 | Salary Rank: | 9 of 30 | Salary Rank: | of 30 | ||||
| Stats | Starts | SIERA | ERA | K% | BB% | GB% | HC% | SC% | |
|---|---|---|---|---|---|---|---|---|---|
| 2016 | 30 | 4.28 | 3.83 | 20.8% | 7.7% | 42.1% | 32.5% | 18.5% | |
| 2017 | 12 | 4.89 | 5.43 | 17.6% | 7.9% | 35.4% | 32.4% | 16.9% | |
Hammel draws a near perfect matchup for a right-handed pitcher. He gets to play in a National League ballpark, he is facing a powerless Giants’ offense, and he gets to play in one of the best pitcher’s parks in baseball. The problem is that he is still Jason Hammel. His numbers are down across the board this season and he is getting no love from the oddsmakers as a large underdog against Johnny Cueto. If I had to rank the six pitchers in this slate, Hammel would be fourth or fifth, which is less than ideal.
Quick Breakdown: Even in this ballpark and in this matchup, Hammel can be avoided.
| Johnny Cueto | |||||||||
 | FanDuel | DraftKings | FantasyDraft | ||||||
| Salary: | $9,800 | Salary: | $11,700 | Salary: | |||||
| Salary Rank: | 2 of 30 | Salary Rank: | 2 of 30 | Salary Rank: | of 30 | ||||
| Stats | Starts | SIERA | ERA | K% | BB% | GB% | HC% | SC% | |
|---|---|---|---|---|---|---|---|---|---|
| 2016 | 32 | 3.59 | 2.79 | 22.5% | 5.1% | 50.2% | 27.2% | 19.4% | |
| 2017 | 13 | 3.86 | 4.33 | 23.6% | 6.4% | 40.2% | 36.4% | 13.4% | |
Cueto is the clear choice at pitcher in the early slate. If you are playing on a single pitcher site like FanDuel, the choice at pitcher is simple. If you are playing on a multi-pitcher site like DraftKings or FantasyDraft, you will have your work cut out for you choosing an SP2. The Royals don’t hit right-handed pitching well and Cueto gets to face them at home without the use of a DH. He is head and shoulders above the other options in the early-only slate.
Quick Breakdown: Don’t get cute in this early slate. Play Cueto and move on.
Batter Grind Down
Kansas City
The Royals have a low implied run total today against Johnny Cueto. Not only does he hold both left and right-handed hitters in check, but they have to face him in AT&T Park, which is one of the best pitcher’s parks in baseball. The Astros can be avoided in both cash games and tournaments.
Projected Lineup (Splits vs. RH Pitching)
| # | Player | Bats | wOBA | xwOBA | ISO | HC% | BB% | K% | GB% | FD Pos. | FD Sal. | DK Pos. | DK Sal. | FDRFT Pos. | FDRFT Sal. |
|---|---|---|---|---|---|---|---|---|---|---|---|---|---|---|---|
| 1 | Whit Merrifield | RIGHT | 0.292 | 0.291 | 0.118 | 31.9% | 4.9% | 18.6% | 41.9% | 2B | $3,200 | 2B | $3,400 | N/A | N/A |
| 2 | Jorge Bonifacio | RIGHT | 0.360 | 0.362 | 0.231 | 35.5% | 8.3% | 27.5% | 38.2% | OF | $2,900 | OF | $3,100 | N/A | N/A |
| 3 | Lorenzo Cain | RIGHT | 0.312 | 0.305 | 0.107 | 29.3% | 7.3% | 21.0% | 49.1% | OF | $3,200 | OF | $4,500 | N/A | N/A |
| 4 | Eric Hosmer | LEFT | 0.352 | 0.354 | 0.170 | 34.9% | 9.4% | 18.6% | 56.3% | 1B | $3,100 | 1B | $3,700 | N/A | N/A |
| 5 | Mike Moustakas | LEFT | 0.364 | 0.368 | 0.277 | 35.7% | 6.6% | 15.0% | 36.2% | 3B | $3,200 | 3B | $4,200 | N/A | N/A |
| 6 | Salvador Perez | RIGHT | 0.320 | 0.306 | 0.198 | 37.4% | 3.4% | 20.4% | 34.0% | C | $3,400 | C | $4,000 | N/A | N/A |
| 7 | Alex Gordon | LEFT | 0.290 | 0.321 | 0.145 | 35.9% | 10.2% | 26.1% | 40.2% | OF | $2,700 | OF | $2,800 | N/A | N/A |
| 8 | Alcides Escobar | RIGHT | 0.256 | 0.248 | 0.078 | 22.7% | 3.4% | 16.8% | 46.8% | SS | $2,600 | SS | $2,200 | N/A | N/A |
| 9 | Jason Hammel | RIGHT | 0.237 | 0.213 | 0.059 | 17.7% | 1.9% | 34.0% | 54.8% | P | $6,700 | P | $7,800 | N/A | N/A |
Elite Plays – None
Secondary Plays – None
Stackability – RED
San Francisco
The Giants have really struggled against right-handed pitching this season, but at least they have all of their pieces healthy. They should be able to improve their numbers at the plate moving forward, but are still an offense that lacks firepower. The one plus here is that they get to face Jason Hammel, who has struggled with hitters from both sides of the plate. If they can get to Hammel, there is a chance they could see Chris Young as the long reliever and we all know how bad he is against left-handed hitters. It’s not something that I would build my lineups around, but it could be an added bonus for the likes of Denard Span, Brandon Belt, and Brandon Crawford.
Projected Lineup (Splits vs. RH Pitching)
| # | Player | Bats | wOBA | xwOBA | ISO | HC% | BB% | K% | GB% | FD Pos. | FD Sal. | DK Pos. | DK Sal. | FDRFT Pos. | FDRFT Sal. |
|---|---|---|---|---|---|---|---|---|---|---|---|---|---|---|---|
| 1 | Denard Span | LEFT | 0.333 | 0.339 | 0.146 | 26.9% | 8.0% | 11.7% | 47.5% | OF | $3,300 | OF | $3,200 | N/A | N/A |
| 2 | Eduardo Nunez | RIGHT | 0.324 | 0.289 | 0.126 | 25.6% | 4.7% | 13.7% | 52.4% | 3B | $4,200 | 3B/OF | $4,700 | N/A | N/A |
| 3 | Brandon Belt | LEFT | 0.374 | 0.389 | 0.211 | 38.1% | 16.7% | 22.1% | 26.1% | 1B | $3,900 | 1B/OF | $4,100 | N/A | N/A |
| 4 | Buster Posey | RIGHT | 0.342 | 0.370 | 0.138 | 34.1% | 9.4% | 10.6% | 49.0% | C | $4,000 | 1B/C | $4,600 | N/A | N/A |
| 5 | Hunter Pence | RIGHT | 0.321 | 0.314 | 0.113 | 28.0% | 8.3% | 22.0% | 59.7% | OF | $3,000 | OF | $3,200 | N/A | N/A |
| 6 | Brandon Crawford | LEFT | 0.315 | 0.331 | 0.167 | 34.4% | 9.0% | 18.8% | 44.7% | SS | $3,100 | SS | $3,200 | N/A | N/A |
| 7 | Joe Panik | LEFT | 0.318 | 0.337 | 0.164 | 26.8% | 9.7% | 7.9% | 44.9% | 2B | $3,100 | 2B | $3,600 | N/A | N/A |
| 8 | Austin Slater | RIGHT | 0.347 | 0.332 | 0.150 | 18.8% | 8.3% | 16.7% | 75.0% | OF | $2,800 | OF | $2,400 | N/A | N/A |
| 9 | Johnny Cueto | RIGHT | 0.096 | 0.160 | 0.000 | 6.1% | 4.4% | 23.5% | 69.7% | P | $9,800 | P | $11,700 | N/A | N/A |
Elite Plays – Brandon Belt
Secondary Plays – Denard Span, Buster Posey, Brandon Crawford
Stackability – YELLOW
Atlanta at Washington – 4:05 PM ET
| Atlanta | Washington | ||||||||||||||
 | Julio Teheran |  | Tanner Roark | ||||||||||||
| RIGHT | RIGHT | ||||||||||||||
| Vegas Moneyline | Vegas Over/Under | ||||||||||||||
| WAS-160 | 9.5 | ||||||||||||||
| Stats | wOBA | xwOBA | HC% | BB% | K% | GB% | Stats | wOBA | xwOBA | HC% | BB% | K% | GB% | ||
|---|---|---|---|---|---|---|---|---|---|---|---|---|---|---|---|
| SP vs. Left (2016-17) | 0.347 | 0.343 | 35.0% | 10.4% | 14.8% | 34.6% | SP vs. Left (2016-17) | 0.296 | 0.321 | 28.9% | 10.2% | 18.3% | 40.5% | ||
| SP vs. Right (2016-17) | 0.259 | 0.273 | 30.3% | 3.1% | 25.8% | 41.2% | SP vs. Right (2016-17) | 0.282 | 0.297 | 21.5% | 6.5% | 21.3% | 54.2% | ||
Pitcher Grind Down
| Julio Teheran | |||||||||
 | FanDuel | DraftKings | FantasyDraft | ||||||
| Salary: | $8,200 | Salary: | $6,600 | Salary: | |||||
| Salary Rank: | 8 of 30 | Salary Rank: | 15 of 30 | Salary Rank: | of 30 | ||||
| Stats | Starts | SIERA | ERA | K% | BB% | GB% | HC% | SC% | |
|---|---|---|---|---|---|---|---|---|---|
| 2016 | 30 | 3.93 | 3.21 | 22.0% | 5.4% | 39.1% | 33.1% | 17.7% | |
| 2017 | 13 | 5.19 | 5.08 | 16.7% | 9.6% | 34.9% | 31.6% | 22.7% | |
Teheran looks like a completely different pitcher this season. It could be the fact that SunTrust Park is now one of the best ballparks in baseball for left-handed hitters, but that doesn’t explain his high walk rate and low strikeout rate. At this point, we should be avoiding Teheran in both cash games and tournaments. The Nationals may not have a ton of lefties in their lineup, but they do have Bryce Harper and Daniel Murphy.
Quick Breakdown: Avoid Teheran in all formats.
| Tanner Roark | |||||||||
 | FanDuel | DraftKings | FantasyDraft | ||||||
| Salary: | $9,000 | Salary: | $8,700 | Salary: | |||||
| Salary Rank: | 4 of 30 | Salary Rank: | 6 of 30 | Salary Rank: | of 30 | ||||
| Stats | Starts | SIERA | ERA | K% | BB% | GB% | HC% | SC% | |
|---|---|---|---|---|---|---|---|---|---|
| 2016 | 33 | 4.32 | 2.83 | 20.1% | 8.5% | 48.7% | 24.3% | 23.1% | |
| 2017 | 13 | 4.44 | 3.87 | 19.1% | 7.5% | 45.1% | 26.9% | 14.5% | |
Roark is not a pitcher that I like to target in full slates. He’s one of those guys that is a better pitcher in real baseball than he is in fantasy baseball. He has a below-average strikeout rate, but gets by with a low hard contact rate. He also benefits from making half of his starts in this ballpark. With so few options in the early slate, Roark is worth a look as an SP2 on multi-pitcher sites. I don’t want to target right-handed pitchers against the Braves right now, but we really don’t have many choices.
Quick Breakdown: Roark is viable as an SP2 on multi-pitcher sites, but Johnny Cueto is the clear number one in this slate.
Batter Grind Down
Atlanta
The Braves have been hitting the ball well recently and haven’t skipped a beat since Freddie Freeman went down with his injury. They are still only ranked 21st in team wOBA against right-handed pitching, but they’ve had a few batters that we’ve been able to target on a regular basis. Matt Adams headlines that list of targets, as he has a .236 ISO and a 38% hard contact rate against righties in the last two seasons. He’s really the only hitter that I will be actively targeting against Tanner Roark.
Projected Lineup (Splits vs. RH Pitching)
| # | Player | Bats | wOBA | xwOBA | ISO | HC% | BB% | K% | GB% | FD Pos. | FD Sal. | DK Pos. | DK Sal. | FDRFT Pos. | FDRFT Sal. |
|---|---|---|---|---|---|---|---|---|---|---|---|---|---|---|---|
| 1 | Ender Inciarte | LEFT | 0.316 | 0.297 | 0.104 | 26.4% | 8.5% | 13.6% | 42.1% | OF | $3,600 | OF | $3,900 | N/A | N/A |
| 2 | Brandon Phillips | RIGHT | 0.325 | 0.309 | 0.126 | 28.3% | 3.3% | 12.3% | 47.6% | 2B | $2,700 | 2B | $3,400 | N/A | N/A |
| 3 | Nick Markakis | LEFT | 0.339 | 0.359 | 0.137 | 33.8% | 11.5% | 16.4% | 42.7% | OF | $3,300 | OF | $3,400 | N/A | N/A |
| 4 | Matt Kemp | RIGHT | 0.340 | 0.352 | 0.217 | 36.4% | 5.0% | 23.8% | 40.4% | OF | $3,300 | OF | $4,200 | N/A | N/A |
| 5 | Matt Adams | LEFT | 0.345 | 0.339 | 0.236 | 37.8% | 8.1% | 25.6% | 33.6% | 1B | $3,100 | 1B/OF | $4,200 | N/A | N/A |
| 6 | Tyler Flowers | RIGHT | 0.364 | 0.349 | 0.149 | 42.5% | 7.9% | 25.2% | 42.5% | C | $3,100 | C | $3,600 | N/A | N/A |
| 7 | Rio Ruiz | LEFT | 0.257 | 0.315 | 0.103 | 34.7% | 9.2% | 25.0% | 61.2% | 3B | $2,600 | 3B | $2,500 | N/A | N/A |
| 8 | Dansby Swanson | RIGHT | 0.274 | 0.298 | 0.100 | 31.6% | 10.0% | 24.0% | 49.1% | SS | $2,800 | SS | $3,300 | N/A | N/A |
| 9 | Julio Teheran | RIGHT | 0.150 | 0.187 | 0.016 | 11.3% | 0.0% | 27.4% | 48.7% | P | $8,200 | P | $6,600 | N/A | N/A |
Elite Plays – Matt Adams (FD)
Secondary Plays – Matt Adams (DK), Ender Inciarte, Nick Markakis
Stackability – ORANGE
Washington
I don’t want to bury the lead, so let’s start with Bryce Harper BvP against Julio Teheran. In his career, he is 15-for-33 with seven home runs and three doubles. That works out to be a .678 wOBA. It makes sense with Teheran’s struggles with lefties, but those are some insane BvP numbers. Harper is obviously an elite play here and the same can be said about Brian Goodwin (if he’s batting second), Daniel Murphy, and Matt Wieters. If you want to complete the stack, I certainly don’t mind including Trea Turner and/or Ryan Zimmerman.
Projected Lineup (Splits vs. RH Pitching)
| # | Player | Bats | wOBA | xwOBA | ISO | HC% | BB% | K% | GB% | FD Pos. | FD Sal. | DK Pos. | DK Sal. | FDRFT Pos. | FDRFT Sal. |
|---|---|---|---|---|---|---|---|---|---|---|---|---|---|---|---|
| 1 | Trea Turner | RIGHT | 0.388 | 0.333 | 0.235 | 31.2% | 4.7% | 18.1% | 46.5% | SS | $4,600 | SS | $5,600 | N/A | N/A |
| 2 | Brian Goodwin | LEFT | 0.310 | 0.237 | 0.202 | 30.8% | 5.3% | 26.3% | 42.9% | OF | $2,500 | OF | $3,400 | N/A | N/A |
| 3 | Bryce Harper | LEFT | 0.381 | 0.394 | 0.245 | 35.3% | 18.7% | 15.9% | 40.0% | OF | $4,600 | OF | $5,500 | N/A | N/A |
| 4 | Ryan Zimmerman | RIGHT | 0.330 | 0.335 | 0.193 | 35.6% | 5.6% | 23.1% | 45.2% | 1B | $4,000 | 1B | $5,300 | N/A | N/A |
| 5 | Daniel Murphy | LEFT | 0.410 | 0.398 | 0.242 | 38.3% | 6.4% | 9.0% | 35.5% | 2B | $3,700 | 2B | $4,200 | N/A | N/A |
| 6 | Anthony Rendon | RIGHT | 0.341 | 0.346 | 0.189 | 35.0% | 9.6% | 17.5% | 37.0% | 3B | $3,700 | 3B | $4,100 | N/A | N/A |
| 7 | Matt Wieters | SWITCH | 0.308 | 0.320 | 0.160 | 33.2% | 6.6% | 17.8% | 37.3% | C | $2,500 | C | $2,900 | N/A | N/A |
| 8 | Michael Taylor | RIGHT | 0.280 | 0.273 | 0.160 | 31.5% | 5.4% | 31.6% | 42.2% | OF | $3,000 | OF | $3,600 | N/A | N/A |
| 9 | Tanner Roark | RIGHT | 0.175 | 0.175 | 0.015 | 8.9% | 6.1% | 25.6% | 59.1% | P | $9,000 | P | $8,700 | N/A | N/A |
Elite Plays – Bryce Harper, Brian Goodwin, Daniel Murphy, Matt Wieters
Secondary Plays – Trea Turner, Ryan Zimmerman
Stackability – YELLOW / GREEN
Boston at Philadelphia – 7:05 PM ET
| Boston | Philadelphia | ||||||||||||||
 | Brian Johnson |  | Jeremy Hellickson | ||||||||||||
| LEFT | RIGHT | ||||||||||||||
| Vegas Moneyline | Vegas Over/Under | ||||||||||||||
| BOS-120 | 9.5 | ||||||||||||||
| Stats | wOBA | xwOBA | HC% | BB% | K% | GB% | Stats | wOBA | xwOBA | HC% | BB% | K% | GB% | ||
|---|---|---|---|---|---|---|---|---|---|---|---|---|---|---|---|
| SP vs. Left (2016-17) | 0.160 | 0.420 | 37.5% | 0.0% | 27.3% | 25.0% | SP vs. Left (2016-17) | 0.323 | 0.347 | 27.8% | 8.7% | 15.0% | 32.3% | ||
| SP vs. Right (2016-17) | 0.350 | 0.366 | 33.3% | 5.9% | 19.1% | 39.2% | SP vs. Right (2016-17) | 0.303 | 0.314 | 26.0% | 3.7% | 19.4% | 45.2% | ||
Pitcher Grind Down
| Brian Johnson | |||||||||
 | FanDuel | DraftKings | FantasyDraft | ||||||
| Salary: | $6,900 | Salary: | $6,500 | Salary: | $12,800 | ||||
| Salary Rank: | 21 of 30 | Salary Rank: | 16 of 30 | Salary Rank: | 10 of 30 | ||||
| Stats | Starts | SIERA | ERA | K% | BB% | GB% | HC% | SC% | |
|---|---|---|---|---|---|---|---|---|---|
| 2017 | 3 | 4.22 | 3.44 | 20.3% | 5.1% | 37.3% | 33.9% | 23.7% | |
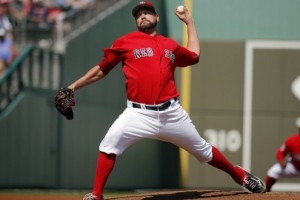
If you were hoping for good pitching options in the main slate, think again. We have plenty of terrible options to choose from. We’ll start with Brian Johnson, who is facing the Phillies in the home run-friendly Citizens Bank Park. The Phillies may not be a great offense, but their two through seven batters all hit left-handed pitching very well. This is expected to be a high scoring game and it’s hard for me to target pitchers in this park.
Quick Breakdown: Johnson is an easy fade in all formats.
| Jeremy Hellickson | |||||||||
 | FanDuel | DraftKings | FantasyDraft | ||||||
| Salary: | $6,500 | Salary: | $5,000 | Salary: | $9,900 | ||||
| Salary Rank: | 24 of 30 | Salary Rank: | 24 of 30 | Salary Rank: | 18 of 30 | ||||
| Stats | Starts | SIERA | ERA | K% | BB% | GB% | HC% | SC% | |
|---|---|---|---|---|---|---|---|---|---|
| 2016 | 32 | 4.15 | 3.71 | 20.0% | 5.8% | 40.7% | 25.9% | 20.8% | |
| 2017 | 13 | 5.66 | 4.50 | 10.7% | 6.5% | 35.7% | 28.9% | 20.1% | |
Hellickson currently has a 5.66 SIERA and an 11% strikeout rate. I could end the analysis there. He doesn’t have nearly enough upside to warrant consideration, regardless of who he is facing. Once you add in the fact that he is facing the Red Sox in a home run-friendly ballpark, he becomes one of the easiest fades on the board.
Quick Breakdown: There is always more risk than potential reward with Hellickson, especially against the Red Sox.
Batter Grind Down
Boston
The Red Sox have been scoring runs in favorable matchups, but they haven’t had that breakout performance that really breaks the slate in a long time. Maybe a matchup against an extreme fly-ball pitcher in a home run-friendly ballpark can do the trick. Hellickson doesn’t allow a ton of hard contact, but with such a low strikeout rate, the Red Sox should be able to string together hits and you never know what will happen in this ballpark. A Red Sox stack is certainly viable in tournaments.
Projected Lineup (Splits vs. RH Pitching)
| # | Player | Bats | wOBA | xwOBA | ISO | HC% | BB% | K% | GB% | FD Pos. | FD Sal. | DK Pos. | DK Sal. | FDRFT Pos. | FDRFT Sal. |
|---|---|---|---|---|---|---|---|---|---|---|---|---|---|---|---|
| 1 | Mookie Betts | RIGHT | 0.380 | 0.334 | 0.205 | 34.2% | 8.5% | 10.6% | 42.3% | OF | $3,900 | OF | $5,300 | RF | $10,200 |
| 2 | Dustin Pedroia | RIGHT | 0.351 | 0.328 | 0.124 | 32.3% | 7.9% | 9.5% | 50.3% | 2B | $3,400 | 2B | $3,700 | 2B | $7,200 |
| 3 | Xander Bogaerts | RIGHT | 0.345 | 0.295 | 0.142 | 29.8% | 7.3% | 16.9% | 47.7% | SS | $3,500 | SS | $4,400 | SS | $8,400 |
| 4 | Mitch Moreland | LEFT | 0.323 | 0.359 | 0.199 | 39.5% | 8.9% | 22.9% | 39.4% | 1B | $3,500 | 1B | $4,500 | 1B | $8,700 |
| 5 | Andrew Benintendi | LEFT | 0.353 | 0.332 | 0.199 | 37.2% | 8.3% | 15.6% | 35.3% | OF | $3,000 | OF | $4,800 | LF | $9,200 |
| 6 | Hanley Ramirez | RIGHT | 0.344 | 0.344 | 0.185 | 37.3% | 9.5% | 19.4% | 48.9% | 1B | $3,300 | 1B | $3,500 | IF/OF | $6,900 |
| 7 | Jackie Bradley Jr. | LEFT | 0.359 | 0.360 | 0.237 | 37.9% | 11.4% | 21.4% | 45.7% | OF | $3,200 | OF | $4,100 | CF | $8,000 |
| 8 | Josh Rutledge | RIGHT | 0.297 | 0.225 | 0.043 | 25.8% | 10.5% | 29.5% | 60.7% | 2B | $2,600 | 2B/3B | $2,800 | 2B | $5,400 |
| 9 | Sandy Leon | SWITCH | 0.304 | 0.280 | 0.138 | 34.3% | 6.3% | 25.6% | 43.4% | C | $2,100 | C | $2,500 | C | $4,800 |
Elite Plays – Mookie Betts, Mitch Moreland, Andrew Benintendi
Secondary Plays – Dustin Pedroia, Xander Bogaerts, Hanley Ramirez, Jackie Bradley Jr.
Stackability – YELLOW / GREEN
Philadelphia
The Phillies will fly under the radar tonight for two reasons. First, they are the Phillies and nobody every plays the Phillies. And second, there are so many good offenses in this slate that they won’t make the final cut for most people making a few lineups. I don’t see any of their hitters as must plays, but Aaron Altherr, Tommy Joseph, Maikel Franco, Cameron Rupp, and Daniel Nava all hit southpaws well. The Phillies are a sneaky stack that you can target in large field tournaments.
Projected Lineup (Splits vs. LH Pitching)
| # | Player | Bats | wOBA | xwOBA | ISO | HC% | BB% | K% | GB% | FD Pos. | FD Sal. | DK Pos. | DK Sal. | FDRFT Pos. | FDRFT Sal. |
|---|---|---|---|---|---|---|---|---|---|---|---|---|---|---|---|
| 1 | Odubel Herrera | LEFT | 0.298 | 0.287 | 0.099 | 25.5% | 8.5% | 24.1% | 55.5% | OF | $3,500 | OF | $3,700 | IF/OF | $7,200 |
| 2 | Howie Kendrick | RIGHT | 0.315 | 0.365 | 0.077 | 32.1% | 12.8% | 17.9% | 62.4% | OF | $3,000 | OF | $4,200 | IF/OF | $8,000 |
| 3 | Aaron Altherr | RIGHT | 0.340 | 0.335 | 0.220 | 33.3% | 10.7% | 18.4% | 50.0% | OF | $2,900 | OF | $3,700 | LF | $7,200 |
| 4 | Tommy Joseph | RIGHT | 0.354 | 0.367 | 0.295 | 31.8% | 9.0% | 21.9% | 38.3% | 1B | $3,300 | 1B | $3,600 | 1B | $7,200 |
| 5 | Maikel Franco | RIGHT | 0.331 | 0.347 | 0.208 | 36.7% | 6.6% | 15.3% | 46.0% | 3B | $2,900 | 3B | $2,600 | 3B | $5,100 |
| 6 | Cameron Rupp | RIGHT | 0.413 | 0.322 | 0.278 | 35.1% | 9.2% | 26.1% | 49.4% | C | $2,000 | C | $2,400 | C | $4,800 |
| 7 | Daniel Nava | SWITCH | 0.362 | 0.391 | 0.048 | 31.3% | 22.2% | 18.5% | 62.5% | OF | $2,500 | OF | $3,500 | LF | $6,800 |
| 8 | Freddy Galvis | SWITCH | 0.236 | 0.257 | 0.115 | 24.9% | 1.9% | 17.7% | 40.7% | SS | $2,400 | SS | $2,400 | SS | $4,800 |
| 9 | Jeremy Hellickson | RIGHT | 0.200 | 0.202 | 0.000 | 7.1% | 4.2% | 37.5% | 54.5% | P | $6,500 | P | $5,000 | P | $9,900 |