MLB Grind Down: Sunday, September 24th

Jump to Page 1 2 3
The RotoGrinders MLB Grind Down will give you an in-depth analysis into the upcoming MLB schedule. This article will break down the numbers for every single game and give you analysis on which trends you can exploit. While matchups are a major factor in daily fantasy baseball, there are plenty of other factors to consider such as injuries, weather, and salaries.
The analysis should point you in the right direction, but it is still up to you to decipher the information and make your own selections. No sport has more variance than baseball. The best choice is not always the right choice but following the trends will win you money over time.
Note: As always, if you want to try a new DFS site, be sure to click through a RotoGrinders link and use our DraftKings promo code, FanDuel promo code, and FantasyDraft promo code to receive the best perks in the industry.
Stackability Rating System:
GREEN – A viable full stack in cash games and GPPs.
YELLOW – A viable mini-stack in cash games and full stack in GPPs.
ORANGE – A viable stack in large field GPPs.
RED – Not a recommended stack for cash games or GPPs.
Minnesota at Detroit – 12:10 PM ET
| Minnesota | Detroit | ||||||||||||||
 | Jose Berrios |  | Buck Farmer | ||||||||||||
| RIGHT | RIGHT | ||||||||||||||
| Vegas Moneyline | Vegas Over/Under | ||||||||||||||
| MIN-150 | 10.0 | ||||||||||||||
| Stats | wOBA | xwOBA | HC% | BB% | K% | GB% | Stats | wOBA | xwOBA | HC% | BB% | K% | GB% | ||
|---|---|---|---|---|---|---|---|---|---|---|---|---|---|---|---|
| SP vs. Left (2016-17) | 0.336 | 0.342 | 32.8% | 11.6% | 20.7% | 35.6% | SP vs. Left (2016-17) | 0.361 | 0.260 | 20.4% | 9.8% | 23.2% | 27.8% | ||
| SP vs. Right (2016-17) | 0.275 | 0.264 | 23.8% | 4.5% | 24.0% | 42.7% | SP vs. Right (2016-17) | 0.355 | 0.333 | 33.3% | 5.6% | 24.4% | 37.3% | ||
Pitcher Grind Down
| Jose Berrios | |||||||||
 | FanDuel | DraftKings | FantasyDraft | ||||||
| Salary: | $8,100 | Salary: | $9,700 | Salary: | |||||
| Salary Rank: | 10 of 30 | Salary Rank: | 6 of 30 | Salary Rank: | of 30 | ||||
| Stats | Starts | SIERA | ERA | K% | BB% | GB% | HC% | SC% | |
|---|---|---|---|---|---|---|---|---|---|
| 2016 | 14 | 5.36 | 8.02 | 17.4% | 12.5% | 38.0% | 33.3% | 18.2% | |
| 2017 | 24 | 4.30 | 3.94 | 22.5% | 7.8% | 39.4% | 28.0% | 19.9% | |
| L30 | 6 | 4.26 | 3.78 | 25.2% | 10.2% | 41.8% | 29.0% | 15.1% | |
It has been an up and down season for Berrios, but he has been slightly improved in the second half. The bad news is that his strikeout rate really hasn’t been on the rise, and his rate for the season is merely league average at this point. He does draw a nice matchup against the Tigers here, but he is a little too expensive for my liking (especially on DK). I prefer other options.
Quick Breakdown: You can make a case for Berrios in a good matchup, but there are better options on the board.
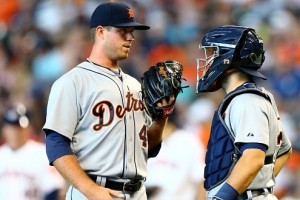
| Buck Farmer | |||||||||
 | FanDuel | DraftKings | FantasyDraft | ||||||
| Salary: | $5,600 | Salary: | $5,700 | Salary: | |||||
| Salary Rank: | 27 of 30 | Salary Rank: | 27 of 30 | Salary Rank: | of 30 | ||||
| Stats | Starts | SIERA | ERA | K% | BB% | GB% | HC% | SC% | |
|---|---|---|---|---|---|---|---|---|---|
| 2016 | 1 | 4.97 | 4.60 | 20.6% | 15.3% | 51.8% | 25.3% | 25.3% | |
| 2017 | 9 | 4.20 | 7.11 | 23.8% | 7.6% | 32.7% | 27.2% | 13.2% | |
| L30 | 5 | 5.01 | 7.52 | 19.6% | 9.3% | 30.3% | 22.7% | 10.6% | |
Farmer is a young pitcher with some promise, but the 2017 campaign hasn’t been kind to him. He has been the victim of a .330 BABIP, and he is not nearly as bad as his 7.11 ERA would indicate. However, he is not a fantasy option against a Twins offense that has been absolutely on fire of late.
Quick Breakdown: Farmer can safely be avoided in all formats.
Batter Grind Down
Minnesota
Projected Lineup (Splits vs. RH Pitching)
| # | Player | Bats | wOBA | xwOBA | ISO | HC% | BB% | K% | GB% | FD Pos. | FD Sal. | DK Pos. | DK Sal. | FDRFT Pos. | FDRFT Sal. |
|---|---|---|---|---|---|---|---|---|---|---|---|---|---|---|---|
| 1 | Brian Dozier | RIGHT | 0.325 | 0.313 | 0.193 | 32.4% | 10.1% | 20.4% | 39.0% | 2B | $4,100 | 2B | $5,000 | N/A | N/A |
| 2 | Joe Mauer | LEFT | 0.357 | 0.393 | 0.130 | 41.0% | 12.0% | 13.4% | 49.8% | 1B | $3,700 | 1B | $4,700 | N/A | N/A |
| 3 | Jorge Polanco | SWITCH | 0.314 | 0.286 | 0.148 | 26.6% | 9.0% | 14.5% | 39.1% | SS | $3,700 | SS | $4,300 | N/A | N/A |
| 4 | Eddie Rosario | LEFT | 0.375 | 0.341 | 0.267 | 33.0% | 7.2% | 17.4% | 38.4% | OF | $3,700 | OF | $5,100 | N/A | N/A |
| 5 | Eduardo Escobar | SWITCH | 0.324 | 0.319 | 0.213 | 32.7% | 6.3% | 19.9% | 34.2% | 3B | $3,000 | 3B/SS | $3,600 | N/A | N/A |
| 6 | Max Kepler | LEFT | 0.354 | 0.325 | 0.216 | 36.0% | 9.3% | 16.5% | 41.2% | OF | $2,800 | OF | $3,600 | N/A | N/A |
| 7 | Byron Buxton | RIGHT | 0.299 | 0.267 | 0.173 | 27.4% | 6.2% | 30.8% | 40.9% | OF | $3,300 | OF | $4,700 | N/A | N/A |
| 8 | Jason Castro | LEFT | 0.309 | 0.316 | 0.154 | 34.6% | 12.8% | 29.2% | 40.9% | C | $2,500 | C | $3,000 | N/A | N/A |
| 9 | Robbie Grossman | SWITCH | 0.334 | 0.341 | 0.163 | 29.9% | 13.7% | 18.8% | 39.3% | OF | $3,100 | OF | $3,200 | N/A | N/A |
The Twins rank 3rd in the league in wOBA and 4th in ISO in the second half, and they are bulldozing their way to a wild card spot in the American League. They have a fine matchup today against Buck Farmer, so feel free to ride the wave with a red hot team. Farmer has allowed a .355 wOBA to RHBs and a .361 wOBA to LHBs, and a full stack is also in play.
Elite Plays – Brian Dozier, Max Kepler, Eddie Rosario
Secondary Plays – Jorge Polanco, Byron Buxton
Stackability – GREEN / YELLOW
Detroit
Projected Lineup (Splits vs. RH Pitching)
| # | Player | Bats | wOBA | xwOBA | ISO | HC% | BB% | K% | GB% | FD Pos. | FD Sal. | DK Pos. | DK Sal. | FDRFT Pos. | FDRFT Sal. |
|---|---|---|---|---|---|---|---|---|---|---|---|---|---|---|---|
| 1 | Ian Kinsler | RIGHT | 0.293 | 0.314 | 0.145 | 35.3% | 8.7% | 14.3% | 35.1% | 2B | $3,400 | 2B | $3,300 | N/A | N/A |
| 2 | Alex Presley | LEFT | 0.343 | 0.312 | 0.107 | 29.2% | 5.0% | 17.9% | 45.0% | OF | $2,900 | OF | $3,100 | N/A | N/A |
| 3 | Miguel Cabrera | RIGHT | 0.291 | 0.374 | 0.146 | 42.4% | 8.8% | 20.4% | 40.3% | 1B | $2,500 | 1B | $3,100 | N/A | N/A |
| 4 | Nick Castellanos | RIGHT | 0.324 | 0.355 | 0.188 | 43.2% | 6.1% | 22.6% | 36.2% | OF | $3,900 | 3B/OF | $3,400 | N/A | N/A |
| 5 | Jeimer Candelario | SWITCH | 0.353 | 0.336 | 0.167 | 27.3% | 12.4% | 18.6% | 45.5% | 3B | $3,400 | 3B | $3,400 | N/A | N/A |
| 6 | Mikie Mahtook | RIGHT | 0.337 | 0.302 | 0.162 | 35.6% | 6.7% | 21.4% | 49.4% | OF | $3,000 | OF | $3,500 | N/A | N/A |
| 7 | James McCann | RIGHT | 0.293 | 0.301 | 0.127 | 38.9% | 6.3% | 27.7% | 38.5% | C | $2,300 | C | $3,000 | N/A | N/A |
| 8 | JaCoby Jones | RIGHT | 0.234 | 0.238 | 0.086 | 31.3% | 7.8% | 36.7% | 53.2% | OF | $2,200 | OF | $2,600 | N/A | N/A |
| 9 | Jose Iglesias | RIGHT | 0.288 | 0.264 | 0.122 | 28.6% | 4.6% | 14.5% | 52.2% | SS | $2,200 | SS | $2,500 | N/A | N/A |
Jose Berrios has been borderline dominant against RHBs at times this year, though his numbers have leveled off on that front. Where he can be attacked is with lefties, as they have posted a .336 wOBA against him this year. The problem is that there aren’t a whole lot of exciting lefties on this Detroit team. Miguel Cabrera left yesterday’s game early with his chronic back issue, and I do not expect him to play today. Efren Navarro took his place and ended up hitting two home runs, so perhaps he is the strong play here.
Elite Plays – None
Secondary Plays – Jeimer Candelario, Alex Presley, Efren Navarro (if he is in for Cabrera today)
Stackability – YELLOW / ORANGE
NY Yankees at Toronto – 1:07 PM ET
| NY Yankees | Toronto | ||||||||||||||
 | Jaime Garcia |  | Marcus Stroman | ||||||||||||
| LEFT | RIGHT | ||||||||||||||
| Vegas Moneyline | Vegas Over/Under | ||||||||||||||
| TBD | |||||||||||||||
| Stats | wOBA | xwOBA | HC% | BB% | K% | GB% | Stats | wOBA | xwOBA | HC% | BB% | K% | GB% | ||
|---|---|---|---|---|---|---|---|---|---|---|---|---|---|---|---|
| SP vs. Left (2016-17) | 0.290 | 0.238 | 25.7% | 3.5% | 26.2% | 59.2% | SP vs. Left (2016-17) | 0.291 | 0.312 | 30.5% | 8.5% | 18.9% | 65.8% | ||
| SP vs. Right (2016-17) | 0.328 | 0.338 | 31.5% | 10.9% | 16.9% | 54.6% | SP vs. Right (2016-17) | 0.320 | 0.303 | 31.3% | 6.1% | 21.4% | 58.5% | ||
Pitcher Grind Down
| Jaime Garcia | |||||||||
 | FanDuel | DraftKings | FantasyDraft | ||||||
| Salary: | $6,700 | Salary: | $7,200 | Salary: | $14,400 | ||||
| Salary Rank: | 18 of 30 | Salary Rank: | 17 of 30 | Salary Rank: | 14 of 30 | ||||
| Stats | Starts | SIERA | ERA | K% | BB% | GB% | HC% | SC% | |
|---|---|---|---|---|---|---|---|---|---|
| 2016 | 30 | 3.93 | 4.67 | 20.2% | 7.7% | 56.7% | 31.1% | 18.6% | |
| 2017 | 26 | 4.49 | 4.19 | 19.0% | 9.3% | 55.6% | 30.3% | 20.8% | |
| L30 | 4 | 3.59 | 1.86 | 23.5% | 8.2% | 60.3% | 31.0% | 13.8% | |
Garcia tends to be somewhat chalky at the strangest times, especially when he draws a decent matchup. Today might qualify as one, as the Blue Jays have a relatively weak offense these days. They rank just 25th in the league in team wOBA in the second half. I don’t really see the appeal in targeting a league average pitcher in a hitter-friendly park, especially one with a 19% strikeout rate. He’s not necessarily a bad option, but he is not an elite option, either.
Quick Breakdown: Garcia is a relatively safe play that you could consider as an SP #2 choice for cash games on multi-pitcher sites, but there isn’t a whole lot of upside here.
| Marcus Stroman | |||||||||
 | FanDuel | DraftKings | FantasyDraft | ||||||
| Salary: | $8,300 | Salary: | $8,900 | Salary: | $17,200 | ||||
| Salary Rank: | 9 of 30 | Salary Rank: | 9 of 30 | Salary Rank: | 8 of 30 | ||||
| Stats | Starts | SIERA | ERA | K% | BB% | GB% | HC% | SC% | |
|---|---|---|---|---|---|---|---|---|---|
| 2016 | 32 | 3.62 | 4.37 | 19.4% | 6.3% | 60.1% | 31.8% | 18.3% | |
| 2017 | 31 | 3.77 | 3.01 | 20.2% | 7.2% | 61.8% | 30.9% | 20.9% | |
| L30 | 6 | 3.44 | 3.09 | 22.0% | 5.3% | 58.3% | 36.5% | 16.7% | |
Stroman is one of those pitchers that is a better real life pitcher than a fantasy player. His ERA is almost under 3.00 for the year, and he is an elite ground ball arm. He has posted ground ball rates of 60% or better in each of the last three seasons. Unfortunately, he just doesn’t rack up a lot of strikeouts, so the DFS upside is capped. That makes it difficult to endorse him, especially in a matchup against a potent Yankees offense. I’ll pass today.
Quick Breakdown: Stroman is difficult to trust in DFS because of his limited strikeout upside. He can be avoided in a tough matchup against the Yankees.
Batter Grind Down
NY Yankees
Projected Lineup (Splits vs. RH Pitching)
| # | Player | Bats | wOBA | xwOBA | ISO | HC% | BB% | K% | GB% | FD Pos. | FD Sal. | DK Pos. | DK Sal. | FDRFT Pos. | FDRFT Sal. |
|---|---|---|---|---|---|---|---|---|---|---|---|---|---|---|---|
| 1 | Jacoby Ellsbury | LEFT | 0.362 | 0.344 | 0.167 | 26.1% | 12.0% | 10.9% | 45.7% | OF | $4,000 | OF | $4,100 | CF | $8,100 |
| 2 | Aaron Judge | RIGHT | 0.420 | 0.427 | 0.326 | 43.1% | 16.2% | 31.4% | 35.6% | OF | $4,800 | OF | $5,700 | RF | $11,200 |
| 3 | Gary Sanchez | RIGHT | 0.372 | 0.371 | 0.253 | 35.2% | 6.7% | 23.3% | 43.9% | C | $3,400 | C | $5,000 | C | $9,900 |
| 4 | Didi Gregorius | LEFT | 0.366 | 0.289 | 0.246 | 25.9% | 4.9% | 11.9% | 37.7% | SS | $3,500 | SS | $4,100 | SS | $8,000 |
| 5 | Starlin Castro | RIGHT | 0.327 | 0.294 | 0.158 | 29.0% | 3.3% | 20.1% | 49.6% | 2B | $2,800 | 2B | $3,700 | 2B | $7,200 |
| 6 | Matt Holliday | RIGHT | 0.306 | 0.328 | 0.193 | 30.6% | 9.9% | 26.3% | 48.0% | OF | $2,900 | 1B | $3,500 | IF/OF | $6,800 |
| 7 | Chase Headley | SWITCH | 0.347 | 0.323 | 0.133 | 32.3% | 12.2% | 23.7% | 43.1% | 1B | $3,500 | 1B/3B | $3,400 | 3B | $6,800 |
| 8 | Todd Frazier | RIGHT | 0.325 | 0.342 | 0.179 | 29.8% | 14.5% | 22.2% | 37.7% | 3B | $3,700 | 3B | $3,500 | 3B | $6,900 |
| 9 | Clint Frazier | RIGHT | 0.306 | 0.321 | 0.215 | 43.9% | 6.0% | 28.0% | 39.4% | OF | $2,200 | OF | $3,300 | CF | $6,600 |
While I do not love Marcus Stroman as a pitching options, it is also impossible to recommend loading up on hitters against him. Stroman gets a ton of ground balls, doesn’t give up a lot of runs, and rarely gets blown up. There are better offenses to target on a full slate.
Elite Plays – None
Secondary Plays – Gary Sanchez, Didi Gregorius
Stackability – ORANGE / RED
Toronto
Projected Lineup (Splits vs. LH Pitching)
| # | Player | Bats | wOBA | xwOBA | ISO | HC% | BB% | K% | GB% | FD Pos. | FD Sal. | DK Pos. | DK Sal. | FDRFT Pos. | FDRFT Sal. |
|---|---|---|---|---|---|---|---|---|---|---|---|---|---|---|---|
| 1 | Teoscar Hernandez | RIGHT | 0.063 | 0.000 | 25.0% | 0.0% | 42.9% | 25.0% | OF | $2,500 | OF | $2,500 | CF | $4,800 | |
| 2 | Josh Donaldson | RIGHT | 0.399 | 0.393 | 0.324 | 39.7% | 16.9% | 18.0% | 39.7% | 3B | $3,600 | 3B | $4,500 | 3B | $8,700 |
| 3 | Justin Smoak | SWITCH | 0.431 | 0.416 | 0.248 | 36.7% | 13.6% | 12.1% | 35.7% | 1B | $2,800 | 1B | $3,900 | 1B | $7,800 |
| 4 | Jose Bautista | RIGHT | 0.265 | 0.252 | 0.132 | 22.2% | 10.8% | 27.0% | 46.7% | OF | $3,000 | OF | $3,400 | RF | $6,800 |
| 5 | Kendrys Morales | SWITCH | 0.408 | 0.369 | 0.223 | 42.6% | 6.2% | 21.5% | 58.5% | 1B | $2,900 | 1B | $3,100 | 1B | $6,000 |
| 6 | Kevin Pillar | RIGHT | 0.391 | 0.347 | 0.226 | 29.9% | 6.7% | 14.1% | 37.9% | OF | $2,800 | OF | $2,900 | CF | $5,700 |
| 7 | Darwin Barney | RIGHT | 0.281 | 0.260 | 0.043 | 14.8% | 9.3% | 21.7% | 48.3% | 2B | $2,700 | 2B/3B | $2,700 | 2B | $5,400 |
| 8 | Luke Maile | RIGHT | 0.197 | 0.186 | 0.050 | 28.6% | 2.4% | 28.6% | 51.9% | C | $2,200 | C | $2,200 | C | $4,100 |
| 9 | Richard Urena | SWITCH | 0.326 | 0.000 | 40.0% | 13.3% | 20.0% | 30.0% | SS | $2,300 | SS | $3,100 | SS | $6,000 |
This is definitely a game that you can avoid on both sides. Neither pitcher brings a ton of upside to the table, but both guys do a decent job at preventing runs, and both get a very high number of ground balls. Garcia has had a reputation as a reverse splits pitcher in the past, but that has not held true this year. I don’t love a whole lot here, but Josh Donaldson would be my preferred option as a one-off play, and Teoscar Hernandez has some appeal if he hits leadoff again.
Elite Plays – Josh Donaldson
Secondary Plays – Teoscar Hernandez
Stackability – ORANGE
Boston at Cincinnati – 1:10 PM ET
| Boston | Cincinnati | ||||||||||||||
 | Doug Fister |  | Jackson Stephens | ||||||||||||
| RIGHT | RIGHT | ||||||||||||||
| Vegas Moneyline | Vegas Over/Under | ||||||||||||||
| BOS-117 | 10.0 | ||||||||||||||
| Stats | wOBA | xwOBA | HC% | BB% | K% | GB% | Stats | wOBA | xwOBA | HC% | BB% | K% | GB% | ||
|---|---|---|---|---|---|---|---|---|---|---|---|---|---|---|---|
| SP vs. Left (2016-17) | 0.369 | 0.348 | 38.8% | 12.8% | 18.9% | 48.7% | SP vs. Left (2016-17) | 0.345 | 0.280 | 35.7% | 4.8% | 23.8% | 50.0% | ||
| SP vs. Right (2016-17) | 0.243 | 0.280 | 25.6% | 8.4% | 21.0% | 52.6% | SP vs. Right (2016-17) | 0.319 | 0.361 | 24.1% | 7.5% | 20.0% | 20.7% | ||
Pitcher Grind Down
| Doug Fister | |||||||||
 | FanDuel | DraftKings | FantasyDraft | ||||||
| Salary: | $7,200 | Salary: | $7,400 | Salary: | $14,700 | ||||
| Salary Rank: | 14 of 30 | Salary Rank: | 15 of 30 | Salary Rank: | 13 of 30 | ||||
| Stats | Starts | SIERA | ERA | K% | BB% | GB% | HC% | SC% | |
|---|---|---|---|---|---|---|---|---|---|
| 2016 | 32 | 4.97 | 4.64 | 14.8% | 8.0% | 45.3% | 31.5% | 19.7% | |
| 2017 | 13 | 4.73 | 4.86 | 19.9% | 10.7% | 50.6% | 32.4% | 18.5% | |
| L30 | 5 | 4.19 | 5.00 | 21.4% | 10.3% | 60.8% | 26.3% | 27.5% | |
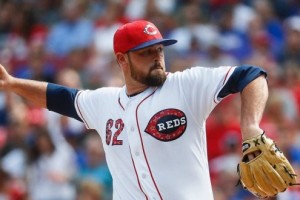
Fister has long been a regression candidate this year, and I am absolutely surprised that he has been a somewhat popular option in his last two starts. Those that took a shot on him in those outings have been let down, as he has allowed eleven runs over his last six innings. He has six walks and four strikeouts in that span. He is not a fantasy option on the road against a capable Reds offense.
Quick Breakdown: Fister can safely be avoided in all formats.
| Jackson Stephens | |||||||||
 | FanDuel | DraftKings | FantasyDraft | ||||||
| Salary: | $5,500 | Salary: | $5,300 | Salary: | $10,400 | ||||
| Salary Rank: | 28 of 30 | Salary Rank: | 29 of 30 | Salary Rank: | 25 of 30 | ||||
| Stats | Starts | SIERA | ERA | K% | BB% | GB% | HC% | SC% | |
|---|---|---|---|---|---|---|---|---|---|
| 2017 | 2 | 4.37 | 4.80 | 21.3% | 6.6% | 30.2% | 27.9% | 25.6% | |
| L30 | 1 | 5.53 | 4.50 | 12.5% | 7.5% | 35.5% | 22.6% | 32.3% | |
Stephens will be making just his third major league start today. He has an unimpressive minor league profile and got hammered by the Cardinals for five runs in 3 2/3 innings in his last outing. Needless to say, he is nowhere near the fantasy radar in a matchup against the playoff-bound Red Sox.
Quick Breakdown: Stephens can safely be avoided in all formats.
Batter Grind Down
Boston
Projected Lineup (Splits vs. RH Pitching)
| # | Player | Bats | wOBA | xwOBA | ISO | HC% | BB% | K% | GB% | FD Pos. | FD Sal. | DK Pos. | DK Sal. | FDRFT Pos. | FDRFT Sal. |
|---|---|---|---|---|---|---|---|---|---|---|---|---|---|---|---|
| 1 | Xander Bogaerts | RIGHT | 0.312 | 0.273 | 0.130 | 30.7% | 8.2% | 18.7% | 47.1% | SS | $3,400 | SS | $4,600 | SS | $8,800 |
| 2 | Andrew Benintendi | LEFT | 0.350 | 0.343 | 0.181 | 37.1% | 9.6% | 16.8% | 36.9% | OF | $4,000 | OF | $4,900 | LF | $9,600 |
| 3 | Mookie Betts | RIGHT | 0.326 | 0.331 | 0.187 | 35.4% | 9.5% | 11.7% | 39.6% | OF | $4,500 | OF | $5,400 | RF | $10,500 |
| 4 | Mitch Moreland | LEFT | 0.326 | 0.377 | 0.201 | 39.7% | 9.7% | 20.6% | 41.1% | 1B | $2,900 | 1B | $3,700 | 1B | $7,200 |
| 5 | Christian Vazquez | RIGHT | 0.321 | 0.284 | 0.109 | 27.9% | 4.9% | 19.3% | 46.2% | C | $2,700 | C | $3,500 | C | $6,900 |
| 6 | Rafael Devers | LEFT | 0.302 | 0.285 | 0.170 | 33.3% | 7.2% | 21.7% | 51.4% | 3B | $3,500 | 3B | $3,900 | 3B | $7,600 |
| 7 | Sam Travis | RIGHT | 0.163 | 0.227 | 0.037 | 50.0% | 3.6% | 39.3% | 68.8% | 1B | $2,100 | 1B | $3,000 | 1B | $6,000 |
| 8 | Brock Holt | LEFT | 0.235 | 0.238 | 0.049 | 22.7% | 11.8% | 24.4% | 57.3% | 2B | $2,100 | 2B/OF | $2,400 | 3B | $4,800 |
| 9 | Jackie Bradley Jr. | LEFT | 0.315 | 0.322 | 0.177 | 37.0% | 8.3% | 24.0% | 43.1% | OF | $3,300 | OF | $3,700 | CF | $7,200 |
This will be one of the better games for offense today, as we have a Vegas total of ten runs and a matchup between two mediocre pitchers in a hitter-friendly environment. Fire up your stacks on either side. Jackson Stephens had awful numbers against left-handed hitters in the minors, so the lefties get preference for the Red Sox. However, everyone is in play.
Elite Plays – Andrew Benintendi, Mitch Moreland, Rafael Devers, Mookie Betts, Brock Holt (value if he starts)
Secondary Plays – Xander Bogaerts
Stackability – GREEN
Cincinnati
Projected Lineup (Splits vs. RH Pitching)
| # | Player | Bats | wOBA | xwOBA | ISO | HC% | BB% | K% | GB% | FD Pos. | FD Sal. | DK Pos. | DK Sal. | FDRFT Pos. | FDRFT Sal. |
|---|---|---|---|---|---|---|---|---|---|---|---|---|---|---|---|
| 1 | Scott Schebler | LEFT | 0.338 | 0.358 | 0.270 | 41.1% | 10.1% | 23.9% | 43.6% | OF | $3,000 | OF | $3,800 | RF | $7,500 |
| 2 | Zack Cozart | RIGHT | 0.378 | 0.324 | 0.245 | 30.0% | 11.7% | 16.0% | 38.1% | SS | $3,700 | SS | $4,400 | SS | $8,400 |
| 3 | Joey Votto | LEFT | 0.428 | 0.433 | 0.254 | 38.2% | 19.0% | 10.2% | 37.3% | 1B | $4,100 | 1B | $5,200 | 1B | $10,000 |
| 4 | Scooter Gennett | LEFT | 0.389 | 0.331 | 0.263 | 36.8% | 6.4% | 20.7% | 39.8% | 2B | $3,400 | 2B | $4,200 | 2B | $8,100 |
| 5 | Jesse Winker | LEFT | 0.420 | 0.360 | 0.250 | 33.3% | 12.7% | 16.7% | 54.9% | OF | $2,900 | OF | $3,700 | LF | $7,200 |
| 6 | Phillip Ervin | RIGHT | 0.320 | 0.261 | 0.270 | 25.0% | 4.9% | 24.4% | 40.7% | OF | $2,300 | OF | $3,900 | CF | $7,800 |
| 7 | Tucker Barnhart | SWITCH | 0.325 | 0.332 | 0.130 | 34.7% | 9.8% | 16.0% | 43.8% | C | $2,800 | C | $2,800 | C | $5,600 |
| 8 | Patrick Kivlehan | RIGHT | 0.289 | 0.268 | 0.184 | 34.3% | 10.9% | 31.1% | 35.8% | OF | $2,300 | OF | $2,700 | IF/OF | $5,400 |
| 9 | Jackson Stephens | RIGHT | 0.292 | 0.000 | 0.0% | 0.0% | 33.3% | 100.0% | P | $5,500 | P | $5,300 | P | $10,400 |
Doug Fister has very clear splits this year. He has held RHBs to a very low .241 wOBA, but that number spikes to an ugly .369 against LHBs. The clear path is to stack left-handers against him, and Joey Votto is one of the best overall plays on today’s slate. The Reds are a sneaky stack here against a struggling pitcher, especially since you may see up to five lefties in the lineup.
Elite Plays – Joey Votto, Scooter Gennett, Scott Schebler
Secondary Plays – Jesse Winker
Stackability – YELLOW / GREEN
Washington at NY Mets – 1:10 PM ET
| Washington | NY Mets | ||||||||||||||
 | Max Scherzer |  | Jacob deGrom | ||||||||||||
| RIGHT | RIGHT | ||||||||||||||
| Vegas Moneyline | Vegas Over/Under | ||||||||||||||
| WAS-150 | 7.0 | ||||||||||||||
| Stats | wOBA | xwOBA | HC% | BB% | K% | GB% | Stats | wOBA | xwOBA | HC% | BB% | K% | GB% | ||
|---|---|---|---|---|---|---|---|---|---|---|---|---|---|---|---|
| SP vs. Left (2016-17) | 0.300 | 0.288 | 27.3% | 9.0% | 26.2% | 33.2% | SP vs. Left (2016-17) | 0.297 | 0.291 | 31.6% | 8.4% | 25.1% | 44.7% | ||
| SP vs. Right (2016-17) | 0.192 | 0.192 | 26.7% | 4.9% | 42.9% | 42.5% | SP vs. Right (2016-17) | 0.287 | 0.262 | 32.5% | 6.4% | 31.5% | 46.2% | ||
Pitcher Grind Down
| Max Scherzer | |||||||||
 | FanDuel | DraftKings | FantasyDraft | ||||||
| Salary: | $10,800 | Salary: | $12,900 | Salary: | $25,200 | ||||
| Salary Rank: | 3 of 30 | Salary Rank: | 3 of 30 | Salary Rank: | 3 of 30 | ||||
| Stats | Starts | SIERA | ERA | K% | BB% | GB% | HC% | SC% | |
|---|---|---|---|---|---|---|---|---|---|
| 2016 | 34 | 3.05 | 2.96 | 31.5% | 6.2% | 33.0% | 30.1% | 22.2% | |
| 2017 | 29 | 3.02 | 2.59 | 33.9% | 7.1% | 37.1% | 27.0% | 19.8% | |
| L30 | 5 | 4.39 | 4.35 | 25.4% | 10.8% | 32.5% | 21.0% | 19.8% | |
This should be a dynamic pitchers’ duel between two aces, and we have a very low Vegas total of seven runs in this game. Scherzer is the top pitcher on the board almost every time he pitches by default, and that doesn’t change today. The Mets are definitely an offense we can attack with pitchers, though they have been surprisingly respectable at the dish with their watered-down lineup. That doesn’t concern me with Scherzer, though. His 3.02 SIERA, 27% hard contact rate allowed, and 33.9% strikeout rate are clearly the best you will find on today’s slate, and the Mets have an implied team run total of just 3.1 runs. I have some concerns over a monitored pitch count with this game being relatively pointless for the Nationals, so keep an eye out for potential news on that front. In the absence of that, Scherzer is the top pitching option this afternoon.
Quick Breakdown: Assuming we don’t hear anything about a pitch count, Scherzer is the top pitching choice today.
| Jacob deGrom | |||||||||
 | FanDuel | DraftKings | FantasyDraft | ||||||
| Salary: | $10,400 | Salary: | $11,200 | Salary: | $21,600 | ||||
| Salary Rank: | 4 of 30 | Salary Rank: | 4 of 30 | Salary Rank: | 4 of 30 | ||||
| Stats | Starts | SIERA | ERA | K% | BB% | GB% | HC% | SC% | |
|---|---|---|---|---|---|---|---|---|---|
| 2016 | 24 | 3.66 | 3.04 | 23.7% | 6.0% | 45.6% | 31.3% | 19.0% | |
| 2017 | 30 | 3.52 | 3.55 | 28.4% | 7.3% | 45.5% | 32.0% | 21.0% | |
| L30 | 5 | 3.55 | 3.86 | 28.5% | 8.5% | 48.8% | 23.2% | 23.2% | |
It has been a strange up and down year for deGrom, but he has looked much better over his last two outings. In those starts, he has allowed just three runs over 13 innings, and he has 17 strikeouts in that span. The Nationals are rolling out watered-down lineups these days with nothing to play for, so that also upgrades deGrom’s matchup. I would expect a strange lineup again today, especially since this is a day game after a night game. His overall profile doesn’t quite match up to Scherzer’s, but it is still very good with a 3.52 SIERA and 28% strikeout rate. He has held both LHBs and RHBs to a sub-.300 wOBA. deGrom is certainly in the conversation today, though he doesn’t come at a massive discount to Scherzer.
Quick Breakdown: With potential concerns over a pitch limit with Scherzer, you can certainly make a case to pivot over to deGrom today. This game should be a fun pitchers’ duel to watch.
Batter Grind Down
Washington
Projected Lineup (Splits vs. RH Pitching)
| # | Player | Bats | wOBA | xwOBA | ISO | HC% | BB% | K% | GB% | FD Pos. | FD Sal. | DK Pos. | DK Sal. | FDRFT Pos. | FDRFT Sal. |
|---|---|---|---|---|---|---|---|---|---|---|---|---|---|---|---|
| 1 | Wilmer Difo | SWITCH | 0.272 | 0.267 | 0.070 | 21.2% | 6.7% | 22.1% | 54.7% | SS | $2,200 | 2B/SS | $3,100 | 2B | $6,000 |
| 2 | Alejandro De Aza | LEFT | 0.180 | 0.199 | 0.057 | 25.0% | 5.1% | 33.3% | 40.9% | OF | $2,200 | OF | $2,800 | CF | $5,600 |
| 3 | Howie Kendrick | RIGHT | 0.351 | 0.302 | 0.138 | 29.0% | 5.6% | 21.5% | 63.3% | OF | $2,900 | 2B/OF | $3,500 | IF/OF | $6,800 |
| 4 | Adam Lind | LEFT | 0.363 | 0.374 | 0.216 | 39.1% | 8.7% | 15.7% | 45.3% | OF | $3,000 | 1B/OF | $3,700 | 1B | $7,200 |
| 5 | Victor Robles | RIGHT | 0.548 | 0.429 | 28.6% | 0.0% | 0.0% | 71.4% | OF | $2,300 | OF | $2,300 | CF | $4,400 | |
| 6 | Rafael Bautista | RIGHT | 0.175 | 0.000 | 25.0% | 7.1% | 7.1% | 41.7% | OF | $2,200 | CF | $4,200 | |||
| 7 | Adrian Sanchez | RIGHT | 0.295 | 0.257 | 0.116 | 29.6% | 2.2% | 37.8% | 48.0% | 2B | $2,000 | 2B/SS | $2,500 | SS | $4,800 |
| 8 | Pedro Severino | RIGHT | 0.187 | 0.063 | 20.0% | 0.0% | 37.5% | 50.0% | C | $2,300 | C | $4,500 | |||
| 9 | Max Scherzer | RIGHT | 0.205 | 0.213 | 0.000 | 17.8% | 7.0% | 14.0% | 67.5% | P | $10,800 | P | $12,900 | P | $25,200 |
This is the worst game to target hitters from today. Don’t do it.
Elite Plays – None
Secondary Plays – None
Stackability – RED
NY Mets
Projected Lineup (Splits vs. RH Pitching)
| # | Player | Bats | wOBA | xwOBA | ISO | HC% | BB% | K% | GB% | FD Pos. | FD Sal. | DK Pos. | DK Sal. | FDRFT Pos. | FDRFT Sal. |
|---|---|---|---|---|---|---|---|---|---|---|---|---|---|---|---|
| 1 | Norichika Aoki | LEFT | 0.325 | 0.294 | 0.139 | 24.9% | 6.6% | 12.1% | 54.5% | OF | $3,100 | OF | $2,900 | LF | $5,600 |
| 2 | Jose Reyes | SWITCH | 0.297 | 0.289 | 0.146 | 27.0% | 9.0% | 14.0% | 38.1% | SS | $3,500 | 3B/SS | $3,200 | SS | $6,300 |
| 3 | Asdrubal Cabrera | SWITCH | 0.316 | 0.332 | 0.176 | 38.0% | 9.7% | 16.8% | 41.0% | 3B | $3,300 | 2B/SS | $3,000 | SS | $6,000 |
| 4 | Brandon Nimmo | LEFT | 0.385 | 0.356 | 0.176 | 36.4% | 17.0% | 24.4% | 46.8% | OF | $3,000 | OF | $3,000 | LF | $6,000 |
| 5 | Travis d’Arnaud | RIGHT | 0.273 | 0.301 | 0.165 | 33.0% | 4.5% | 14.7% | 39.6% | C | $2,600 | C | $3,000 | C | $6,000 |
| 6 | Dominic Smith | LEFT | 0.304 | 0.325 | 0.225 | 37.2% | 5.1% | 21.2% | 51.2% | 1B | $2,900 | 1B | $2,900 | 1B | $5,700 |
| 7 | Amed Rosario | RIGHT | 0.273 | 0.230 | 0.121 | 23.9% | 1.9% | 31.1% | 47.8% | SS | $2,600 | SS | $2,800 | SS | $5,400 |
| 8 | Juan Lagares | RIGHT | 0.286 | 0.257 | 0.124 | 29.2% | 5.5% | 20.6% | 53.5% | OF | $2,800 | OF | $2,500 | CF | $4,800 |
| 9 | Jacob deGrom | RIGHT | 0.261 | 0.269 | 0.071 | 32.5% | 3.3% | 30.0% | 42.1% | P | $10,400 | P | $11,200 | P | $21,600 |
This is the worst game to target hitters from today. Don’t do it.
Elite Plays – None
Secondary Plays – None
Stackability – RED
Philadelphia at Atlanta – 1:35 PM ET
| Philadelphia | Atlanta | ||||||||||||||
 | Nick Pivetta |  | Luiz Gohara | ||||||||||||
| RIGHT | LEFT | ||||||||||||||
| Vegas Moneyline | Vegas Over/Under | ||||||||||||||
| ATL-135 | 9.5 | ||||||||||||||
| Stats | wOBA | xwOBA | HC% | BB% | K% | GB% | Stats | wOBA | xwOBA | HC% | BB% | K% | GB% | ||
|---|---|---|---|---|---|---|---|---|---|---|---|---|---|---|---|
| SP vs. Left (2016-17) | 0.317 | 0.296 | 29.1% | 10.5% | 25.3% | 42.9% | SP vs. Left (2016-17) | 0.214 | 20.0% | 11.1% | 33.3% | 40.0% | |||
| SP vs. Right (2016-17) | 0.414 | 0.365 | 42.4% | 8.5% | 22.7% | 44.1% | SP vs. Right (2016-17) | 0.397 | 0.284 | 27.7% | 4.8% | 20.6% | 33.3% | ||
Pitcher Grind Down
| Nick Pivetta | |||||||||
 | FanDuel | DraftKings | FantasyDraft | ||||||
| Salary: | $6,100 | Salary: | $6,600 | Salary: | $13,200 | ||||
| Salary Rank: | 25 of 30 | Salary Rank: | 21 of 30 | Salary Rank: | 18 of 30 | ||||
| Stats | Starts | SIERA | ERA | K% | BB% | GB% | HC% | SC% | |
|---|---|---|---|---|---|---|---|---|---|
| 2017 | 24 | 4.29 | 6.57 | 23.9% | 9.5% | 43.6% | 36.2% | 16.0% | |
| L30 | 5 | 3.76 | 6.00 | 23.5% | 8.4% | 60.0% | 27.2% | 14.8% | |
Pivetta has some promise in his future, but it has been an ugly 2017 campaign. He owns a 6.57 ERA and has allowed hard contact 36% of the time. While he is not as bad as the ERA would indicate, as his SIERA is two full runs better than that, there is still not a ton to get excited about here. He is not on the fantasy radar against the Braves, who have a team total over five runs today.
Quick Breakdown: Pivetta can safely be avoided in all formats.
| Luiz Gohara | |||||||||
 | FanDuel | DraftKings | FantasyDraft | ||||||
| Salary: | $6,400 | Salary: | $5,900 | Salary: | $11,600 | ||||
| Salary Rank: | 23 of 30 | Salary Rank: | 25 of 30 | Salary Rank: | 22 of 30 | ||||
| Stats | Starts | SIERA | ERA | K% | BB% | GB% | HC% | SC% | |
|---|---|---|---|---|---|---|---|---|---|
| 2017 | 3 | 4.21 | 6.06 | 22.2% | 5.6% | 34.0% | 26.9% | 17.3% | |
| L30 | 3 | 4.21 | 6.06 | 22.2% | 5.6% | 34.0% | 26.9% | 17.3% | |
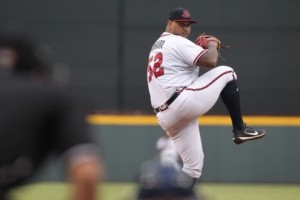
This is a really interesting spot, and I absolutely love Gohara as a SP #2 choice on DraftKings at a $5,900 price tag today. He has shown massive strikeout upside in the minors, and he hasn’t walked a single batter in his last two major league starts. His three outings have come against Texas and Washington (twice), so this is the most favorable matchup he has seen against a middling Phillies offense. There is certainly risk, as there is with any pitcher making just his fourth major league start, but I like the GPP upside here.
Quick Breakdown: It’s a tough sell in a single pitcher format, but Gohara is a young pitcher dripping with upside, and he makes a lot of sense for tournaments today.
Batter Grind Down
Philadelphia
Projected Lineup (Splits vs. LH Pitching)
| # | Player | Bats | wOBA | xwOBA | ISO | HC% | BB% | K% | GB% | FD Pos. | FD Sal. | DK Pos. | DK Sal. | FDRFT Pos. | FDRFT Sal. |
|---|---|---|---|---|---|---|---|---|---|---|---|---|---|---|---|
| 1 | Cesar Hernandez | SWITCH | 0.336 | 0.332 | 0.182 | 24.4% | 7.7% | 12.8% | 58.1% | 2B | $3,400 | 2B | $3,700 | 2B | $7,200 |
| 2 | Freddy Galvis | SWITCH | 0.275 | 0.263 | 0.099 | 21.9% | 3.2% | 11.6% | 39.7% | SS | $2,800 | SS | $3,500 | SS | $6,800 |
| 3 | Nick Williams | LEFT | 0.336 | 0.266 | 0.151 | 22.5% | 3.8% | 30.4% | 59.2% | OF | $3,400 | OF | $3,600 | LF | $7,200 |
| 4 | Rhys Hoskins | RIGHT | 0.484 | 0.511 | 0.563 | 52.0% | 28.3% | 15.2% | 32.0% | 1B | $4,200 | 1B/OF | $5,600 | 1B | $10,800 |
| 5 | Aaron Altherr | RIGHT | 0.350 | 0.353 | 0.270 | 39.0% | 10.7% | 16.1% | 46.3% | OF | $3,400 | OF | $4,600 | LF | $8,800 |
| 6 | Odubel Herrera | LEFT | 0.349 | 0.314 | 0.192 | 33.0% | 3.3% | 24.2% | 51.9% | OF | $3,100 | OF | $3,500 | IF/OF | $6,900 |
| 7 | Jorge Alfaro | RIGHT | 0.157 | 0.206 | 0.036 | 11.8% | 6.7% | 36.7% | 58.8% | C | $2,800 | C | $3,400 | C | $6,600 |
| 8 | J.P. Crawford | LEFT | 0.310 | 0.077 | 0.0% | 27.8% | 27.8% | 12.5% | SS | $2,800 | 3B/SS | $3,000 | SS | $6,000 | |
| 9 | Nick Pivetta | RIGHT | 0.000 | 0.000 | 12.5% | 0.0% | 46.7% | 75.0% | P | $6,100 | P | $6,600 | P | $13,200 |
The sample size is obviously very small, but I would expect Gohara to profile as your typical traditional splits lefty. In his first three outings, he has allowed a .214 wOBA to LHBs and a .397 wOBA to RHBs. If you decide to target hitters from the Phillies (which I won’t be doing), the RHBs are the strongest plays.
Elite Plays – Rhys Hoskins
Secondary Plays – Aaron Altherr
Stackability – YELLOW / ORANGE
Atlanta
Projected Lineup (Splits vs. RH Pitching)
| # | Player | Bats | wOBA | xwOBA | ISO | HC% | BB% | K% | GB% | FD Pos. | FD Sal. | DK Pos. | DK Sal. | FDRFT Pos. | FDRFT Sal. |
|---|---|---|---|---|---|---|---|---|---|---|---|---|---|---|---|
| 1 | Ender Inciarte | LEFT | 0.329 | 0.288 | 0.113 | 23.9% | 6.3% | 14.4% | 43.3% | OF | $3,600 | OF | $3,800 | CF | $7,500 |
| 2 | Ozzie Albies | SWITCH | 0.323 | 0.300 | 0.152 | 32.7% | 8.7% | 18.1% | 40.0% | 2B | $3,700 | 2B | $3,800 | 2B | $7,500 |
| 3 | Freddie Freeman | LEFT | 0.431 | 0.429 | 0.303 | 38.6% | 14.4% | 16.2% | 33.5% | 1B | $4,200 | 1B/3B | $5,100 | 1B | $10,000 |
| 4 | Nick Markakis | LEFT | 0.321 | 0.338 | 0.108 | 34.8% | 11.2% | 16.6% | 47.5% | OF | $3,000 | OF | $3,800 | RF | $7,600 |
| 5 | Kurt Suzuki | RIGHT | 0.319 | 0.314 | 0.178 | 31.4% | 5.4% | 14.0% | 35.9% | C | $3,800 | C | $4,000 | C | $7,800 |
| 6 | Johan Camargo | SWITCH | 0.284 | 0.270 | 0.098 | 26.8% | 4.9% | 20.1% | 50.4% | SS | $2,800 | 3B/SS | $3,300 | SS | $6,600 |
| 7 | Lane Adams | RIGHT | 0.387 | 0.362 | 0.237 | 42.2% | 7.7% | 23.1% | 46.7% | OF | $2,500 | OF | $2,400 | LF | $4,800 |
| 8 | Dansby Swanson | RIGHT | 0.268 | 0.285 | 0.091 | 27.4% | 10.5% | 22.3% | 48.9% | SS | $2,900 | SS | $2,400 | SS | $4,800 |
| 9 | Luiz Gohara | LEFT | 0.000 | 0.000 | 0.0% | 0.0% | 80.0% | 0.0% | P | $6,400 | P | $5,900 | P | $11,600 |
I keep waiting for Nick Pivetta to start to improve, but we still really haven’t seen it. He has also shown strong reverse splits this year, allowing a whopping .414 wOBA to RHBs. That goes along with a 42.4% hard contact rate. However, left-handed hitters have tagged him for a higher line drive rate, and that is the good news for a lefty-heavy Atlanta lineup. Hitters from both sides are in play here, as is the Atlanta stack.