MLB Grind Down: Thursday, June 30th
The RotoGrinders MLB Grind Down will give you an in-depth analysis into the upcoming MLB schedule. This article will break down the numbers for every single game and give you analysis on which trends you can exploit. While matchups are a major factor in daily fantasy baseball, there are plenty of other factors to consider such as injuries, weather, and salaries.
The analysis should point you in the right direction, but it is still up to you to decipher the information and make your own selections. No sport has more variance than baseball. The best choice is not always the right choice but following the trends will win you money over time.
Note: As always, if you want to try a new DFS site, be sure to click through a RotoGrinders link and use our DraftKings promo code and FanDuel promo code to receive the best perks in the industry.
Texas at NY Yankees – 1:05 PM ET
| Texas | NY Yankees |
 | |  | |
| RIGHT | RIGHT |
| Vegas Moneyline | Vegas Over/Under |
| NYY -133 | 9.0 |
| Stats | wOBA | HR All. | K% | BB% | Stats | wOBA | HR All. | K% | BB% |
| SP vs. Left | 0.288 | 2 | 18.2% | 10.4% | SP vs. Left | 0.330 | 13 | 24.2% | 4.9% |
| SP vs. Right | 0.253 | 1 | 25.6% | 9.0% | SP vs. Right | 0.338 | 22 | 24.4% | 3.2% |
Pitcher Grind Down
| A.J. Griffin |
 | FanDuel | DraftKings |
| Salary: | $8,000 | Salary: | $8,400 |
| FPPG: | 30.4 | FPPG: | 16.2 |
| Pitcher Rating: | 51.2 | Pitcher Rank: | 15 |
| Statistics | Starts | PitchPS | SIERA | ERA | K% | BB% | SS% | GB% | FB% | HH% |
| L30 Days | 1 | 91.0 | 2.88 | 4.15 | 33.3% | 5.6% | 7.7% | 27.3% | 54.5% | 18.2% |
| 2016 | 7 | 92.6 | 4.43 | 3.08 | 21.9% | 9.7% | 8.3% | 36.8% | 44.3% | 34.0% |
Griffin has made seven starts this season, posting a 4.43 SIERA with a strikeout rate of 21.9%. He has pitched well thus far, but sports a career 4.25 SIERA. He checks into today’s game as an underdog on the road in a game that features an over/under of 9.0 runs. The Yankees aren’t a feared offense like they used to be, but they are certainly capable of putting up runs at home in this matchup.
| Michael Pineda |
 | FanDuel | DraftKings |
| Salary: | $8,800 | Salary: | $7,800 |
| FPPG: | 28.1 | FPPG: | 14.4 |
| Pitcher Rating: | 73.6 | Pitcher Rank: | 7 |
| Statistics | Starts | PitchPS | SIERA | ERA | K% | BB% | SS% | GB% | FB% | HH% |
| L30 Days | 6 | 94.2 | 2.95 | 4.28 | 28.4% | 3.6% | 13.8% | 40.4% | 33.0% | 31.6% |
| 2016 | 15 | 97.5 | 3.35 | 5.51 | 26.1% | 5.4% | 13.9% | 43.5% | 33.3% | 30.7% |
| 2015 | 27 | 94.4 | 3.09 | 4.37 | 23.4% | 3.1% | 11.9% | 48.2% | 29.9% | 30.1% |
Pineda’s indicators look a lot better than his actual earned run average. His SIERA is two full runs lower than his ERA. In fact, if you took ERA out of the picture, you would think that he was having an excellent season. He owns a 3.35 SIERA with a strikeout rate of 26.1% and a walk rate of 5.4%. He has been a little unlucky in terms of batted balls. He has a .359 BABIP, which is nearly 60 points above the major league average. I expect his results to improve the rest of the way, but I’m not a huge fan of his matchup today against the Rangers.
Batter Grind Down
Texas
The Rangers are ranked at or above the major league average in team wOBA, team ISO, and team K% against right-handed pitching this season. They come into today’s game with the seventh highest implied total of the 22 teams in action. BABIP will likely come down as the season progresses, but he has now allowed a .330 wOBA to left-handed hitters and a .338 wOBA to right-handed hitters over the last two years.
- Rangers Offense (2016)
Team wOBA vs. RHP — 0.316 (14 of 30)
Team ISO vs. RHP — 0.165 (14 of 30)
Team K% vs. RHP — 18.8% (5 of 30)
Runs Per Game — 4.99 (6 of 30)
Projected Run Total — 4.31 (7 of 22)
Projected Lineup
| # | Player | Bats | wOBA vs. RHP | ISO vs. RHP | wOBA L14 | FD Position | FD Salary | DK Position | DK Salary |
| 1 | Shin-Soo Choo | LEFT | 0.384 | 0.197 | 0.346 | OF | $3,800 | OF | $3,500 |
| 2 | | RIGHT | 0.311 | 0.163 | 0.502 | OF | $3,300 | OF | $5,000 |
| 3 | | LEFT | 0.357 | 0.189 | 0.264 | OF | $2,900 | OF | $3,200 |
| 4 | | RIGHT | 0.311 | 0.141 | 0.368 | 3B | $2,900 | 3B | $3,600 |
| 5 | | LEFT | 0.354 | 0.155 | 0.408 | 1B | $2,800 | 1B | $3,400 |
| 6 | | LEFT | 0.325 | 0.212 | 0.341 | 2B | $3,200 | 2B | $4,100 |
| 7 | | SWITCH | 0.465 | 0.242 | 0.443 | 2B | $2,900 | 1B/2B | $3,700 |
| 8 | | LEFT | 0.351 | 0.222 | 0.249 | OF | $2,600 | 1B | $3,400 |
| 9 | | RIGHT | 0.309 | 0.200 | 0.182 | C | $2,300 | C | $2,700 |
| | Team Averages | — | 0.352 | 0.191 | 0.345 | — | — | — | — |
Elite Plays – Shin-Soo Choo,
Secondary Plays – , , ,
Stackability – Cash & GPP
NY Yankees
This series is like a daytime soap opera – it has been full of drama and tears have been shed on both sides. The Yankees completed an incredible comeback in the ninth inning yesterday, hitting two home runs including a game-tying homer by and a walk off homer by Didi Gregorious. They draw a favorable matchup today against and they get to face him at home in the hitter-friendly Yankee Stadium.
- Yankees Offense (2016)
Team wOBA vs. RHP — 0.302 (25 of 30)
Team ISO vs. RHP — 0.148 (22 of 30)
Team K% vs. RHP — 18.9% (6 of 30)
Runs Per Game — 4.16 (22 of 30)
Projected Run Total — 4.69 (3 of 22)
Projected Lineup
| # | Player | Bats | wOBA vs. RHP | ISO vs. RHP | wOBA L14 | FD Position | FD Salary | DK Position | DK Salary |
| 1 | | LEFT | 0.311 | 0.109 | 0.248 | OF | $4,100 | OF | $3,700 |
| 2 | | LEFT | 0.335 | 0.145 | 0.297 | OF | $3,900 | OF | $3,700 |
| 3 | | RIGHT | 0.327 | 0.203 | 0.227 | 3B | $3,300 | 1B/3B | $3,400 |
| 4 | | LEFT | 0.325 | 0.205 | 0.452 | C | $3,100 | C | $3,600 |
| 5 | | SWITCH | 0.349 | 0.274 | 0.460 | 1B | $3,400 | 1B | $3,100 |
| 6 | | SWITCH | 0.301 | 0.108 | 0.358 | 3B | $2,900 | 3B | $2,800 |
| 7 | | LEFT | 0.303 | 0.125 | 0.395 | SS | $2,700 | SS | $3,500 |
| 8 | | SWITCH | 0.290 | 0.128 | 0.190 | OF | $2,500 | OF | $2,700 |
| 9 | | RIGHT | 0.320 | 0.116 | 0.691 | 2B | $2,000 | 3B/SS | $2,400 |
| | Team Averages | — | 0.318 | 0.157 | 0.369 | — | — | — | — |
Elite Plays – , ,
Secondary Plays – , , , Didi Gregorious
Stackability – Cash & GPP
LA Dodgers at Milwaukee – 2:10 PM ET
| LA Dodgers | Milwaukee |
 | |  | |
| RIGHT | RIGHT |
| Vegas Moneyline | Vegas Over/Under |
| LAD -127 | 8.0 |
| Stats | wOBA | HR All. | K% | BB% | Stats | wOBA | HR All. | K% | BB% |
| SP vs. Left | 0.274 | 4 | 20.5% | 12.1% | SP vs. Left | 0.298 | 5 | 20.9% | 10.0% |
| SP vs. Right | 0.267 | 4 | 27.1% | 3.3% | SP vs. Right | 0.296 | 6 | 19.2% | 6.4% |
Pitcher Grind Down
| Kenta Maeda |
 | FanDuel | DraftKings |
| Salary: | $9,500 | Salary: | $9,500 |
| FPPG: | 33.1 | FPPG: | 18.0 |
| Pitcher Rating: | 78.0 | Pitcher Rank: | 5 |
| Statistics | Starts | PitchPS | SIERA | ERA | K% | BB% | SS% | GB% | FB% | HH% |
| L30 Days | 6 | 93.7 | 3.64 | 2.34 | 25.6% | 8.0% | 9.4% | 46.7% | 30.0% | 36.3% |
| 2016 | 15 | 92.5 | 3.83 | 2.91 | 23.9% | 7.5% | 11.5% | 44.6% | 35.9% | 28.9% |
The options are scarce, but Maeda has the highest pitcher rating in the early slate and he grades out as the fifth best pitcher in the all-day slate. He has had a nice rookie season after coming over from Japan, posting a 3.83 SIERA with a strikeout rate of 23.9% and a walk rate of 7.5%. He hasn’t allowed a lot of hard contact and he draws a favorable matchup today against the strikeout happy Brewers. No team in baseball has a higher strikeout rate (26.1%) against right-handed pitching this season.
| Zach Davies |
 | FanDuel | DraftKings |
| Salary: | $8,100 | Salary: | $8,000 |
| FPPG: | 29.7 | FPPG: | 15.4 |
| Pitcher Rating: | 60.2 | Pitcher Rank: | 12 |
| Statistics | Starts | PitchPS | SIERA | ERA | K% | BB% | SS% | GB% | FB% | HH% |
| L30 Days | 5 | 99.8 | 3.03 | 1.64 | 28.8% | 4.8% | 9.0% | 44.3% | 36.7% | 23.5% |
| 2016 | 13 | 92.2 | 4.01 | 3.74 | 21.2% | 6.8% | 8.0% | 45.8% | 32.5% | 33.6% |
| 2015 | 6 | 89.8 | 4.34 | 3.71 | 17.3% | 10.8% | 10.0% | 57.6% | 21.2% | 32.0% |
I’m not exactly sure what happened, but Davies has had a Matt Shoemaker-like resurgence over the last month of play. In his last five starts, he has a 3.03 SIERA with a strikeout rate of 28.8% and a walk rate of 4.8%. Those numbers are a far cry from his statistics in his previous 14 starts. He doesn’t have overwhelming velocity, but his offspeed stuff has been great lately. I prefer Maeda over Davies in cash games, but am certainly fine targeting him in GPPs.
Batter Grind Down
LA Dodgers
The Dodgers have a higher team total than I was originally expecting. As a team, they are ranked below the major league average in team wOBA, team ISO, and team K% against right-handed pitching. They are also facing , who has been in excellent form over the last month of play. Over the last two seasons, Davies has held both left and right-handed hitters under a .300 wOBA.
- Dodgers Offense (2016)
Team wOBA vs. RHP — 0.305 (23 of 30)
Team ISO vs. RHP — 0.151 (21 of 30)
Team K% vs. RHP — 20.7% (16 of 30)
Runs Per Game — 4.13 (23 of 30)
Projected Run Total — 4.16 (10 of 22)
Projected Lineup
| # | Player | Bats | wOBA vs. RHP | ISO vs. RHP | wOBA L14 | FD Position | FD Salary | DK Position | DK Salary |
| 1 | | LEFT | 0.305 | 0.138 | 0.238 | 2B | $3,600 | 2B | $3,900 |
| 2 | | LEFT | 0.399 | 0.237 | 0.469 | SS | $4,300 | SS | $5,200 |
| 3 | | RIGHT | 0.369 | 0.208 | 0.438 | 3B | $3,600 | 3B | $4,700 |
| 4 | | LEFT | 0.344 | 0.193 | 0.299 | 1B | $3,400 | 1B | $3,300 |
| 5 | | RIGHT | 0.308 | 0.109 | 0.332 | 2B | $2,900 | 2B/OF | $3,400 |
| 6 | | RIGHT | 0.302 | 0.139 | 0.349 | OF | $3,200 | OF | $3,500 |
| 7 | | RIGHT | 0.347 | 0.212 | 0.201 | OF | $2,900 | OF | $3,500 |
| 8 | | SWITCH | 0.317 | 0.175 | 0.203 | C | $2,800 | C | $3,100 |
| 9 | | RIGHT | 0.153 | 0.158 | 0.293 | P | $9,500 | P | $9,500 |
| | Team Averages | — | 0.316 | 0.174 | 0.314 | — | — | — | — |
Elite Plays – NONE
Secondary Plays – , ,
Stackability – GPP
Milwaukee
The Brewers will have their hands full today, as they square off against at home. The sample size is small (15 starts), but Maeda has held both left and right-handed hitters under a .275 wOBA. Even though the Brewers are playing at home in a hitter-friendly ballpark, their high strikeout rate worries me in a matchup like this.
- Brewers Offense (2016)
Team wOBA vs. RHP — 0.315 (16 of 30)
Team ISO vs. RHP — 0.154 (17 of 30)
Team K% vs. RHP — 26.1% (30 of 30)
Runs Per Game — 4.10 (24 of 30)
Projected Run Total — 3.84 (18 of 22)
Projected Lineup
| # | Player | Bats | wOBA vs. RHP | ISO vs. RHP | wOBA L14 | FD Position | FD Salary | DK Position | DK Salary |
| 1 | | SWITCH | 0.334 | 0.120 | 0.333 | SS | $3,700 | SS | $4,800 |
| 2 | | LEFT | 0.308 | 0.132 | 0.358 | 2B | $3,100 | 2B | $3,900 |
| 3 | | RIGHT | 0.357 | 0.206 | 0.497 | OF | $3,800 | OF | $4,600 |
| 4 | | RIGHT | 0.327 | 0.248 | 0.347 | 1B | $3,300 | 1B | $4,000 |
| 5 | | RIGHT | 0.316 | 0.142 | 0.383 | 3B | $2,800 | 2B/3B | $3,600 |
| 6 | | LEFT | 0.308 | 0.174 | 0.387 | OF | $2,700 | OF | $3,500 |
| 7 | | RIGHT | 0.240 | 0.061 | 0.461 | C | $2,400 | C | $2,000 |
| 8 | | LEFT | 0.262 | 0.063 | 0.257 | OF | $2,100 | OF | $2,600 |
| 9 | | RIGHT | 0.049 | 0.000 | 0.000 | P | $8,100 | P | $8,000 |
| | Team Averages | — | 0.278 | 0.127 | 0.336 | — | — | — | — |
Elite Plays – NONE
Secondary Plays –
Stackability – NONE
Minnesota at Chicago White Sox – 2:10 PM ET
| Minnesota | Chicago White Sox |
 | |  | |
| LEFT | LEFT |
| Vegas Moneyline | Vegas Over/Under |
| CWS -159 | 9.0 |
| Stats | wOBA | HR All. | K% | BB% | Stats | wOBA | HR All. | K% | BB% |
| SP vs. Left | 0.283 | 5 | 19.8% | 7.0% | SP vs. Left | 0.245 | 1 | 25.6% | 8.0% |
| SP vs. Right | 0.334 | 17 | 15.8% | 6.7% | SP vs. Right | 0.352 | 21 | 22.0% | 11.1% |
Pitcher Grind Down
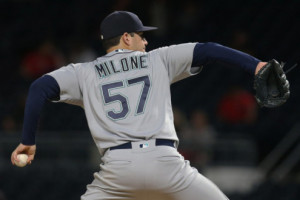
| Tommy Milone |
 | FanDuel | DraftKings |
| Salary: | $6,800 | Salary: | $6,100 |
| FPPG: | 15.5 | FPPG: | 7.4 |
| Pitcher Rating: | 34.5 | Pitcher Rank: | 21 |
| Statistics | Starts | PitchPS | SIERA | ERA | K% | BB% | SS% | GB% | FB% | HH% |
| L30 Days | 1 | 77.0 | 6.48 | 2.45 | 4.8% | 9.5% | 5.2% | 41.2% | 29.4% | 38.9% |
| 2016 | 5 | 99.8 | 4.49 | 5.33 | 16.8% | 7.6% | 7.8% | 47.1% | 29.9% | 40.0% |
| 2015 | 23 | 89.9 | 4.39 | 3.92 | 16.8% | 6.6% | 8.1% | 41.6% | 35.4% | 26.0% |
How bad is the Twins’ starting rotation? It doesn’t seem to matter who is on the mound for Minnesota these days, as their opponents routinely have some of the highest implied team totals on the board. In five starts this season, Milone has a 4.49 SIERA with a strikeout rate of only 16.8%. He checks in as a sizable underdog on the road against the White Sox, whose offense has been clicking after a slow start to the season.
| Carlos Rodon |
 | FanDuel | DraftKings |
| Salary: | $9,000 | Salary: | $8,500 |
| FPPG: | 28.8 | FPPG: | 14.8 |
| Pitcher Rating: | 69.1 | Pitcher Rank: | 8 |
| Statistics | Starts | PitchPS | SIERA | ERA | K% | BB% | SS% | GB% | FB% | HH% |
| L30 Days | 5 | 103.4 | 3.92 | 3.41 | 24.4% | 7.9% | 10.8% | 36.6% | 43.9% | 23.8% |
| 2016 | 14 | 99.4 | 4.00 | 4.09 | 22.8% | 8.1% | 9.2% | 45.0% | 34.6% | 24.5% |
| 2015 | 23 | 106.1 | 4.20 | 3.75 | 22.9% | 11.7% | 10.1% | 46.8% | 29.8% | 28.3% |
Rodon hasn’t taken the next step that many predicted for him this season. His numbers aren’t awful, but they look nearly identical to a year ago. In 14 starts, he owns a 4.00 SIERA with a strikeout rate of 22.8%. The one improvement that he has made has been with his command. He is walking nearly 4% less batters this season. He draws an exploitable matchup tonight against the Twins, who are ranked 25th in team wOBA and 27th in team strikeout rate against left-handed pitching this season.
Batter Grind Down
Minnesota
The Twins may be sizable underdogs tonight, but they actually have a decent team total of 4.16 runs. Their matchup against may not be the best on the board, but he has allowed a .352 wOBA and 21 home runs to batters from the right side of the plate. Red-hot remains an elite play in all league formats, while the rest of the Twins make more sense as secondary options.
- Twins Offense (2016)
Team wOBA vs. LHP — 0.306 (25 of 30)
Team ISO vs. LHP — 0.162 (15 of 30)
Team K% vs. LHP — 24.5% (27 of 30)
Runs Per Game — 4.05 (27 of 30)
Projected Run Total — 4.16 (11 of 22)
Projected Lineup
| # | Player | Bats | wOBA vs. LHP | ISO vs. LHP | wOBA L14 | FD Position | FD Salary | DK Position | DK Salary |
| 1 | | RIGHT | 0.342 | 0.250 | 0.344 | SS | $3,900 | 3B/SS | $4,000 |
| 2 | | SWITCH | 0.331 | 0.200 | 0.364 | SS | $2,300 | SS | $3,200 |
| 3 | | SWITCH | 0.351 | 0.169 | 0.232 | OF | $3,100 | OF | $2,900 |
| 4 | | RIGHT | 0.346 | 0.216 | 0.555 | 2B | $3,500 | 2B | $5,100 |
| 5 | | RIGHT | 0.330 | 0.175 | 0.349 | 3B | $2,500 | 3B | $3,400 |
| 6 | | RIGHT | 0.296 | 0.114 | 0.514 | C | $2,700 | C | $2,900 |
| 7 | | LEFT | 0.201 | 0.061 | 0.390 | OF | $3,000 | OF | $2,900 |
| 8 | | SWITCH | 0.239 | 0.071 | 0.308 | OF | $2,300 | OF | $3,100 |
| 9 | | RIGHT | 0.159 | 0.065 | 0.156 | OF | $2,900 | OF | $2,100 |
| | Team Averages | — | 0.288 | 0.147 | 0.357 | — | — | — | — |
Elite Plays –
Secondary Plays – , ,
Stackability – NONE
Chicago White Sox
The White Sox don’t have great numbers as a whole against left-handed pitching this season, but they have the second highest team total on the board. In his last 28 starts, has allowed a .334 wOBA and 17 home runs to right-handed hitters. If you are playing in the early-only slate, I highly recommend loading up on White Sox in cash games.
- White Sox Offense (2016)
Team wOBA vs. LHP — 0.316 (18 of 30)
Team ISO vs. LHP — 0.147 (23 of 30)
Team K% vs. LHP — 23.4% (21 of 30)
Runs Per Game — 4.17 (21 of 30)
Projected Run Total — 4.84 (2 of 22)
Projected Lineup
| # | Player | Bats | wOBA vs. LHP | ISO vs. LHP | wOBA L14 | FD Position | FD Salary | DK Position | DK Salary |
| 1 | | RIGHT | 0.098 | 0.000 | 0.326 | SS | $3,000 | SS | $3,800 |
| 2 | | LEFT | 0.319 | 0.067 | 0.330 | OF | $3,300 | OF | $3,500 |
| 3 | | RIGHT | 0.291 | 0.128 | 0.349 | 1B | $4,100 | 1B | $4,100 |
| 4 | | RIGHT | 0.370 | 0.349 | 0.300 | 3B | $4,100 | 3B | $4,200 |
| 5 | | RIGHT | 0.349 | 0.192 | 0.407 | 2B | $3,700 | 2B | $4,400 |
| 6 | | SWITCH | 0.329 | 0.221 | 0.348 | C | $2,700 | C | $3,400 |
| 7 | | RIGHT | 0.306 | 0.111 | 0.245 | OF | $2,800 | OF | $2,900 |
| 8 | | RIGHT | | | | | | | |
| 9 | | LEFT | 0.286 | 0.080 | 0.255 | OF | $3,000 | OF | $2,900 |
| | Team Averages | — | 0.294 | 0.144 | 0.320 | — | — | — | — |
Elite Plays – , ,
Secondary Plays – , ,
Stackability – Cash & GPP
Cincinnati at Washington – 7:05 PM ET
| Cincinnati | Washington |
 | |  | |
| LEFT | LEFT |
| Vegas Moneyline | Vegas Over/Under |
| WAS -191 | 9.0 |
| Stats | wOBA | HR All. | K% | BB% | Stats | wOBA | HR All. | K% | BB% |
| SP vs. Left | 0.335 | 4 | 14.4% | 12.4% | SP vs. Left | 0.269 | 1 | 18.0% | 6.2% |
| SP vs. Right | 0.303 | 16 | 20.3% | 10.4% | SP vs. Right | 0.325 | 16 | 23.9% | 9.2% |
Pitcher Grind Down
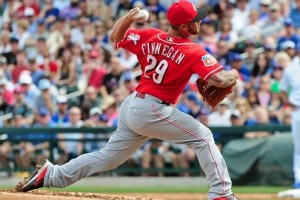
| Brandon Finnegan |
 | FanDuel | DraftKings |
| Salary: | $6,200 | Salary: | $6,700 |
| FPPG: | 22.2 | FPPG: | 11.3 |
| Pitcher Rating: | 36.1 | Pitcher Rank: | 19 |
| Statistics | Starts | PitchPS | SIERA | ERA | K% | BB% | SS% | GB% | FB% | HH% |
| L30 Days | 6 | 102.2 | 5.11 | 3.62 | 17.7% | 11.1% | 10.8% | 38.5% | 39.4% | 42.1% |
| 2016 | 16 | 97.1 | 5.16 | 3.83 | 16.8% | 11.0% | 9.2% | 40.4% | 35.7% | 36.1% |
| 2015 | 4 | 187.8 | 3.77 | 3.56 | 22.8% | 10.7% | 9.7% | 54.3% | 29.1% | 30.8% |
Finnegan has not fared well this season, posting a 5.16 SIERA with a strikeout rate of only 16.8%. His ERA is under 4.00, but we can expect some regression moving forward. He draws a difficult matchup tonight against the Nationals, who happen to be one of the best offenses in baseball against left-handed pitching. As a major underdog on the road, Finnegan should be avoided in all league formats.
| Gio Gonzalez |
 | FanDuel | DraftKings |
| Salary: | $8,500 | Salary: | $7,400 |
| FPPG: | 28.1 | FPPG: | 14.5 |
| Pitcher Rating: | 79.2 | Pitcher Rank: | 2 |
| Statistics | Starts | PitchPS | SIERA | ERA | K% | BB% | SS% | GB% | FB% | HH% |
| L30 Days | 6 | 100.8 | 3.66 | 7.79 | 27.2% | 9.9% | 10.9% | 46.6% | 22.7% | 29.7% |
| 2016 | 15 | 99.3 | 3.81 | 4.73 | 23.3% | 7.4% | 9.7% | 47.8% | 31.0% | 32.8% |
| 2015 | 31 | 95.1 | 3.77 | 3.79 | 22.3% | 9.1% | 9.8% | 53.8% | 26.6% | 28.7% |
Gonzalez grades out as the second best pitching option overall today. That says more about the lack of viable pitchers on the slate than it does about Gonzalez’s fantasy appeal. He has been knocked around in his last few starts, but still owns a 3.81 SIERA with a strikeout rate of 23.3% on the season. He is one of the many pitchers with drastically better splits at home and I will be using that to my advantage tonight. At his price point, he is the best value at the pitcher position tonight and he is playable in all league formats.
Batter Grind Down
Cincinnati
The Reds are ranked below the major league average in both team wOBA and team K% against left-handed pitching this season. hasn’t been in the best of form recently, but they are facing him in the pitcher-friendly Nationals Park. and both boast an ISO over .375 against southpaws, but they are better GPP plays than cash game targets.
- Reds Offense (2016)
Team wOBA vs. LHP — 0.310 (24 of 30)
Team ISO vs. LHP — 0.165 (12 of 30)
Team K% vs. LHP — 22.3% (18 of 30)
Runs Per Game — 4.25 (17 of 30)
Projected Run Total — 3.97 (14 of 22)
Projected Lineup
| # | Player | Bats | wOBA vs. LHP | ISO vs. LHP | wOBA L14 | FD Position | FD Salary | DK Position | DK Salary |
| 1 | | RIGHT | 0.365 | 0.263 | 0.326 | SS | $3,200 | SS | $4,600 |
| 2 | | LEFT | 0.388 | 0.179 | 0.371 | 1B | $3,200 | 1B | $4,400 |
| 3 | | LEFT | 0.305 | 0.172 | 0.343 | OF | $3,100 | OF | $4,400 |
| 4 | | RIGHT | 0.318 | 0.108 | 0.215 | 2B | $2,900 | 2B | $3,000 |
| 5 | | RIGHT | 0.328 | 0.194 | 0.351 | OF | $2,900 | OF | $4,200 |
| 6 | | RIGHT | 0.378 | 0.234 | 0.324 | 3B | $2,800 | 3B | $3,900 |
| 7 | | SWITCH | 0.260 | 0.082 | 0.361 | C | $2,500 | C | $2,300 |
| 8 | | RIGHT | 0.268 | 0.000 | 0.000 | OF | $2,000 | OF | $3,100 |
| 9 | | LEFT | 0.174 | 0.000 | 0.345 | P | $6,200 | P | $6,700 |
| | Team Averages | — | 0.309 | 0.137 | 0.293 | — | — | — | — |
Elite Plays – NONE
Secondary Plays – ,
Stackability – NONE
Washington
The Nationals have the highest ISO in baseball against left-handed pitching. They come into tonight’s game with the highest implied team total on the board. They draw a favorable matchup against at home. Not only is Finnegan a fly-ball pitcher, but he has allowed a 36.1% hard hit contact rate. Finnegan has also allowed 20 home runs in his last 20 starts – four to left-handed hitters and 16 to right-handed hitters.
- Nationals Offense (2016)
Team wOBA vs. LHP — 0.342 (5 of 30)
Team ISO vs. LHP — 0.204 (1 of 30)
Team K% vs. LHP — 19.8% (7 of 30)
Runs Per Game — 4.58 (13 of 30)
Projected Run Total — 5.03 (1 of 22)
Projected Lineup
| # | Player | Bats | wOBA vs. LHP | ISO vs. LHP | wOBA L14 | FD Position | FD Salary | DK Position | DK Salary |
| 1 | | RIGHT | 0.310 | 0.180 | 0.383 | OF | $2,900 | OF | $4,300 |
| 2 | | RIGHT | 0.398 | 0.286 | 0.351 | OF | $4,000 | OF | $4,200 |
| 3 | | LEFT | 0.388 | 0.225 | 0.386 | OF | $4,200 | OF | $4,900 |
| 4 | | LEFT | 0.305 | 0.115 | 0.383 | 2B | $3,900 | 2B | $3,800 |
| 5 | | RIGHT | 0.288 | 0.155 | 0.406 | C | $3,800 | C | $4,500 |
| 6 | | RIGHT | 0.387 | 0.308 | 0.224 | 1B | $3,300 | 1B | $4,200 |
| 7 | | RIGHT | 0.352 | 0.096 | 0.325 | 3B | $3,200 | 3B | $3,900 |
| 8 | | SWITCH | 0.335 | 0.214 | 0.420 | SS | $3,200 | SS | $3,900 |
| 9 | | LEFT | 0.000 | 0.000 | 0.000 | P | $8,500 | P | $7,400 |
| | Team Averages | — | 0.307 | 0.175 | 0.320 | — | — | — | — |
Elite Plays – , , ,
Secondary Plays – , ,
Stackability – Cash & GPP
Cleveland at Toronto – 7:07 PM ET
| Cleveland | Toronto |
 | |  | |
| RIGHT | RIGHT |
| Vegas Moneyline | Vegas Over/Under |
| CLE -119 | 8.5 |
| Stats | wOBA | HR All. | K% | BB% | Stats | wOBA | HR All. | K% | BB% |
| SP vs. Left | 0.286 | 14 | 26.5% | 6.9% | SP vs. Left | 0.312 | 21 | 13.2% | 8.8% |
| SP vs. Right | 0.285 | 13 | 29.0% | 5.0% | SP vs. Right | 0.319 | 21 | 16.4% | 6.2% |
Pitcher Grind Down
| Carlos Carrasco |
 | FanDuel | DraftKings |
| Salary: | $10,100 | Salary: | $10,800 |
| FPPG: | 33.3 | FPPG: | 18.8 |
| Pitcher Rating: | 79.1 | Pitcher Rank: | 4 |
| Statistics | Starts | PitchPS | SIERA | ERA | K% | BB% | SS% | GB% | FB% | HH% |
| L30 Days | 5 | 99.6 | 3.58 | 2.91 | 21.2% | 5.8% | 12.3% | 54.1% | 23.5% | 32.3% |
| 2016 | 9 | 90.1 | 3.62 | 2.73 | 22.1% | 5.9% | 11.7% | 51.6% | 27.4% | 34.6% |
| 2015 | 30 | 92.6 | 2.74 | 3.63 | 29.6% | 5.9% | 14.0% | 51.2% | 29.8% | 27.5% |
Carrasco dealt with a hamstring injury earlier in the season, but now appears ready to hit his stride. In his last five starts, he has a 3.58 SIERA with a strikeout rate of 21.2% and a walk rate of only 5.8%. He has no problem generating swings and misses and he typically induces an elite ground ball rate as well. He will need both of those to succeed tonight against the Blue Jays, who are ranked sixth in team wOBA and fourth in team ISO against right-handed pitching this season. The upside is there for Carrasco, but so is the risk.
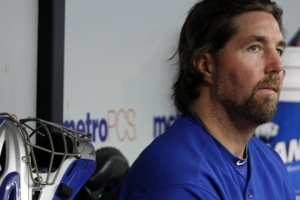
| R.A. Dickey |
 | FanDuel | DraftKings |
| Salary: | $7,000 | Salary: | $6,600 |
| FPPG: | 24.1 | FPPG: | 11.8 |
| Pitcher Rating: | 34.4 | Pitcher Rank: | 22 |
| Statistics | Starts | PitchPS | SIERA | ERA | K% | BB% | SS% | GB% | FB% | HH% |
| L30 Days | 6 | 97.3 | 5.46 | 3.60 | 12.8% | 10.1% | 7.5% | 46.9% | 35.4% | 33.6% |
| 2016 | 16 | 97.6 | 4.77 | 4.23 | 16.3% | 8.4% | 9.4% | 46.4% | 33.4% | 30.0% |
| 2015 | 33 | 98.9 | 4.76 | 3.91 | 14.3% | 6.9% | 9.1% | 41.9% | 37.2% | 23.9% |
There has been one time this season when I have recommended Dickey. It was a start against the Phillies and I believe he exceeded value. Other than that, he has been an easy fade in DFS. On the seasons, he has allowed a 4.77 SIERA with a strikeout rate of only 16.3%. He draws a difficult matchup tonight agains the red-hot Indians, who have won 12 straight games. Dickey is not a recommended play tonight and we may have to wait a while until he becomes one.
Batter Grind Down
Cleveland
The Indians have been on fire offensively during their winning streak. They are now ranked eighth in team wOBA and fifth in team ISO against right-handed pitching this season. They see a nice ballpark boost playing in the hitter-friendly Rogers Centre and they draw a favorable matchup against . Over the last two seasons, Dickey has allowed 42 home runs in 49 starts.
- Indians Offense (2016)
Team wOBA vs. RHP — 0.330 (8 of 30)
Team ISO vs. RHP — 0.193 (5 of 30)
Team K% vs. RHP — 20.6% (15 of 30)
Runs Per Game — 4.90 (7 of 30)
Projected Run Total — 4.36 (5 of 22)
Projected Lineup
| # | Player | Bats | wOBA vs. RHP | ISO vs. RHP | wOBA L14 | FD Position | FD Salary | DK Position | DK Salary |
| 1 | | SWITCH | 0.344 | 0.226 | 0.382 | 1B | $4,600 | 1B | $4,500 |
| 2 | | LEFT | 0.378 | 0.181 | 0.355 | 2B | $3,700 | 2B | $4,300 |
| 3 | | SWITCH | 0.351 | 0.162 | 0.402 | SS | $3,800 | SS | $5,100 |
| 4 | | RIGHT | 0.296 | 0.178 | 0.335 | 1B | $4,000 | 1B | $3,600 |
| 5 | | SWITCH | 0.314 | 0.143 | 0.332 | P | $4,000 | 3B/OF | $4,000 |
| 6 | | LEFT | 0.307 | 0.141 | 0.460 | OF | $3,100 | OF | $3,500 |
| 7 | | RIGHT | 0.267 | 0.179 | 0.317 | C | $2,700 | C | $3,000 |
| 8 | | LEFT | 0.405 | 0.265 | 0.632 | OF | $3,800 | OF | $3,500 |
| 9 | | RIGHT | 0.316 | 0.149 | 0.371 | OF | $3,000 | OF | $4,100 |
| | Team Averages | — | 0.331 | 0.180 | 0.398 | — | — | — | — |
Elite Plays – ,
Secondary Plays – , , ,
Stackability – Cash & GPP
Toronto
The Blue Jays have a decent implied team total tonight, but that has more to do with their ballpark than it does their matchup. Over the last two seasons, has held both left and right-handed hitters under a .286 wOBA. I get the feeling that the Jays will be able to score a few runs in this one, but I’m having a tough time predicting where that production is going to come from.
- Blue Jays Offense (2016)
Team wOBA vs. RHP — 0.332 (6 of 30)
Team ISO vs. RHP — 0.198 (4 of 30)
Team K% vs. RHP — 22.0% (19 of 30)
Runs Per Game — 4.78 (10 of 30)
Projected Run Total — 4.14 (12 of 22)
Projected Lineup
| # | Player | Bats | wOBA vs. RHP | ISO vs. RHP | wOBA L14 | FD Position | FD Salary | DK Position | DK Salary |
| 1 | | LEFT | 0.310 | 0.106 | 0.323 | OF | $3,300 | OF | $2,800 |
| 2 | | RIGHT | 0.365 | 0.201 | 0.520 | 2B | $2,900 | 2B | $3,500 |
| 3 | | RIGHT | 0.392 | 0.268 | 0.510 | 3B | $4,000 | 3B | $4,400 |
| 4 | | RIGHT | 0.382 | 0.272 | 0.495 | 1B | $3,900 | 1B | $4,300 |
| 5 | | LEFT | 0.362 | 0.213 | 0.338 | OF | $3,200 | OF | $3,700 |
| 6 | | RIGHT | 0.325 | 0.184 | 0.394 | SS | $3,000 | SS | $3,200 |
| 7 | | RIGHT | 0.307 | 0.140 | 0.321 | OF | $2,700 | OF | $2,800 |
| 8 | | LEFT | 0.196 | 0.013 | 0.336 | C | $2,000 | C | $2,000 |
| 9 | | LEFT | 0.291 | 0.120 | 0.133 | 2B | $2,200 | 2B/SS | $2,300 |
| | Team Averages | — | 0.326 | 0.169 | 0.374 | — | — | — | — |
Elite Plays – NONE
Secondary Plays – , ,
Stackability – NONE
Want to discuss strategy for today’s games? Head over to the RotoGrinders Forums
Jump to Page 1 2 3
