MLB Grind Down: Thursday, May 10th

Jump to Page 1 2
The RotoGrinders MLB Grind Down will give you an in-depth analysis into the upcoming MLB schedule. This article will break down the numbers for every single game and give you analysis on which trends you can exploit. While matchups are a major factor in daily fantasy baseball, there are plenty of other factors to consider such as injuries, weather, and salaries.
The analysis should point you in the right direction, but it is still up to you to decipher the information and make your own selections. No sport has more variance than baseball. The best choice is not always the right choice but following the trends will win you money over time.
Note: As always, if you want to try a new DFS site, be sure to click through a RotoGrinders link and use our DraftKings promo code, FanDuel promo code, and FantasyDraft promo code to receive the best perks in the industry.

Stackability Rating System:
GREEN – A viable full stack in cash games and GPPs.
YELLOW – A viable mini-stack in cash games and full stack in GPPs.
ORANGE – A viable stack in large field GPPs.
RED – Not a recommended stack for cash games or GPPs.
Implied Run Totals
Ballpark Ratings
San Francisco at Philadelphia – 1:05 PM ET
| San Francisco | Philadelphia | ||||||||||||||
 | Ty Blach |  | Vince Velasquez | ||||||||||||
| LEFT | RIGHT | ||||||||||||||
| Vegas Moneyline | Vegas Over/Under | ||||||||||||||
| PHI-135 | 9.0 | ||||||||||||||
| Stats | wOBA | xwOBA | HC% | BB% | K% | GB% | Stats | wOBA | xwOBA | HC% | BB% | K% | GB% | ||
|---|---|---|---|---|---|---|---|---|---|---|---|---|---|---|---|
| SP vs. Left (2016-17) | 0.263 | 0.308 | 28.2% | 5.7% | 9.4% | 57.9% | SP vs. Left (2016-17) | 0.383 | 0.351 | 31.5% | 10.8% | 22.5% | 41.7% | ||
| SP vs. Right (2016-17) | 0.343 | 0.352 | 33.2% | 6.9% | 11.3% | 45.6% | SP vs. Right (2016-17) | 0.322 | 0.335 | 34.6% | 9.2% | 22.7% | 38.0% | ||
Pitcher Grind Down
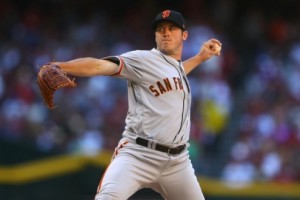
| Ty Blach | |||||||||
 | FanDuel | DraftKings | FantasyDraft | ||||||
| Salary: | $6,400 | Salary: | Salary: | ||||||
| Salary Rank: | 16 of 20 | Salary Rank: | of 20 | Salary Rank: | |||||
| Stats | Starts | SIERA | ERA | K% | BB% | GB% | HC% | SC% | |
|---|---|---|---|---|---|---|---|---|---|
| 2017 | 24 | 5.36 | 4.78 | 10.6% | 6.2% | 46.7% | 31.1% | 18.4% | |
| 2018 | 8 | 4.65 | 3.60 | 11.5% | 7.8% | 57.7% | 34.2% | 16.1% | |
| L14 | 2 | 4.05 | 1.98 | 10.9% | 1.8% | 55.3% | 41.7% | 16.7% | |
We have a single day game on the schedule. It is featured in the all-day slate and in the showdown slate, so we’ll run through it quickly. Blach isn’t a pitcher that we typically have interest in when it comes to DFS. Through eight starts this season, he owns a 4.65 SIERA with a strikeout rate of only 11.5%. A low strikeout rate magnifies mistakes and places an emphasis on run prevention, which isn’t exactly Blach’s strong suit.
Quick Breakdown: Avoid Blach in both cash games and tournaments.
| Vince Velasquez | |||||||||
 | FanDuel | DraftKings | FantasyDraft | ||||||
| Salary: | $7,700 | Salary: | Salary: | ||||||
| Salary Rank: | 9 of 20 | Salary Rank: | of 20 | Salary Rank: | |||||
| Stats | Starts | SIERA | ERA | K% | BB% | GB% | HC% | SC% | |
|---|---|---|---|---|---|---|---|---|---|
| 2017 | 15 | 4.73 | 5.13 | 21.6% | 10.8% | 42.5% | 38.1% | 15.2% | |
| 2018 | 7 | 3.99 | 5.14 | 24.7% | 8.4% | 34.3% | 22.6% | 16.7% | |
| L14 | 2 | 5.64 | 7.00 | 19.1% | 14.3% | 30.8% | 11.1% | 22.2% | |
Velasquez got off to a hot start this season, but has struggled in his last two appearances. As a whole, he has a respectable 3.99 SIERA with a strikeout rate of 25%. The Phillies’ pitchers have had a ton of success so far in this series and I like his chances to keep that streak alive. The projected lineup for San Francisco has six batters with a strikeout rate of at least 22% against right-handed pitching.
Quick Breakdown: Velasquez is the preferred target for the showdown slate, but there are better options in the all-day slate.
Batter Grind Down
San Francisco
The Giants have been unable to take advantage of the hitter-friendly Citizens Bank Park. They have really struggled at the plate in this series. While Vince Velasquez has been in decent form this season, he has allowed a .350+ xwOBA to both left and right-handed hitters over the last two seasons. I wouldn’t target any hitters in the all-day slate, but there are a few viable options for the showdown slate.
Projected Lineup (Splits vs. RH Pitching)
| # | Player | Bats | xwOBA | L15 | ISO | HC% | BB% | K% | GB% | FD Pos. | FD Sal. | DK Pos. | DK Sal. | FDRFT Pos. | FDRFT Sal. |
|---|---|---|---|---|---|---|---|---|---|---|---|---|---|---|---|
| 1 | Gregor Blanco | LEFT | 0.294 | 0.235 | 0.117 | 26.7% | 12.2% | 22.4% | 42.3% | OF | $2,400 | N/A | N/A | ||
| 2 | Andrew McCutchen | RIGHT | 0.349 | 0.466 | 0.152 | 34.9% | 11.5% | 18.3% | 41.7% | OF | $3,500 | N/A | N/A | ||
| 3 | Brandon Belt | LEFT | 0.418 | 0.442 | 0.269 | 42.6% | 16.5% | 22.4% | 23.8% | 1B | $3,800 | N/A | N/A | ||
| 4 | Nick Hundley | RIGHT | 0.302 | 0.485 | 0.142 | 32.7% | 3.1% | 27.2% | 39.9% | C | $2,400 | N/A | N/A | ||
| 5 | Evan Longoria | RIGHT | 0.315 | 0.340 | 0.168 | 35.6% | 4.3% | 16.7% | 42.2% | 3B | $3,000 | N/A | N/A | ||
| 6 | Brandon Crawford | LEFT | 0.313 | 0.340 | 0.141 | 34.5% | 6.5% | 22.1% | 46.8% | SS | $2,900 | N/A | N/A | ||
| 7 | Alen Hanson | SWITCH | 0.236 | 0.303 | 0.141 | 21.1% | 4.4% | 22.4% | 49.1% | 2B | $3,400 | N/A | N/A | ||
| 8 | Austin Jackson | RIGHT | 0.296 | 0.260 | 0.107 | 36.8% | 7.7% | 26.8% | 45.2% | OF | $2,100 | N/A | N/A | ||
| 9 | Ty Blach | LEFT | 0.229 | 0.089 | 0.083 | 30.0% | 9.3% | 44.2% | 46.7% | P | $6,400 | N/A | N/A |
Elite Plays – Gregor Blanco, Brandon Belt
Secondary Plays – Andrew McCutchen, Nick Hundley, Evan Longoria
Stackability – ORANGE / YELLOW
Philadelphia
The Phillies draw an exploitable matchup against Ty Blach and they are facing him at home in a hitter-friendly ballpark. Blach does have a high ground ball rate, but has still given up a .352 xwOBA and a 33% hard contact rate to right-handed hitters over the last two seasons. This sets up perfectly for Rhys Hoskins, who is a fly-ball hitter with plenty of power against left-handed pitching.
Projected Lineup (Splits vs. LH Pitching)
| # | Player | Bats | xwOBA | L15 | ISO | HC% | BB% | K% | GB% | FD Pos. | FD Sal. | DK Pos. | DK Sal. | FDRFT Pos. | FDRFT Sal. |
|---|---|---|---|---|---|---|---|---|---|---|---|---|---|---|---|
| 1 | Cesar Hernandez | SWITCH | 0.367 | 0.375 | 0.158 | 26.6% | 12.8% | 11.8% | 57.0% | 2B | $3,800 | N/A | N/A | ||
| 2 | Rhys Hoskins | RIGHT | 0.435 | 0.352 | 0.324 | 44.9% | 26.8% | 20.6% | 32.7% | OF | $4,300 | N/A | N/A | ||
| 3 | Odubel Herrera | LEFT | 0.317 | 0.441 | 0.177 | 30.8% | 3.9% | 22.5% | 49.7% | OF | $3,900 | N/A | N/A | ||
| 4 | Aaron Altherr | RIGHT | 0.379 | 0.432 | 0.282 | 40.4% | 13.2% | 18.4% | 44.2% | OF | $2,800 | N/A | N/A | ||
| 5 | Carlos Santana | SWITCH | 0.345 | 0.351 | 0.163 | 32.2% | 12.8% | 10.1% | 48.9% | 1B | $3,300 | N/A | N/A | ||
| 6 | Maikel Franco | RIGHT | 0.318 | 0.408 | 0.190 | 34.0% | 7.1% | 13.2% | 46.2% | 3B | $3,700 | N/A | N/A | ||
| 7 | Scott Kingery | RIGHT | 0.276 | 0.263 | 0.129 | 36.8% | 3.1% | 37.5% | 36.8% | SS | $2,500 | N/A | N/A | ||
| 8 | Jorge Alfaro | RIGHT | 0.275 | 0.374 | 0.088 | 35.3% | 9.5% | 36.5% | 52.9% | C | $2,200 | N/A | N/A | ||
| 9 | Vince Velasquez | RIGHT | 0.194 | 0.047 | 0.000 | 10.0% | 7.1% | 21.4% | 44.4% | P | $7,700 | N/A | N/A |
Elite Plays – Rhys Hoskins, Aaron Altherr, Carlos Santana
Secondary Plays – Cesar Hernandez, Maikel Franco
Stackability – YELLOW / GREEN
Boston at NY Yankees – 7:05 PM ET
| Boston | NY Yankees | ||||||||||||||
 | Eduardo Rodriguez |  | CC Sabathia | ||||||||||||
| LEFT | LEFT | ||||||||||||||
| Vegas Moneyline | Vegas Over/Under | ||||||||||||||
| NYY-131 | 9.0 | ||||||||||||||
| Stats | wOBA | xwOBA | HC% | BB% | K% | GB% | Stats | wOBA | xwOBA | HC% | BB% | K% | GB% | ||
|---|---|---|---|---|---|---|---|---|---|---|---|---|---|---|---|
| SP vs. Left (2016-17) | 0.338 | 0.334 | 32.5% | 7.8% | 31.9% | 31.3% | SP vs. Left (2016-17) | 0.296 | 0.265 | 14.9% | 7.8% | 21.7% | 55.4% | ||
| SP vs. Right (2016-17) | 0.309 | 0.302 | 30.4% | 9.0% | 24.8% | 37.9% | SP vs. Right (2016-17) | 0.298 | 0.315 | 29.9% | 7.2% | 18.5% | 47.3% | ||
Pitcher Grind Down
| Eduardo Rodriguez | |||||||||
 | FanDuel | DraftKings | FantasyDraft | ||||||
| Salary: | $7,100 | Salary: | $6,700 | Salary: | $12,700 | ||||
| Salary Rank: | 14 of 20 | Salary Rank: | 12 of 20 | Salary Rank: | 13 of 20 | ||||
| Stats | Starts | SIERA | ERA | K% | BB% | GB% | HC% | SC% | |
|---|---|---|---|---|---|---|---|---|---|
| 2017 | 24 | 4.05 | 4.19 | 25.8% | 8.6% | 34.9% | 30.8% | 18.6% | |
| 2018 | 6 | 3.66 | 5.29 | 28.1% | 9.4% | 44.7% | 30.6% | 18.8% | |
| L14 | 2 | 3.18 | 9.00 | 35.6% | 11.1% | 31.8% | 40.9% | 18.2% | |
Rodriguez has a high ERA this season, but should have some positive regression coming his way. In six starts, he has a 3.66 SIERA with a strikeout rate of 28%. These numbers are certainly appealing, but a matchup against the Yankees in New York is not. Fly-ball pitchers tend to struggle in this ballpark, especially left-handed ones. The Yankees have too many right-handed power bats in their lineup.
Quick Breakdown: Rodriguez offers more risk than upside in this matchup.
| CC Sabathia | |||||||||
 | FanDuel | DraftKings | FantasyDraft | ||||||
| Salary: | $7,400 | Salary: | $7,000 | Salary: | $13,700 | ||||
| Salary Rank: | 12 of 20 | Salary Rank: | 11 of 20 | Salary Rank: | 11 of 20 | ||||
| Stats | Starts | SIERA | ERA | K% | BB% | GB% | HC% | SC% | |
|---|---|---|---|---|---|---|---|---|---|
| 2017 | 27 | 4.45 | 3.69 | 19.3% | 8.0% | 49.9% | 27.2% | 24.1% | |
| 2018 | 6 | 4.22 | 1.39 | 18.0% | 3.9% | 42.9% | 28.6% | 28.6% | |
| L14 | 2 | 3.59 | 0.69 | 22.9% | 2.1% | 36.1% | 19.4% | 30.6% | |
Sabathia is having another Sabathia-like season. While he is no longer a high-strikeout pitcher, he keeps the ball on the ground and he limits hard contact. In fact, his soft contact rate is as high as his hard contact rate, which is impressive. The issue is the strikeout upside, especially in a matchup against the Red Sox. Their projected lineup has a .339 xwOBA and a 19% strikeout rate against left-handed pitching.
Quick Breakdown: Given the matchup and ballpark, we should be able to find better options.
Batter Grind Down
Boston
Even though I won’t have any shares of CC Sabathia, he’s not a pitcher that we want to target hitters against. Over the last two seasons, he has held both left and right-handed hitters under a .315 xwOBA and under a 30% hard contact rate. Sabathia has also had their number, holding their current roster to a .288 wOBA in 178 plate appearances.
Projected Lineup (Splits vs. LH Pitching)
| # | Player | Bats | xwOBA | L15 | ISO | HC% | BB% | K% | GB% | FD Pos. | FD Sal. | DK Pos. | DK Sal. | FDRFT Pos. | FDRFT Sal. |
|---|---|---|---|---|---|---|---|---|---|---|---|---|---|---|---|
| 1 | Mookie Betts | RIGHT | 0.397 | 0.543 | 0.291 | 35.6% | 14.4% | 7.5% | 41.1% | OF | $5,100 | OF | $5,900 | RF | $11,700 |
| 2 | Andrew Benintendi | LEFT | 0.287 | 0.266 | 0.056 | 20.2% | 13.9% | 20.5% | 51.9% | OF | $3,600 | OF | $4,200 | LF | $8,300 |
| 3 | Hanley Ramirez | RIGHT | 0.334 | 0.350 | 0.180 | 37.9% | 12.6% | 22.6% | 45.6% | 1B | $3,900 | 1B | $4,000 | 1B | $7,400 |
| 4 | J.D. Martinez | RIGHT | 0.464 | 0.420 | 0.421 | 53.9% | 11.8% | 26.4% | 31.5% | OF | $4,500 | OF | $5,000 | RF | $10,000 |
| 5 | Xander Bogaerts | RIGHT | 0.318 | 0.352 | 0.122 | 28.3% | 10.1% | 18.1% | 49.1% | SS | $3,700 | SS | $4,500 | SS | $8,900 |
| 6 | Rafael Devers | LEFT | 0.312 | 0.337 | 0.184 | 33.9% | 8.4% | 29.5% | 47.5% | 3B | $3,200 | 3B | $3,900 | 3B | $7,800 |
| 7 | Eduardo Nunez | RIGHT | 0.300 | 0.263 | 0.114 | 27.5% | 5.1% | 11.2% | 52.4% | 2B | $3,000 | 2B/SS | $3,300 | 3B | $6,700 |
| 8 | Jackie Bradley | LEFT | 0.300 | 0.221 | 0.100 | 27.9% | 7.7% | 23.7% | 64.0% | OF | $2,300 | OF | $3,000 | CF | $6,000 |
| 9 | Christian Vazquez | RIGHT | 0.335 | 0.261 | 0.139 | 23.9% | 3.7% | 14.6% | 44.8% | C | $2,100 | C | $2,400 | C | $4,500 |
Elite Plays – None
Secondary Plays – Mookie Betts, J.D. Martinez
Stackability – ORANGE
NY Yankees
I’ve basically been saying this on repeat, but the Yankees are one of the top stacks of the slate. They are facing a fly-ball pitcher in the hitter-friendly Yankee Stadium. The sample size is still small, but this roster has had success against Eduardo Rodriguez in the past (.391 xwOBA in 79 plate appearances). All of the big right-handed bats are obviously in play, but the lefties also deserve a look given Rodriguez’s reverse-splits.
Projected Lineup (Splits vs. LH Pitching)
| # | Player | Bats | xwOBA | L15 | ISO | HC% | BB% | K% | GB% | FD Pos. | FD Sal. | DK Pos. | DK Sal. | FDRFT Pos. | FDRFT Sal. |
|---|---|---|---|---|---|---|---|---|---|---|---|---|---|---|---|
| 1 | Brett Gardner | LEFT | 0.301 | 0.339 | 0.069 | 20.1% | 9.5% | 19.0% | 50.0% | OF | $2,900 | OF | $3,300 | LF | $6,300 |
| 2 | Aaron Judge | RIGHT | 0.430 | 0.316 | 0.262 | 45.1% | 25.4% | 32.0% | 31.7% | OF | $4,900 | OF | $5,300 | RF | $9,900 |
| 3 | Didi Gregorius | LEFT | 0.277 | 0.305 | 0.116 | 16.8% | 5.1% | 14.3% | 35.5% | SS | $4,200 | SS | $4,400 | SS | $9,400 |
| 4 | Giancarlo Stanton | RIGHT | 0.476 | 0.363 | 0.497 | 47.6% | 16.3% | 16.8% | 42.9% | OF | $4,900 | OF | $5,100 | RF | $10,700 |
| 5 | Gary Sanchez | RIGHT | 0.393 | 0.418 | 0.294 | 38.4% | 11.1% | 24.2% | 41.4% | C | $4,200 | C | $4,500 | C | $9,500 |
| 6 | Aaron Hicks | SWITCH | 0.357 | 0.300 | 0.180 | 30.2% | 10.8% | 16.9% | 45.2% | OF | $3,000 | OF | $3,500 | CF | $6,800 |
| 7 | Miguel Andujar | RIGHT | 0.267 | 0.244 | 0.100 | 20.0% | 6.3% | 15.6% | 56.0% | 3B | $2,700 | 3B | $3,500 | 3B | $6,800 |
| 8 | Tyler Austin | RIGHT | 0.448 | 0.311 | 0.282 | 36.7% | 12.8% | 23.4% | 33.3% | 1B | $3,000 | 1B | $3,900 | 1B | $7,700 |
| 9 | Gleyber Torres | RIGHT | 0.370 | 0.395 | 0.000 | 25.0% | 6.7% | 13.3% | 41.7% | 2B | $3,700 | 2B | $4,000 | 2B | $7,300 |
Elite Plays – Aaron Judge, Giancarlo Stanton, Gary Sanchez
Secondary Plays – Brett Gardner, Didi Gregorius, Aaron Hicks
Stackability – GREEN
Kansas City at Baltimore – 7:05 PM ET
| Kansas City | Baltimore | ||||||||||||||
 | Ian Kennedy |  | Chris Tillman | ||||||||||||
| RIGHT | RIGHT | ||||||||||||||
| Vegas Moneyline | Vegas Over/Under | ||||||||||||||
| KC -112 | 9.5 | ||||||||||||||
| Stats | wOBA | xwOBA | HC% | BB% | K% | GB% | Stats | wOBA | xwOBA | HC% | BB% | K% | GB% | ||
|---|---|---|---|---|---|---|---|---|---|---|---|---|---|---|---|
| SP vs. Left (2016-17) | 0.340 | 0.379 | 45.4% | 10.0% | 19.2% | 30.3% | SP vs. Left (2016-17) | 0.448 | 0.442 | 39.1% | 18.0% | 10.7% | 45.4% | ||
| SP vs. Right (2016-17) | 0.327 | 0.353 | 37.7% | 7.8% | 21.4% | 40.4% | SP vs. Right (2016-17) | 0.397 | 0.396 | 38.5% | 5.8% | 15.5% | 35.0% | ||
Pitcher Grind Down
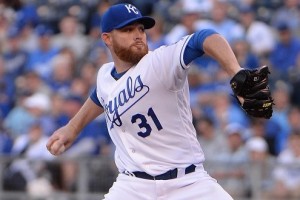
| Ian Kennedy | |||||||||
 | FanDuel | DraftKings | FantasyDraft | ||||||
| Salary: | $7,800 | Salary: | $6,500 | Salary: | $12,900 | ||||
| Salary Rank: | 8 of 20 | Salary Rank: | 13 of 20 | Salary Rank: | 12 of 20 | ||||
| Stats | Starts | SIERA | ERA | K% | BB% | GB% | HC% | SC% | |
|---|---|---|---|---|---|---|---|---|---|
| 2017 | 30 | 4.88 | 5.38 | 20.0% | 9.3% | 36.0% | 41.7% | 11.8% | |
| 2018 | 7 | 4.10 | 2.92 | 21.7% | 6.8% | 33.6% | 40.0% | 20.0% | |
| L14 | 2 | 3.35 | 1.64 | 28.3% | 6.5% | 30.0% | 40.0% | 16.7% | |
Kennedy is actually having a decent season thus far, posting a 4.10 SIERA with a slightly above-average strikeout rate. The problem is that with his high fly-ball rate and his high hard contact rate, a good outing can turn into a bad outing in an instant. He gives up far too many home runs for us to feel comfortable about rostering him in anything other than a tournament. I know the Orioles have some strikeouts in their lineup, but they have plenty of home run power as well.
Quick Breakdown: Kennedy offers some strikeout upside, but is a deep tournament dart at best in this ballpark.
| Chris Tillman | |||||||||
 | FanDuel | DraftKings | FantasyDraft | ||||||
| Salary: | $5,600 | Salary: | $4,000 | Salary: | $8,000 | ||||
| Salary Rank: | 19 of 20 | Salary Rank: | 18 of 20 | Salary Rank: | 18 of 20 | ||||
| Stats | Starts | SIERA | ERA | K% | BB% | GB% | HC% | SC% | |
|---|---|---|---|---|---|---|---|---|---|
| 2017 | 19 | 5.76 | 7.84 | 14.2% | 11.5% | 39.5% | 37.7% | 16.3% | |
| 2018 | 6 | 6.03 | 9.24 | 10.3% | 11.1% | 39.6% | 42.3% | 8.3% | |
| L14 | 2 | 5.16 | 7.88 | 13.9% | 8.3% | 40.7% | 44.4% | 3.7% | |
Tillman is having one of the worst seasons in recent memory. In six starts, he has a 6.03 SIERA (9.24 ERA) with a strikeout rate of only 10%. He’s a fly-ball pitcher that gives up a lot of hard contact, which is troublesome. He basically doesn’t have an out. With a low strikeout rate and a low ground ball rate, he constantly finds himself in trouble.
Quick Breakdown: Get your Royals’ stacks ready.
Batter Grind Down
Kansas City
The Royals have been a frustrating offense here in the early part of the season. I have fallen for their high implied run totals more than a time or two and have had little success stacking this offense. With that said, the stack did work well the other night when they scored ten runs in the first inning. I’m willing to give them another look tonight, as they face Chris Tillman in the hitter-friendly Camden Yards. Over the last two seasons, he has given up a .442 xwOBA to lefties and a .396 xwOBA to righties.
Projected Lineup (Splits vs. RH Pitching)
| # | Player | Bats | xwOBA | L15 | ISO | HC% | BB% | K% | GB% | FD Pos. | FD Sal. | DK Pos. | DK Sal. | FDRFT Pos. | FDRFT Sal. |
|---|---|---|---|---|---|---|---|---|---|---|---|---|---|---|---|
| 1 | Jon Jay | LEFT | 0.323 | 0.298 | 0.083 | 29.5% | 7.4% | 18.2% | 48.2% | OF | $2,500 | OF | $2,800 | CF | $5,600 |
| 2 | Jorge Soler | RIGHT | 0.297 | 0.385 | 0.105 | 32.6% | 13.4% | 26.8% | 43.5% | OF | $3,700 | OF | $4,200 | RF | $7,500 |
| 3 | Mike Moustakas | LEFT | 0.382 | 0.380 | 0.287 | 36.3% | 6.5% | 15.1% | 31.6% | 3B | $4,100 | 3B | $4,500 | 3B | $9,000 |
| 4 | Salvador Perez | RIGHT | 0.351 | 0.360 | 0.226 | 39.0% | 3.3% | 17.9% | 33.1% | C | $3,300 | C | $3,900 | C | $7,200 |
| 5 | Lucas Duda | LEFT | 0.377 | 0.355 | 0.271 | 42.5% | 12.7% | 24.6% | 27.0% | 1B | $2,500 | 1B | $3,400 | 1B | $6,300 |
| 6 | Whit Merrifield | RIGHT | 0.319 | 0.344 | 0.145 | 31.5% | 5.2% | 14.3% | 38.0% | 2B | $3,600 | 2B | $4,300 | IF/OF | $8,200 |
| 7 | Alex Gordon | LEFT | 0.306 | 0.406 | 0.136 | 33.9% | 7.2% | 23.9% | 41.3% | OF | $3,100 | OF | $3,800 | LF | $7,700 |
| 8 | Alcides Escobar | RIGHT | 0.276 | 0.319 | 0.093 | 27.6% | 2.7% | 14.9% | 40.9% | SS | $2,400 | SS | $3,100 | SS | $5,600 |
| 9 | Ryan Goins | LEFT | 0.280 | 0.206 | 0.123 | 30.3% | 6.4% | 21.0% | 45.2% | 2B | $2,100 | 2B | $2,400 | 2B | $4,800 |
Elite Plays – Mike Moustakas, Salvador Perez, Lucas Duda
Secondary Plays – Jon Jay, Jorge Soler, Whit Merrifield
Stackability – YELLOW / GREEN
Baltimore
The Orioles’ stack is just as enticing as the Royals’ stack. While Ian Kennedy has a higher strikeout rate than Chris Tillman, he is just as hittable and the Orioles have more home run upside in their lineup. Over the last two seasons, Kennedy has allowed a .379 xwOBA to lefties and a .353 xwOBA to righties. You can stack both offenses or this game as a whole.
Projected Lineup (Splits vs. RH Pitching)
| # | Player | Bats | xwOBA | L15 | ISO | HC% | BB% | K% | GB% | FD Pos. | FD Sal. | DK Pos. | DK Sal. | FDRFT Pos. | FDRFT Sal. |
|---|---|---|---|---|---|---|---|---|---|---|---|---|---|---|---|
| 1 | Trey Mancini | RIGHT | 0.357 | 0.313 | 0.195 | 34.7% | 7.0% | 23.4% | 50.0% | OF | $2,900 | 1B/OF | $3,500 | IF/OF | $6,700 |
| 2 | Adam Jones | RIGHT | 0.327 | 0.321 | 0.194 | 31.9% | 3.1% | 18.4% | 43.8% | OF | $2,700 | OF | $3,500 | CF | $6,500 |
| 3 | Manny Machado | RIGHT | 0.369 | 0.329 | 0.210 | 36.2% | 8.6% | 16.6% | 42.4% | SS | $4,400 | SS | $4,900 | 3B | $9,500 |
| 4 | Jonathan Schoop | RIGHT | 0.311 | 0.406 | 0.182 | 33.6% | 3.7% | 21.2% | 42.4% | 2B | $2,900 | 2B | $3,500 | 2B | $6,600 |
| 5 | Chris Davis | LEFT | 0.336 | 0.338 | 0.205 | 41.5% | 12.1% | 34.6% | 40.3% | 1B | $2,700 | 1B | $3,100 | IF/OF | $5,700 |
| 6 | Mark Trumbo | RIGHT | 0.301 | 0.306 | 0.154 | 31.6% | 7.0% | 25.5% | 43.2% | OF | $2,900 | 1B/OF | $3,800 | DH | $7,700 |
| 7 | Pedro Alvarez | LEFT | 0.368 | 0.439 | 0.204 | 36.6% | 11.2% | 27.6% | 40.8% | 3B | $2,400 | 1B/3B | $3,700 | 1B | $7,600 |
| 8 | Anthony Santander | SWITCH | 0.308 | 0.333 | 0.109 | 37.2% | 3.1% | 15.6% | 32.1% | OF | $2,100 | OF | $3,000 | RF | $5,500 |
| 9 | Caleb Joseph | RIGHT | 0.247 | 0.260 | 0.137 | 25.2% | 2.9% | 28.4% | 47.3% | C | $2,200 | C | $2,400 | C | $4,800 |
Elite Plays – Trey Mancini, Manny Machado
Secondary Plays – Adam Jones, Jonathan Schoop, Chris Davis, Mark Trumbo, Pedro Alvarez
Stackability – YELLOW / GREEN
Seattle at Toronto – 7:07 PM ET
| Seattle | Toronto | ||||||||||||||
 | Mike Leake |  | J.A. Happ | ||||||||||||
| RIGHT | LEFT | ||||||||||||||
| Vegas Moneyline | Vegas Over/Under | ||||||||||||||
| TOR-145 | 9.0 | ||||||||||||||
| Stats | wOBA | xwOBA | HC% | BB% | K% | GB% | Stats | wOBA | xwOBA | HC% | BB% | K% | GB% | ||
|---|---|---|---|---|---|---|---|---|---|---|---|---|---|---|---|
| SP vs. Left (2016-17) | 0.341 | 0.374 | 32.4% | 6.7% | 12.5% | 54.1% | SP vs. Left (2016-17) | 0.210 | 0.241 | 19.8% | 3.8% | 23.8% | 56.9% | ||
| SP vs. Right (2016-17) | 0.314 | 0.324 | 35.2% | 4.2% | 20.2% | 48.4% | SP vs. Right (2016-17) | 0.321 | 0.312 | 29.2% | 8.0% | 24.7% | 44.5% | ||
Pitcher Grind Down
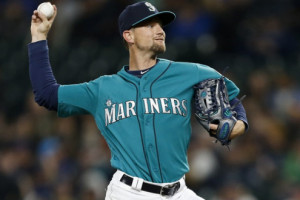
| Mike Leake | |||||||||
 | FanDuel | DraftKings | FantasyDraft | ||||||
| Salary: | $5,700 | Salary: | $4,600 | Salary: | $9,400 | ||||
| Salary Rank: | 18 of 20 | Salary Rank: | 16 of 20 | Salary Rank: | 15 of 20 | ||||
| Stats | Starts | SIERA | ERA | K% | BB% | GB% | HC% | SC% | |
|---|---|---|---|---|---|---|---|---|---|
| 2017 | 31 | 4.15 | 3.92 | 16.6% | 4.7% | 53.7% | 32.7% | 15.8% | |
| 2018 | 7 | 5.08 | 6.28 | 14.9% | 8.6% | 40.9% | 38.6% | 12.1% | |
| L14 | 2 | 4.57 | 5.56 | 19.6% | 9.8% | 44.4% | 25.0% | 25.0% | |
Leake has been one of the most hittable pitchers in baseball this season, which is a bit strange. Historically, he’s been a high ground ball pitcher that induces a lot of soft and medium contact. This season, he has a below-average ground ball rate, which is one of the factors that has led to a high ERA. He’s an easy fade on the road against the Blue Jays in a game that features a high total.
Quick Breakdown: Avoid Leake in both cash games and tournaments.
| J.A. Happ | |||||||||
 | FanDuel | DraftKings | FantasyDraft | ||||||
| Salary: | $9,100 | Salary: | $11,000 | Salary: | $21,100 | ||||
| Salary Rank: | 2 of 20 | Salary Rank: | 1 of 20 | Salary Rank: | 1 of 20 | ||||
| Stats | Starts | SIERA | ERA | K% | BB% | GB% | HC% | SC% | |
|---|---|---|---|---|---|---|---|---|---|
| 2017 | 25 | 4.11 | 3.53 | 22.7% | 7.4% | 46.9% | 26.7% | 20.3% | |
| 2018 | 7 | 2.95 | 3.67 | 31.0% | 6.4% | 48.5% | 29.1% | 17.5% | |
| L14 | 2 | 3.76 | 3.55 | 24.5% | 8.2% | 53.1% | 28.1% | 15.6% | |
Happ is having a career year, posting a 2.95 SIERA with a strikeout rate 41%. He has good control, an above-average ground ball rate, and he is tough on both left and right-handed hitters. With that said, a matchup against the Mariners is far from ideal, especially in this ballpark. Their projected lineup has a .334 xwOBA with a strikeout rate of only 19% against left-handed pitching.
Quick Breakdown: Happ feels a little overpriced for the matchup, but is still viable in tournaments.
Batter Grind Down
Seattle
The Mariners see a healthy boost playing in Toronto, but draw a difficult matchup against J.A. Happ. In addition to having an above-average ground ball rate and an above-average strikeout rate, Happ has held both left and right-handed hitters under a .315 xwOBA and under a 30% hard contact rate over the last two seasons. Outside of a Nelson Cruz one-off in tournaments, the Mariners are an easy pass.
Projected Lineup (Splits vs. LH Pitching)
| # | Player | Bats | xwOBA | L15 | ISO | HC% | BB% | K% | GB% | FD Pos. | FD Sal. | DK Pos. | DK Sal. | FDRFT Pos. | FDRFT Sal. |
|---|---|---|---|---|---|---|---|---|---|---|---|---|---|---|---|
| 1 | Dee Gordon | LEFT | 0.250 | 0.269 | 0.053 | 12.8% | 0.8% | 11.8% | 62.6% | OF | $3,400 | OF | $4,400 | IF/OF | $8,200 |
| 2 | Jean Segura | RIGHT | 0.355 | 0.344 | 0.115 | 35.0% | 8.2% | 13.6% | 45.3% | SS | $3,100 | SS | $3,900 | SS | $7,800 |
| 3 | Robinson Cano | LEFT | 0.329 | 0.470 | 0.105 | 32.4% | 8.2% | 15.1% | 55.1% | 2B | $3,700 | 2B | $3,600 | 2B | $7,600 |
| 4 | Nelson Cruz | RIGHT | 0.448 | 0.413 | 0.217 | 44.1% | 19.2% | 19.7% | 42.4% | OF | $3,800 | OF | $4,100 | RF | $8,600 |
| 5 | Mitch Haniger | RIGHT | 0.355 | 0.420 | 0.225 | 31.1% | 7.2% | 18.7% | 46.6% | OF | $3,800 | OF | $4,100 | LF | $8,000 |
| 6 | Kyle Seager | LEFT | 0.299 | 0.385 | 0.167 | 28.6% | 6.4% | 19.2% | 35.5% | 3B | $2,900 | 3B | $3,500 | 3B | $6,500 |
| 7 | Ryon Healy | RIGHT | 0.327 | 0.411 | 0.211 | 29.9% | 4.4% | 22.0% | 41.9% | 1B | $3,300 | 1B | $3,800 | 3B | $7,500 |
| 8 | Mike Zunino | RIGHT | 0.329 | 0.345 | 0.252 | 35.9% | 9.3% | 36.4% | 26.6% | C | $2,900 | C | $3,300 | C | $6,400 |
| 9 | Guillermo Heredia | SWITCH | 0.315 | 0.417 | 0.132 | 29.5% | 7.2% | 13.3% | 43.4% | OF | $2,300 | OF | $2,600 | LF | $5,100 |
Elite Plays – Nelson Cruz (GPP)
Secondary Plays – Nelson Cruz (Cash)
Stackability – ORANGE
Toronto
Mike Leake has historically been tough on righties, but he has struggled with both left and right-handed hitters this season. The Blue Jays are playing at home in a good ballpark for offensive production and they have one of the highest implied run totals of the slate. A stack is certainly viable here, as the Blue Jays have eight projected starters with at least a .175 ISO against right-handed pitching.
Projected Lineup (Splits vs. RH Pitching)
| # | Player | Bats | xwOBA | L15 | ISO | HC% | BB% | K% | GB% | FD Pos. | FD Sal. | DK Pos. | DK Sal. | FDRFT Pos. | FDRFT Sal. |
|---|---|---|---|---|---|---|---|---|---|---|---|---|---|---|---|
| 1 | Curtis Granderson | LEFT | 0.354 | 0.405 | 0.250 | 35.6% | 15.4% | 23.8% | 31.3% | OF | $2,700 | OF | $3,900 | CF | $7,300 |
| 2 | Josh Donaldson | RIGHT | 0.382 | 0.247 | 0.263 | 34.7% | 15.4% | 23.1% | 42.8% | 3B | $3,800 | 3B | $4,700 | 3B | $8,400 |
| 3 | Yangervis Solarte | SWITCH | 0.322 | 0.366 | 0.202 | 32.0% | 7.9% | 13.9% | 38.0% | 3B | $3,200 | 2B/3B | $3,900 | 2B | $7,800 |
| 4 | Justin Smoak | SWITCH | 0.401 | 0.346 | 0.257 | 40.0% | 12.0% | 22.6% | 33.9% | 1B | $3,100 | 1B | $3,500 | 1B | $6,400 |
| 5 | Teoscar Hernandez | RIGHT | 0.405 | 0.391 | 0.351 | 39.4% | 6.4% | 27.0% | 34.0% | OF | $3,300 | OF | $3,900 | CF | $7,200 |
| 6 | Kevin Pillar | RIGHT | 0.318 | 0.404 | 0.142 | 28.5% | 5.3% | 15.6% | 43.6% | OF | $2,800 | OF | $3,700 | CF | $7,700 |
| 7 | Russell Martin | RIGHT | 0.342 | 0.326 | 0.186 | 30.0% | 13.1% | 22.0% | 52.0% | C | $2,300 | C | $3,000 | C | $6,000 |
| 8 | Kendrys Morales | SWITCH | 0.355 | 0.312 | 0.177 | 36.0% | 7.9% | 22.1% | 46.8% | 1B | $2,300 | 1B | $3,300 | 1B | $6,600 |
| 9 | Lourdes Gurriel | RIGHT | 0.389 | 0.373 | 0.175 | 41.4% | 2.4% | 26.8% | 27.6% | OF | $2,300 | 2B/SS | $2,800 | 2B | $5,700 |
Elite Plays – Curtis Granderson, Josh Donaldson, Justin Smoak, Teoscar Hernandez
Secondary Plays – Yangervis Solarte, Russell Martin (DK)
Stackability – YELLOW / GREEN
Atlanta at Miami – 7:10 PM ET
| Atlanta | Miami | ||||||||||||||
 | Mike Foltynewicz |  | Caleb Smith | ||||||||||||
| RIGHT | LEFT | ||||||||||||||
| Vegas Moneyline | Vegas Over/Under | ||||||||||||||
| ATL-110 | 7.5 | ||||||||||||||
| Stats | wOBA | xwOBA | HC% | BB% | K% | GB% | Stats | wOBA | xwOBA | HC% | BB% | K% | GB% | ||
|---|---|---|---|---|---|---|---|---|---|---|---|---|---|---|---|
| SP vs. Left (2016-17) | 0.361 | 0.354 | 33.9% | 10.7% | 21.1% | 31.9% | SP vs. Left (2016-17) | 0.311 | 0.324 | 34.1% | 9.7% | 29.2% | 38.6% | ||
| SP vs. Right (2016-17) | 0.312 | 0.320 | 26.1% | 7.2% | 22.6% | 46.6% | SP vs. Right (2016-17) | 0.301 | 0.333 | 36.3% | 12.8% | 28.9% | 25.6% | ||
Pitcher Grind Down
| Mike Foltynewicz | |||||||||
 | FanDuel | DraftKings | FantasyDraft | ||||||
| Salary: | $7,500 | Salary: | $9,500 | Salary: | $18,700 | ||||
| Salary Rank: | 11 of 20 | Salary Rank: | 5 of 20 | Salary Rank: | 5 of 20 | ||||
| Stats | Starts | SIERA | ERA | K% | BB% | GB% | HC% | SC% | |
|---|---|---|---|---|---|---|---|---|---|
| 2017 | 28 | 4.57 | 4.79 | 20.7% | 8.5% | 39.4% | 28.1% | 15.8% | |
| 2018 | 7 | 3.94 | 3.65 | 26.9% | 10.6% | 38.8% | 38.8% | 14.3% | |
| L14 | 2 | 4.39 | 5.73 | 20.4% | 8.2% | 31.4% | 48.6% | 11.4% | |
Foltynewicz is having a solid year overall, but has struggled in his last two starts. He’s always had an electric fastball, but has never been able to turn that into an above-average strikeout rate until this season. The Marlins have been a pesky offense for opposing pitchers, but are still an exploitable matchup on paper. Their projected lineup has a .289 xwOBA and a 24% strikeout rate against right-handed pitching.
Quick Breakdown: Foltynewicz is viable in all formats, although I prefer him as an SP2.
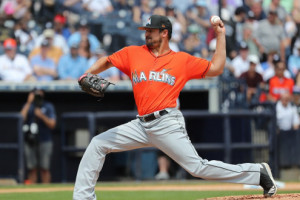
| Caleb Smith | |||||||||
 | FanDuel | DraftKings | FantasyDraft | ||||||
| Salary: | $7,600 | Salary: | $7,300 | Salary: | $14,400 | ||||
| Salary Rank: | 10 of 20 | Salary Rank: | 10 of 20 | Salary Rank: | 10 of 20 | ||||
| Stats | Starts | SIERA | ERA | K% | BB% | GB% | HC% | SC% | |
|---|---|---|---|---|---|---|---|---|---|
| 2017 | 2 | 4.86 | 7.71 | 20.9% | 11.6% | 27.6% | 32.8% | 19.0% | |
| 2018 | 7 | 3.44 | 3.67 | 33.8% | 12.0% | 31.6% | 37.7% | 15.6% | |
| L14 | 2 | 2.31 | 0.00 | 36.4% | 4.6% | 44.0% | 38.5% | 19.2% | |
Smith has really surprised so far this season, posting a 3.44 SIERA with a strikeout rate of 33%. While those numbers are impressive, he has a 12% walk rate with a hard contact rate that is higher than his ground ball rate. With the way the Braves have been swinging the bat, targeting a pitcher against them is a bit scary. With that said, I am looking to spend up on bats tonight and Smith is one way to do just that.
Quick Breakdown: Smith is cheap and offers enough strikeout upside that he’s on my radar for tournaments.
Batter Grind Down
Atlanta
The Braves aren’t playing in the most hitter-friendly of ballparks, but they are facing a fly-ball pitcher that gives up a lot of hard contact. This offense has been firing on all cylinders and there’s no reason for it to slow down now. Since the start of last season, Smith has allowed a .333 xwOBA and a 36% hard contact rate to right-handed hitters. Ozzie Albies and Ronald Acuna are the top targets against the southpaw.
Projected Lineup (Splits vs. LH Pitching)
| # | Player | Bats | xwOBA | L15 | ISO | HC% | BB% | K% | GB% | FD Pos. | FD Sal. | DK Pos. | DK Sal. | FDRFT Pos. | FDRFT Sal. |
|---|---|---|---|---|---|---|---|---|---|---|---|---|---|---|---|
| 1 | Ozzie Albies | SWITCH | 0.396 | 0.333 | 0.304 | 39.3% | 6.9% | 9.9% | 42.2% | 2B | $4,600 | 2B | $5,200 | 2B | $10,100 |
| 2 | Ronald Acuna | RIGHT | 0.405 | 0.379 | 0.333 | 41.2% | 0.0% | 18.2% | 47.1% | OF | $4,200 | OF | $4,700 | LF | $9,100 |
| 3 | Freddie Freeman | LEFT | 0.377 | 0.427 | 0.238 | 36.5% | 9.3% | 22.8% | 38.9% | 1B | $4,300 | 1B | $5,400 | 1B | $11,000 |
| 4 | Nick Markakis | LEFT | 0.323 | 0.422 | 0.155 | 30.4% | 7.9% | 15.9% | 50.3% | OF | $3,700 | OF | $3,900 | RF | $7,200 |
| 5 | Jose Bautista | RIGHT | 0.279 | 0.373 | 0.122 | 21.9% | 12.2% | 25.6% | 42.9% | 3B | $3,100 | 3B/OF | $3,500 | IF/OF | $6,700 |
| 6 | Tyler Flowers | RIGHT | 0.399 | 0.236 | 0.103 | 28.9% | 16.7% | 18.1% | 57.8% | C | $2,200 | C | $2,600 | C | $4,600 |
| 7 | Johan Camargo | SWITCH | 0.347 | 0.362 | 0.247 | 34.8% | 4.3% | 21.5% | 40.6% | SS | $3,000 | 3B/SS | $3,200 | SS | $6,500 |
| 8 | Mike Foltynewicz | RIGHT | 0.000 | 0.035 | 0.000 | 0.0% | 0.0% | 75.0% | 0.0% | P | $7,500 | P | $9,500 | P | $18,700 |
| 9 | Ender Inciarte | LEFT | 0.271 | 0.283 | 0.060 | 18.6% | 8.3% | 12.7% | 60.5% | OF | $2,800 | OF | $3,900 | CF | $7,200 |
Elite Plays – Ozzie Albies
Secondary Plays – Ronald Acuna, Freddie Freeman, Nick Markakis
Stackability – ORANGE
Miami
The Marlins have been an easy offense to avoid this season. While they’ve made it tough on pitchers, they don’t have much to offer when it comes to upside. Their matchup against Mike Foltynewicz is mediocre at best. He has struggled a bit against lefties, allowing a .354 xwOBA over the last two seasons. Justin Bour is a decent one-off in tournaments, but the rest of the Marlins can be avoided.
Projected Lineup (Splits vs. RH Pitching)
| # | Player | Bats | xwOBA | L15 | ISO | HC% | BB% | K% | GB% | FD Pos. | FD Sal. | DK Pos. | DK Sal. | FDRFT Pos. | FDRFT Sal. |
|---|---|---|---|---|---|---|---|---|---|---|---|---|---|---|---|
| 1 | J.T. Realmuto | RIGHT | 0.337 | 0.375 | 0.168 | 33.9% | 5.4% | 18.0% | 49.5% | C | $3,400 | C | $3,800 | C | $7,200 |
| 2 | Martin Prado | RIGHT | 0.290 | 0.265 | 0.098 | 20.5% | 4.0% | 14.1% | 46.7% | 3B | $2,200 | 3B | $3,000 | 3B | $5,600 |
| 3 | Starlin Castro | RIGHT | 0.301 | 0.321 | 0.139 | 30.6% | 4.2% | 19.5% | 53.1% | 2B | $3,200 | 2B | $3,400 | 2B | $6,400 |
| 4 | Justin Bour | LEFT | 0.407 | 0.439 | 0.261 | 40.6% | 11.8% | 20.1% | 41.3% | 1B | $3,200 | 1B | $3,400 | 1B | $6,600 |
| 5 | Brian Anderson | RIGHT | 0.309 | 0.371 | 0.103 | 29.5% | 10.6% | 25.0% | 53.6% | 3B | $3,200 | 3B/OF | $3,300 | 3B | $6,600 |
| 6 | Derek Dietrich | LEFT | 0.319 | 0.322 | 0.163 | 34.7% | 6.6% | 21.6% | 38.3% | OF | $2,300 | OF | $2,800 | IF/OF | $5,600 |
| 7 | Cameron Maybin | RIGHT | 0.300 | 0.364 | 0.149 | 26.4% | 13.0% | 22.1% | 54.5% | OF | $2,200 | OF | $3,000 | CF | $5,600 |
| 8 | Miguel Rojas | RIGHT | 0.304 | 0.350 | 0.095 | 24.0% | 7.1% | 11.0% | 54.2% | SS | $2,300 | SS | $2,600 | 2B | $4,500 |
| 9 | Caleb Smith | LEFT | 0.031 | 0.022 | 0.000 | 0.0% | 0.0% | 60.0% | 100.0% | P | $7,600 | P | $7,300 | P | $14,400 |