MLB Grind Down: Thursday, May 25th

Jump to Page 1 2 3
The RotoGrinders MLB Grind Down will give you an in-depth analysis into the upcoming MLB schedule. This article will break down the numbers for every single game and give you analysis on which trends you can exploit. While matchups are a major factor in daily fantasy baseball, there are plenty of other factors to consider such as injuries, weather, and salaries.
The analysis should point you in the right direction, but it is still up to you to decipher the information and make your own selections. No sport has more variance than baseball. The best choice is not always the right choice but following the trends will win you money over time.
Note: As always, if you want to try a new DFS site, be sure to click through a RotoGrinders link and use our DraftKings promo code, FanDuel promo code, and FantasyDraft promo code to receive the best perks in the industry.
Stackability Rating System:
GREEN – A viable full stack in cash games and GPPs.
YELLOW – A viable mini-stack in cash games and full stack in GPPs.
ORANGE – A viable stack in large field GPPs.
RED – Not a recommended stack for cash games or GPPs.
Pittsburgh at Atlanta – 12:10 PM ET
| Pittsburgh | Atlanta | ||||||||||||||
 | Ivan Nova |  | Bartolo Colon | ||||||||||||
| RIGHT | RIGHT | ||||||||||||||
| Vegas Moneyline | Vegas Over/Under | ||||||||||||||
| ATL-105 | 9.0 | ||||||||||||||
| Stats | wOBA | xwOBA | HC% | BB% | K% | GB% | Stats | wOBA | xwOBA | HC% | BB% | K% | GB% | ||
|---|---|---|---|---|---|---|---|---|---|---|---|---|---|---|---|
| SP vs. Left (2016-17) | 0.348 | 0.362 | 36.2% | 3.4% | 12.3% | 46.4% | SP vs. Left (2016-17) | 0.340 | 0.351 | 37.5% | 5.5% | 15.6% | 35.8% | ||
| SP vs. Right (2016-17) | 0.294 | 0.286 | 30.7% | 3.5% | 21.8% | 58.9% | SP vs. Right (2016-17) | 0.305 | 0.301 | 33.6% | 3.0% | 16.6% | 48.7% | ||
Pitcher Grind Down
| Ivan Nova | |||||||||
 | FanDuel | DraftKings | FantasyDraft | ||||||
| Salary: | $8,700 | Salary: | $8,700 | Salary: | $15,300 | ||||
| Salary Rank: | 6 of 24 | Salary Rank: | 8 of 24 | Salary Rank: | 9 of 24 | ||||
| Stats | Starts | SIERA | ERA | K% | BB% | GB% | HC% | SC% | |
|---|---|---|---|---|---|---|---|---|---|
| 2016 | 26 | 3.76 | 4.17 | 18.6% | 4.1% | 53.6% | 34.4% | 18.5% | |
| 2017 | 9 | 3.93 | 2.63 | 14.7% | 1.6% | 51.3% | 30.5% | 15.8% | |
We have all kinds of slates on tap today. We have the six game early-only slate, the 12 game all-day slate, and the five game main slate. We will cover every game here in the Grind Down because that’s what we do every day. Nova’s strikeout rate is all the way down to 15% this season. He does a good job of inducing ground balls and getting right-handed hitters out, but this ballpark does not suit his skill set. SunTrust Park is extremely favorable to left-handed hitters and that has been Nova’s biggest weakness throughout his career.
Quick Breakdown: Nova can be avoided in all formats.
| Bartolo Colon | |||||||||
 | FanDuel | DraftKings | FantasyDraft | ||||||
| Salary: | $6,700 | Salary: | $5,900 | Salary: | $13,600 | ||||
| Salary Rank: | 19 of 24 | Salary Rank: | 18 of 24 | Salary Rank: | 14 of 24 | ||||
| Stats | Starts | SIERA | ERA | K% | BB% | GB% | HC% | SC% | |
|---|---|---|---|---|---|---|---|---|---|
| 2016 | 33 | 4.37 | 3.43 | 16.2% | 4.1% | 43.2% | 35.4% | 16.2% | |
| 2017 | 9 | 4.63 | 6.38 | 15.7% | 5.2% | 38.9% | 36.4% | 20.0% | |
If Colon is favored in a game when the Braves don’t have Freddie Freeman, that says a lot about how little Vegas trusts Ivan Nova and the Pirates. Even though Colon is favored, he should not be on your radar in the early slate. His numbers are down across the board this season, posting a 4.63 SIERA with a strikeout rate of only 16%. He has always given up a lot of hard contact and his home park isn’t doing him any favors. The Pirates aren’t great against right-handed pitching, but they have enough pieces to make it tough on Colon in this ballpark.
Quick Breakdown: Colon has more blowup potential than upside at this point in his career.
Batter Grind Down
Pittsburgh
The Pirates and Braves played nine innings to a draw last night, but Pittsburgh teed off on Josh Collmenter and ended up scoring seven runs in the top of the tenth inning. As an owner of Josh Bell, it was extremely frustrating to see him go 0-for-6 in a game where the Pirates scored 12 runs. I will be going right back to the well today, as Bartolo Colon has allowed a .351 xwOBA with a 37% hard contact rate to left-handed hitters. Adam Frazier, Josh Harrison, and Andrew McCutchen are also in play.
Projected Lineup (Splits vs. RH Pitching)
| # | Player | Bats | wOBA | xwOBA | ISO | HC% | BB% | K% | GB% | FD Pos. | FD Sal. | DK Pos. | DK Sal. | FDRFT Pos. | FDRFT Sal. |
|---|---|---|---|---|---|---|---|---|---|---|---|---|---|---|---|
| 1 | Adam Frazier | LEFT | 0.344 | 0.334 | 0.132 | 32.3% | 7.2% | 15.5% | 43.0% | OF | $3,400 | 2B/OF | $3,800 | IF/OF | $7,600 |
| 2 | Josh Harrison | RIGHT | 0.298 | 0.274 | 0.103 | 27.4% | 4.0% | 14.9% | 43.5% | 3B | $3,000 | 2B/3B | $3,900 | 2B | $7,800 |
| 3 | Andrew McCutchen | RIGHT | 0.310 | 0.331 | 0.155 | 34.7% | 9.3% | 21.3% | 36.8% | OF | $2,900 | OF | $3,700 | RF | $6,400 |
| 4 | Josh Bell | SWITCH | 0.357 | 0.354 | 0.192 | 31.8% | 12.9% | 16.6% | 51.2% | 1B | $3,100 | 1B | $3,900 | IF/OF | $7,800 |
| 5 | David Freese | RIGHT | 0.320 | 0.322 | 0.136 | 32.5% | 8.6% | 27.3% | 59.6% | 3B | $2,500 | 3B | $3,100 | 3B | $6,400 |
| 6 | Francisco Cervelli | RIGHT | 0.305 | 0.321 | 0.096 | 28.5% | 12.8% | 18.8% | 52.4% | C | $3,100 | C | $3,000 | C | $6,400 |
| 7 | John Jaso | LEFT | 0.339 | 0.337 | 0.158 | 31.4% | 10.9% | 16.7% | 48.0% | 1B | $2,800 | 1B/OF | $3,000 | 1B | $6,600 |
| 8 | Jordy Mercer | RIGHT | 0.284 | 0.295 | 0.089 | 25.3% | 8.8% | 14.0% | 49.8% | SS | $2,800 | SS | $2,700 | SS | $6,400 |
| 9 | Ivan Nova | RIGHT | 0.075 | 0.058 | 0.000 | 0.0% | 0.0% | 65.0% | 50.0% | P | $8,700 | P | $8,700 | P | $15,300 |
Elite Plays – Josh Bell
Secondary Plays – Adam Frazier, Josh Harrison, Andrew McCutchen
Stackability – YELLOW
Atlanta
The Braves have a high implied run total yet again and this is something that we should get accustomed to when they are playing at home. SunTrust Park is a lot more hitter-friendly than Turner Field was. I wouldn’t recommend using any of the right-handed hitters here, as Ivan Nova has held them to a .286 xwOBA with a 59% ground ball rate. The lefties are firmly in play though, with Nova allowing a .362 xwOBA and a 36% hard contact rate. Fire up Ender Inciarte, Nick Markakis, and Matt Adams once again. If you want to complete the Braves’ stack, Matt Kemp, Tyler Flowers, and Rio Ruiz all have good power numbers against righties.
Projected Lineup (Splits vs. RH Pitching)
| # | Player | Bats | wOBA | xwOBA | ISO | HC% | BB% | K% | GB% | FD Pos. | FD Sal. | DK Pos. | DK Sal. | FDRFT Pos. | FDRFT Sal. |
|---|---|---|---|---|---|---|---|---|---|---|---|---|---|---|---|
| 1 | Ender Inciarte | LEFT | 0.311 | 0.290 | 0.112 | 26.3% | 8.3% | 14.1% | 43.8% | OF | $3,400 | OF | $4,300 | CF | $9,000 |
| 2 | Brandon Phillips | RIGHT | 0.326 | 0.304 | 0.122 | 28.7% | 3.3% | 12.1% | 48.1% | 2B | $2,700 | 2B | $4,400 | 2B | $8,700 |
| 3 | Nick Markakis | LEFT | 0.341 | 0.361 | 0.141 | 33.3% | 11.6% | 16.8% | 41.3% | OF | $2,900 | OF | $3,400 | RF | $6,800 |
| 4 | Matt Kemp | RIGHT | 0.338 | 0.351 | 0.221 | 37.0% | 5.2% | 24.2% | 39.7% | OF | $3,600 | OF | $4,800 | LF | $9,300 |
| 5 | Matt Adams | LEFT | 0.327 | 0.335 | 0.200 | 36.2% | 8.2% | 26.9% | 32.2% | 1B | $2,500 | 1B/OF | $3,500 | 1B | $7,200 |
| 6 | Kurt Suzuki | RIGHT | 0.299 | 0.310 | 0.133 | 29.9% | 6.3% | 12.2% | 41.9% | C | $2,700 | C | $3,200 | C | $6,300 |
| 7 | Rio Ruiz | LEFT | 0.335 | 0.440 | 0.294 | 63.6% | 5.6% | 33.3% | 45.5% | 3B | $2,300 | 3B | $2,900 | 3B | $5,600 |
| 8 | Dansby Swanson | RIGHT | 0.274 | 0.293 | 0.085 | 31.4% | 10.1% | 26.6% | 45.2% | SS | $2,700 | SS | $3,900 | SS | $7,200 |
| 9 | Bartolo Colon | RIGHT | 0.078 | 0.056 | 0.075 | 9.5% | 0.0% | 62.5% | 57.1% | P | $6,700 | P | $5,900 | P | $13,600 |
Elite Plays – Ender Inciarte, Nick Markakis, Matt Adams
Secondary Plays – Matt Kemp, Tyler Flowers, Rio Ruiz
Stackability – YELLOW / GREEN
Seattle at Washington – 12:05 PM ET
| Seattle | Washington | ||||||||||||||
 | Ariel Miranda |  | Gio Gonzalez | ||||||||||||
| LEFT | LEFT | ||||||||||||||
| Vegas Moneyline | Vegas Over/Under | ||||||||||||||
| WAS-144 | 9.5 | ||||||||||||||
| Stats | wOBA | xwOBA | HC% | BB% | K% | GB% | Stats | wOBA | xwOBA | HC% | BB% | K% | GB% | ||
|---|---|---|---|---|---|---|---|---|---|---|---|---|---|---|---|
| SP vs. Left (2016-17) | 0.343 | 0.327 | 33.3% | 8.1% | 18.6% | 51.7% | SP vs. Left (2016-17) | 0.276 | 0.312 | 25.3% | 8.1% | 19.1% | 57.1% | ||
| SP vs. Right (2016-17) | 0.304 | 0.309 | 33.5% | 7.7% | 21.4% | 30.9% | SP vs. Right (2016-17) | 0.332 | 0.322 | 34.1% | 8.8% | 22.3% | 44.3% | ||
Pitcher Grind Down
| Ariel Miranda | |||||||||
 | FanDuel | DraftKings | FantasyDraft | ||||||
| Salary: | $7,300 | Salary: | $6,700 | Salary: | |||||
| Salary Rank: | 17 of 24 | Salary Rank: | 16 of 24 | Salary Rank: | of 24 | ||||
| Stats | Starts | SIERA | ERA | K% | BB% | GB% | HC% | SC% | |
|---|---|---|---|---|---|---|---|---|---|
| 2016 | 10 | 4.77 | 3.88 | 19.0% | 7.8% | 31.2% | 37.1% | 17.7% | |
| 2017 | 9 | 4.06 | 4.28 | 22.9% | 7.8% | 39.7% | 29.1% | 17.7% | |
Miranda is quietly having a nice season for the Mariners, posting a 4.06 SIERA with a strikeout rate of 23%. He is a fly-ball pitcher that has shown good command and has limited the hard contact against him. He is a pitcher that should be on our radar moving forward, but he’s an easy fade today against the Nationals. He comes into the game as a sizable underdog with the over/under set at 9.5 runs. The Nationals currently lead the majors with a .375 wOBA against left-handed pitching this season.
Quick Breakdown: There is more risk than potential reward for Miranda in this start.
| Gio Gonzalez | |||||||||
 | FanDuel | DraftKings | FantasyDraft | ||||||
| Salary: | $8,600 | Salary: | $8,600 | Salary: | |||||
| Salary Rank: | 8 of 24 | Salary Rank: | 9 of 24 | Salary Rank: | of 24 | ||||
| Stats | Starts | SIERA | ERA | K% | BB% | GB% | HC% | SC% | |
|---|---|---|---|---|---|---|---|---|---|
| 2016 | 32 | 3.96 | 4.57 | 22.4% | 7.7% | 47.6% | 32.7% | 18.1% | |
| 2017 | 9 | 4.90 | 2.86 | 19.3% | 11.7% | 45.6% | 30.5% | 23.2% | |
Gonzalez has left such a bad taste in my mouth over the years that I refuse to roster him. It’s a good thing too, given the fact that he is having a down season. His ERA may say one thing, but he has a 4.90 SIERA with a decreased strikeout rate and a walk rate of 12%. He may be listed as a favorite here, but this game has an uncharacteristically high over/under of 9.5 runs.
Quick Breakdown: The Mariners have struggled against lefties this season, but I don’t play Gonzalez out of principle.
Batter Grind Down
Seattle
A team with Nelson Cruz on it should not be ranked 28th in team wOBA against left-handed pitching. Maybe a classic Gio Gonzalez start can boost them a few spots in the rankings. In all seriousness, Gonzalez has allowed a .322 xwOBA with a 34% hard contact rate to righties in the last two seasons, which brings Jean Segura, Danny Valencia, Mike Zunino, and Nelson Cruz into play.
Projected Lineup (Splits vs. LH Pitching)
| # | Player | Bats | wOBA | xwOBA | ISO | HC% | BB% | K% | GB% | FD Pos. | FD Sal. | DK Pos. | DK Sal. | FDRFT Pos. | FDRFT Sal. |
|---|---|---|---|---|---|---|---|---|---|---|---|---|---|---|---|
| 1 | Jean Segura | RIGHT | 0.326 | 0.307 | 0.136 | 30.4% | 8.2% | 20.9% | 50.7% | SS | $3,500 | SS | $4,200 | N/A | N/A |
| 2 | Guillermo Heredia | SWITCH | 0.312 | 0.291 | 0.092 | 19.1% | 8.3% | 9.3% | 48.8% | OF | $2,700 | OF | $2,400 | N/A | N/A |
| 3 | Robinson Cano | LEFT | 0.313 | 0.297 | 0.164 | 29.8% | 4.9% | 15.5% | 52.9% | 2B | $3,600 | 2B | $4,500 | N/A | N/A |
| 4 | Nelson Cruz | RIGHT | 0.423 | 0.434 | 0.347 | 38.8% | 12.2% | 21.7% | 44.8% | OF | $3,900 | OF | $4,400 | N/A | N/A |
| 5 | Kyle Seager | LEFT | 0.306 | 0.333 | 0.177 | 31.6% | 6.9% | 19.6% | 40.4% | 3B | $3,100 | 3B | $3,500 | N/A | N/A |
| 6 | Danny Valencia | RIGHT | 0.395 | 0.384 | 0.199 | 32.8% | 11.6% | 16.9% | 48.4% | 1B | $2,900 | 1B | $2,900 | N/A | N/A |
| 7 | Mike Zunino | RIGHT | 0.345 | 0.368 | 0.208 | 42.9% | 19.4% | 32.3% | 35.7% | C | $2,200 | C | $2,700 | N/A | N/A |
| 8 | Jarrod Dyson | LEFT | 0.317 | 0.262 | 0.094 | 10.0% | 6.5% | 8.1% | 63.0% | OF | $2,700 | OF | $3,400 | N/A | N/A |
| 9 | Ariel Miranda | LEFT | P | $7,300 | P | $6,700 | N/A | N/A |
Elite Plays – Nelson Cruz
Secondary Plays – Jean Segura, Danny Valencia, Mike Zunino
Stackability – ORANGE / YELLOW
Washington
The Nationals have one of the highest implied run totals in the early slate, even though their matchup against Ariel Miranda doesn’t look great on paper. Miranda has allowed a higher xwOBA to lefties, but a 52% ground ball rate isn’t appealing. Against righties, he has allowed a 33% hard contact rate and a 31% ground ball rate, which is where we should look to attack him. All of the right-handed hitters are in play here and you can complete the stack with Bryce Harper and/or Daniel Murphy.
Projected Lineup (Splits vs. LH Pitching)
| # | Player | Bats | wOBA | xwOBA | ISO | HC% | BB% | K% | GB% | FD Pos. | FD Sal. | DK Pos. | DK Sal. | FDRFT Pos. | FDRFT Sal. |
|---|---|---|---|---|---|---|---|---|---|---|---|---|---|---|---|
| 1 | Trea Turner | RIGHT | 0.285 | 0.290 | 0.079 | 36.2% | 2.2% | 22.0% | 47.1% | SS | $3,600 | SS | $4,800 | N/A | N/A |
| 2 | Jayson Werth | RIGHT | 0.431 | 0.423 | 0.289 | 43.8% | 14.9% | 19.3% | 37.1% | OF | $3,500 | OF | $3,800 | N/A | N/A |
| 3 | Bryce Harper | LEFT | 0.348 | 0.319 | 0.207 | 30.2% | 12.9% | 26.8% | 43.5% | OF | $4,700 | OF | $5,400 | N/A | N/A |
| 4 | Ryan Zimmerman | RIGHT | 0.345 | 0.373 | 0.274 | 40.2% | 9.3% | 15.5% | 52.6% | 1B | $3,700 | 1B | $4,600 | N/A | N/A |
| 5 | Daniel Murphy | LEFT | 0.387 | 0.380 | 0.228 | 33.7% | 5.8% | 12.1% | 38.0% | 2B | $3,800 | 2B | $5,000 | N/A | N/A |
| 6 | Anthony Rendon | RIGHT | 0.377 | 0.373 | 0.172 | 36.0% | 18.0% | 15.3% | 33.0% | 3B | $3,200 | 3B | $3,700 | N/A | N/A |
| 7 | Matt Wieters | SWITCH | 0.323 | 0.359 | 0.151 | 32.3% | 9.8% | 19.7% | 34.4% | C | $2,800 | C | $3,600 | N/A | N/A |
| 8 | Michael Taylor | RIGHT | 0.334 | 0.305 | 0.172 | 35.6% | 5.7% | 38.1% | 44.8% | OF | $2,900 | OF | $3,700 | N/A | N/A |
| 9 | Gio Gonzalez | LEFT | 0.000 | 0.103 | 0.000 | 22.2% | 0.0% | 35.7% | 50.0% | P | $8,600 | P | $8,600 | N/A | N/A |
Elite Plays – Trea Turner, Jayson Werth, Ryan Zimmerman, Anthony Rendon
Secondary Plays – Daniel Murphy, Bryce Harper, Matt Wieters
Stackability – YELLOW / GREEN
Colorado at Philadelphia – 1:05 PM ET
| Colorado | Philadelphia | ||||||||||||||
 | Tyler Anderson |  | Vince Velasquez | ||||||||||||
| LEFT | RIGHT | ||||||||||||||
| Vegas Moneyline | Vegas Over/Under | ||||||||||||||
| COL-104 | 8.5 | ||||||||||||||
| Stats | wOBA | xwOBA | HC% | BB% | K% | GB% | Stats | wOBA | xwOBA | HC% | BB% | K% | GB% | ||
|---|---|---|---|---|---|---|---|---|---|---|---|---|---|---|---|
| SP vs. Left (2016-17) | 0.294 | 0.298 | 23.9% | 8.0% | 21.6% | 52.7% | SP vs. Left (2016-17) | 0.344 | 0.329 | 32.8% | 10.3% | 25.3% | 38.1% | ||
| SP vs. Right (2016-17) | 0.350 | 0.289 | 30.1% | 5.9% | 21.5% | 47.1% | SP vs. Right (2016-17) | 0.321 | 0.311 | 34.3% | 7.2% | 27.8% | 36.2% | ||
Pitcher Grind Down
| Tyler Anderson | |||||||||
 | FanDuel | DraftKings | FantasyDraft | ||||||
| Salary: | $8,200 | Salary: | $6,900 | Salary: | $16,800 | ||||
| Salary Rank: | 11 of 24 | Salary Rank: | 15 of 24 | Salary Rank: | 6 of 24 | ||||
| Stats | Starts | SIERA | ERA | K% | BB% | GB% | HC% | SC% | |
|---|---|---|---|---|---|---|---|---|---|
| 2016 | 19 | 3.84 | 3.54 | 20.7% | 5.9% | 50.9% | 28.2% | 24.2% | |
| 2017 | 9 | 3.86 | 6.00 | 23.4% | 7.7% | 42.3% | 29.6% | 23.2% | |
The Rockies have absolutely dominated this series, both in terms of pitching and scoring runs. The Phillies have scored a combined five runs in the first three games and come into this game as a small underdog. I have been streaming the Rockies’ pitchers in tournaments in this series and there is no reason to stop now. The Phillies are a lot better against left-handed pitching than they are against righties, but their team wOBA and team k-rate are right around the major league average. Anderson has a high ground ball rate and an above-average strikeout rate, both of which should help him in this small ballpark.
Quick Breakdown: Anderson is a viable play in all formats given the lack of pitching options in the early slate, but I prefer him as a GPP play.
| Vince Velasquez | |||||||||
 | FanDuel | DraftKings | FantasyDraft | ||||||
| Salary: | $7,400 | Salary: | $9,200 | Salary: | $15,200 | ||||
| Salary Rank: | 16 of 24 | Salary Rank: | 5 of 24 | Salary Rank: | 10 of 24 | ||||
| Stats | Starts | SIERA | ERA | K% | BB% | GB% | HC% | SC% | |
|---|---|---|---|---|---|---|---|---|---|
| 2016 | 24 | 3.62 | 4.12 | 27.6% | 8.2% | 34.8% | 32.6% | 18.4% | |
| 2017 | 8 | 4.21 | 5.98 | 23.6% | 10.5% | 43.5% | 36.3% | 14.5% | |
There has been some speculation that the Phillies want to move Velasquez to the bullpen, but for now, they will continue to develop him as a starter. He has a great fastball and an above-average strikeout rate, but he struggles with his command and gives up a lot of hard contact. His numbers are down this season and he is running into a buzz saw in the Rockies’ offense. If he isn’t striking batters out left and right, he could really struggle against the big bats of Charlie Blackmon, Nolan Arenado, and Carlos Gonzalez.
Quick Breakdown: Velasquez has not been in good form recently and is facing a red-hot offense. He is a deep GPP flier at best.
Batter Grind Down
Colorado
The Rockies seem to like Citizens Bank Park almost as much as Coors Field. Their offense should continue to roll today against Vince Velasquez, who has given up 13 earned runs in his last three starts. Velasquez has a high walk rate and has allowed a 33+% hard contact rate to both left and right-handed hitters. The usual suspects are all in play from Colorado, especially in this small ballpark.
Projected Lineup (Splits vs. RH Pitching)
| # | Player | Bats | wOBA | xwOBA | ISO | HC% | BB% | K% | GB% | FD Pos. | FD Sal. | DK Pos. | DK Sal. | FDRFT Pos. | FDRFT Sal. |
|---|---|---|---|---|---|---|---|---|---|---|---|---|---|---|---|
| 1 | Charlie Blackmon | LEFT | 0.406 | 0.373 | 0.276 | 38.8% | 7.0% | 17.3% | 30.7% | OF | $4,500 | OF | $5,600 | CF | $10,800 |
| 2 | DJ LeMahieu | RIGHT | 0.371 | 0.374 | 0.123 | 33.0% | 9.5% | 12.5% | 53.1% | 2B | $3,000 | 2B | $4,700 | 2B | $8,700 |
| 3 | Nolan Arenado | RIGHT | 0.376 | 0.344 | 0.267 | 36.9% | 7.9% | 14.3% | 36.0% | 3B | $4,100 | 3B | $5,200 | 3B | $9,600 |
| 4 | Carlos Gonzalez | LEFT | 0.353 | 0.343 | 0.188 | 35.4% | 10.1% | 18.3% | 43.9% | OF | $3,100 | OF | $4,500 | RF | $8,400 |
| 5 | Ian Desmond | RIGHT | 0.322 | 0.305 | 0.156 | 30.0% | 6.1% | 25.5% | 55.4% | OF | $3,400 | 1B/OF | $4,100 | LF | $8,000 |
| 6 | Gerardo Parra | LEFT | 0.292 | 0.294 | 0.157 | 34.9% | 2.7% | 18.9% | 51.1% | OF | $2,700 | OF | $3,400 | LF | $7,600 |
| 7 | Trevor Story | RIGHT | 0.338 | 0.323 | 0.248 | 37.7% | 8.0% | 32.3% | 30.5% | SS | $3,300 | SS | $4,500 | SS | $8,400 |
| 8 | Tony Wolters | LEFT | 0.332 | 0.288 | 0.137 | 23.1% | 10.1% | 21.8% | 41.5% | C | $2,600 | C | $2,900 | C | $6,000 |
| 9 | Tyler Anderson | LEFT | 0.225 | 0.210 | 0.086 | 10.3% | 10.9% | 26.1% | 50.0% | P | $8,200 | P | $6,900 | P | $16,800 |
Elite Plays – Charlie Blackmon, Nolan Arenado, Carlos Gonzalez
Secondary Plays – DJ LeMahieu, Ian Desmond, Gerardo Parra
Stackability – YELLOW / GREEN
Philadelphia
The Phillies’ offense can’t seem to get anything going right now. The sledding won’t get any easier, as they take on Tyler Anderson, who is a ground ball pitcher with an above-average strikeout rate. In the last two seasons, Anderson has held both left and right-handed hitters under a .300 xwOBA and under a 31% hard contact rate. Aaron Altherr, Tommy Joseph, and Maikel Franco are all viable one-off targets, but I wouldn’t go overboard on the Phillies’ hitters.
Projected Lineup (Splits vs. LH Pitching)
| # | Player | Bats | wOBA | xwOBA | ISO | HC% | BB% | K% | GB% | FD Pos. | FD Sal. | DK Pos. | DK Sal. | FDRFT Pos. | FDRFT Sal. |
|---|---|---|---|---|---|---|---|---|---|---|---|---|---|---|---|
| 1 | Cesar Hernandez | SWITCH | 0.328 | 0.284 | 0.089 | 22.5% | 7.3% | 19.4% | 58.4% | 2B | $2,900 | 2B | $3,500 | 2B | $7,200 |
| 2 | Freddy Galvis | SWITCH | 0.237 | 0.262 | 0.112 | 25.0% | 2.1% | 17.9% | 40.7% | SS | $2,600 | SS | $3,200 | SS | $6,300 |
| 3 | Aaron Altherr | RIGHT | 0.376 | 0.350 | 0.233 | 33.9% | 11.9% | 20.2% | 48.2% | OF | $3,700 | OF | $4,100 | LF | $8,000 |
| 4 | Tommy Joseph | RIGHT | 0.371 | 0.376 | 0.311 | 35.5% | 10.1% | 22.5% | 33.3% | 1B | $3,500 | 1B | $3,800 | 1B | $7,200 |
| 5 | Maikel Franco | RIGHT | 0.342 | 0.360 | 0.227 | 38.5% | 6.7% | 16.7% | 43.7% | 3B | $3,200 | 3B | $3,800 | 3B | $7,600 |
| 6 | Odubel Herrera | LEFT | 0.296 | 0.284 | 0.076 | 23.9% | 9.2% | 22.8% | 58.5% | OF | $2,800 | OF | $2,800 | IF/OF | $6,000 |
| 7 | Cameron Rupp | RIGHT | 0.420 | 0.316 | 0.306 | 39.7% | 7.5% | 28.3% | 50.0% | C | $2,400 | C | $3,100 | C | $6,300 |
| 8 | Ty Kelly | SWITCH | 0.398 | 0.297 | 0.130 | 31.8% | 17.2% | 6.9% | 40.9% | 1B | $2,100 | 3B/OF | $2,400 | IF/OF | $4,500 |
| 9 | Vince Velasquez | RIGHT | 0.277 | 0.235 | 0.071 | 20.0% | 0.0% | 28.6% | 50.0% | P | $7,400 | P | $9,200 | P | $15,200 |
Elite Plays – None
Secondary Plays – Aaron Altherr, Tommy Joseph, Maikel Franco
Stackability – RED
Kansas City at NY Yankees – 1:05 PM ET
| Kansas City | NY Yankees | ||||||||||||||
 | Miguel Almonte |  | Masahiro Tanaka | ||||||||||||
| RIGHT | RIGHT | ||||||||||||||
| Vegas Moneyline | Vegas Over/Under | ||||||||||||||
| NYY-181 | 8.5 | ||||||||||||||
| Stats | wOBA | xwOBA | HC% | BB% | K% | GB% | Stats | wOBA | xwOBA | HC% | BB% | K% | GB% | ||
|---|---|---|---|---|---|---|---|---|---|---|---|---|---|---|---|
| SP vs. Left (2016-17) | SP vs. Left (2016-17) | 0.294 | 0.301 | 32.0% | 4.1% | 19.7% | 51.6% | ||||||||
| SP vs. Right (2016-17) | SP vs. Right (2016-17) | 0.313 | 0.316 | 33.0% | 5.8% | 20.1% | 45.6% | ||||||||
Pitcher Grind Down
| Miguel Almonte | |||||||||
 | FanDuel | DraftKings | FantasyDraft | ||||||
| Salary: | $5,500 | Salary: | $4,400 | Salary: | $9,300 | ||||
| Salary Rank: | 23 of 24 | Salary Rank: | 23 of 24 | Salary Rank: | 20 of 24 | ||||
| Stats | Starts | SIERA | ERA | K% | BB% | GB% | HC% | SC% | |
|---|---|---|---|---|---|---|---|---|---|
Almonte made nine appearances out of the bullpen in 2015, but will be making his first career major league start today against the Yankees. The Royals probably didn’t pick the best time to roll Almonte out for his major league debut, but I’m sure he will take whatever he can get. He has had a strikeout rate of at least 20% in each of his last three seasons in the minors, but has struggled with his command at times. It rarely hurts to take a wait and see approach in these situations, which is exactly what I will be doing with Almonte.
Quick Breakdown: Almonte can be avoided for now.
| Masahiro Tanaka | |||||||||
 | FanDuel | DraftKings | FantasyDraft | ||||||
| Salary: | $8,300 | Salary: | $9,700 | Salary: | $17,200 | ||||
| Salary Rank: | 10 of 24 | Salary Rank: | 3 of 24 | Salary Rank: | 4 of 24 | ||||
| Stats | Starts | SIERA | ERA | K% | BB% | GB% | HC% | SC% | |
|---|---|---|---|---|---|---|---|---|---|
| 2016 | 31 | 3.79 | 3.07 | 20.5% | 4.5% | 48.2% | 32.5% | 18.5% | |
| 2017 | 9 | 4.32 | 6.56 | 17.8% | 6.9% | 49.7% | 32.7% | 18.5% | |
Tanaka hasn’t been great this season, but his 6.56 ERA is partly due to some bad luck. He currently has a .329 BABIP and a 24% HR/FB rate, both of which are well above the major league averages. Tanaka’s velocity hasn’t changed since last year and he is actually generating more swings and misses (12.6%). Everyone wants to say that the sky is falling, but I’m not jumping ship just yet. He has some positive regression coming his way in both home runs and strikeouts. I see this as a great opportunity to buy low, both in terms of price and ownership.
Quick Breakdown: This may be a hot take, but Tanaka is my favorite pitcher in the early slate.
Batter Grind Down
Kansas City
The Royals were blanked by Luis Severino and the Yankees last night and I’m expecting more of the same today against Masahiro Tanaka. Sure, he is coming off of two horrendous starts, but he’s not going to continue to give up a home run every four fly balls. The Royals do not hit right-handed pitching well and are huge underdogs in this game. Being so high on Tanaka could burn me, but I am doubling down by avoiding the Royals’ offense completely.
Projected Lineup (Splits vs. RH Pitching)
| # | Player | Bats | wOBA | xwOBA | ISO | HC% | BB% | K% | GB% | FD Pos. | FD Sal. | DK Pos. | DK Sal. | FDRFT Pos. | FDRFT Sal. |
|---|---|---|---|---|---|---|---|---|---|---|---|---|---|---|---|
| 1 | Alcides Escobar | RIGHT | 0.265 | 0.250 | 0.078 | 20.9% | 3.6% | 16.1% | 47.1% | SS | $2,200 | SS | $2,500 | SS | $4,400 |
| 2 | Mike Moustakas | LEFT | 0.354 | 0.364 | 0.260 | 36.4% | 7.1% | 14.6% | 35.8% | 3B | $3,300 | 3B | $3,800 | 3B | $8,100 |
| 3 | Lorenzo Cain | RIGHT | 0.314 | 0.300 | 0.092 | 28.2% | 7.5% | 20.5% | 49.8% | OF | $3,400 | OF | $3,400 | CF | $7,200 |
| 4 | Eric Hosmer | LEFT | 0.349 | 0.355 | 0.162 | 35.2% | 10.0% | 18.1% | 57.0% | 1B | $3,100 | 1B | $3,900 | 1B | $7,200 |
| 5 | Salvador Perez | RIGHT | 0.328 | 0.311 | 0.209 | 37.4% | 3.6% | 21.0% | 34.2% | C | $3,400 | C | $3,900 | C | $7,200 |
| 6 | Jorge Bonifacio | RIGHT | 0.365 | 0.357 | 0.200 | 31.6% | 8.9% | 23.2% | 34.2% | OF | $2,800 | OF | $3,700 | RF | $7,600 |
| 7 | Brandon Moss | LEFT | 0.325 | 0.339 | 0.283 | 39.9% | 9.8% | 31.1% | 26.2% | 1B | $2,800 | OF | $3,900 | IF/OF | $7,600 |
| 8 | Whit Merrifield | RIGHT | 0.279 | 0.285 | 0.116 | 31.8% | 4.6% | 20.7% | 42.9% | 2B | $2,800 | 2B | $3,600 | IF/OF | $7,200 |
| 9 | Alex Gordon | LEFT | 0.293 | 0.319 | 0.140 | 35.6% | 10.4% | 27.1% | 39.7% | OF | $2,700 | OF | $3,700 | LF | $7,200 |
Elite Plays – None
Secondary Plays – None
Stackability – RED
NY Yankees
We never really know what to expect from pitchers that are making their first career major league starts. There are some exceptions, but generally they don’t pan out as well as the pitchers dream they will. The Yankees have struggled with elite pitchers this season, but has mashed average to below-average starters. They didn’t have the big outing that we were expecting them to last night, but they have a chance for redemption here. A Yankees’ stack is firmly in play for both cash games and tournaments.
Projected Lineup (Splits vs. RH Pitching)
| # | Player | Bats | wOBA | xwOBA | ISO | HC% | BB% | K% | GB% | FD Pos. | FD Sal. | DK Pos. | DK Sal. | FDRFT Pos. | FDRFT Sal. |
|---|---|---|---|---|---|---|---|---|---|---|---|---|---|---|---|
| 1 | Brett Gardner | LEFT | 0.346 | 0.323 | 0.139 | 28.8% | 12.9% | 16.8% | 49.0% | OF | $3,700 | OF | $4,700 | LF | $9,200 |
| 2 | Gary Sanchez | RIGHT | 0.433 | 0.389 | 0.317 | 40.0% | 8.7% | 22.2% | 51.0% | C | $3,200 | C | $4,500 | C | $9,000 |
| 3 | Matt Holliday | RIGHT | 0.338 | 0.346 | 0.198 | 35.3% | 9.3% | 21.0% | 52.2% | 1B | $3,200 | 1B | $4,000 | IF/OF | $8,000 |
| 4 | Starlin Castro | RIGHT | 0.330 | 0.308 | 0.171 | 30.8% | 3.5% | 19.2% | 49.5% | 2B | $3,400 | 2B | $3,700 | 2B | $7,200 |
| 5 | Aaron Judge | RIGHT | 0.398 | 0.392 | 0.315 | 49.1% | 10.2% | 34.1% | 42.0% | OF | $4,100 | OF | $5,000 | RF | $9,200 |
| 6 | Chase Headley | SWITCH | 0.322 | 0.322 | 0.161 | 32.1% | 10.6% | 26.4% | 43.6% | 3B | $2,700 | 3B | $3,300 | 3B | $6,600 |
| 7 | Didi Gregorius | LEFT | 0.306 | 0.263 | 0.167 | 25.1% | 3.4% | 15.7% | 41.5% | SS | $3,200 | SS | $3,800 | SS | $7,200 |
| 8 | Aaron Hicks | SWITCH | 0.336 | 0.308 | 0.155 | 23.8% | 12.6% | 17.8% | 48.3% | OF | $3,200 | OF | $4,000 | CF | $8,400 |
| 9 | Chris Carter | RIGHT | 0.335 | 0.349 | 0.248 | 39.5% | 11.5% | 34.3% | 30.1% | 1B | $2,900 | 1B | $3,700 | 1B | $7,800 |
Elite Plays – Brett Gardner, Gary Sanchez, Aaron Judge
Secondary Plays – Matt Holliday, Starlin Castro, Chase Headley, Didi Gregorius
Stackability – GREEN
LA Angels at Tampa Bay – 1:10 PM ET
| LA Angels | Tampa Bay | ||||||||||||||
 | Daniel Wright |  | Matt Andriese | ||||||||||||
| RIGHT | RIGHT | ||||||||||||||
| Vegas Moneyline | Vegas Over/Under | ||||||||||||||
| TB -132 | 8.5 | ||||||||||||||
| Stats | wOBA | xwOBA | HC% | BB% | K% | GB% | Stats | wOBA | xwOBA | HC% | BB% | K% | GB% | ||
|---|---|---|---|---|---|---|---|---|---|---|---|---|---|---|---|
| SP vs. Left (2016-17) | 0.389 | 0.367 | 37.0% | 6.9% | 11.8% | 41.8% | SP vs. Left (2016-17) | 0.283 | 0.307 | 36.5% | 6.5% | 20.9% | 43.2% | ||
| SP vs. Right (2016-17) | 0.389 | 0.388 | 33.3% | 5.3% | 12.1% | 36.5% | SP vs. Right (2016-17) | 0.336 | 0.324 | 36.6% | 5.5% | 21.0% | 44.9% | ||
Pitcher Grind Down
| Daniel Wright | |||||||||
 | FanDuel | DraftKings | FantasyDraft | ||||||
| Salary: | $5,500 | Salary: | $5,200 | Salary: | $9,600 | ||||
| Salary Rank: | 23 of 24 | Salary Rank: | 21 of 24 | Salary Rank: | 19 of 24 | ||||
| Stats | Starts | SIERA | ERA | K% | BB% | GB% | HC% | SC% | |
|---|---|---|---|---|---|---|---|---|---|
| 2016 | 7 | 5.04 | 6.13 | 11.7% | 4.5% | 38.7% | 38.6% | 17.2% | |
| 2017 | 1 | 5.47 | 5.54 | 12.7% | 10.9% | 39.0% | 22.0% | 14.6% | |
Wright is making his second start of the season and his eighth in the last two years. He has not had success at the major league level. He is a fly-ball pitcher with a low strikeout rate and a high hard contact rate. His teammate, Jered Weaver, knows as well as anyone that that specific combination doesn’t produce good results.
Quick Breakdown: It doesn’t matter the opponent, Wright should be avoided in all formats.
| Matt Andriese | |||||||||
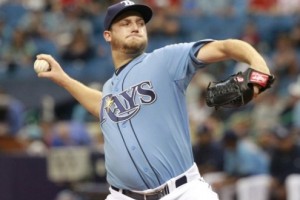 | FanDuel | DraftKings | FantasyDraft | ||||||
| Salary: | $7,600 | Salary: | $7,700 | Salary: | $15,000 | ||||
| Salary Rank: | 13 of 24 | Salary Rank: | 12 of 24 | Salary Rank: | 11 of 24 | ||||
| Stats | Starts | SIERA | ERA | K% | BB% | GB% | HC% | SC% | |
|---|---|---|---|---|---|---|---|---|---|
| 2016 | 19 | 3.90 | 4.37 | 20.7% | 4.7% | 42.9% | 34.3% | 16.6% | |
| 2017 | 9 | 4.15 | 3.75 | 21.8% | 8.8% | 47.3% | 42.6% | 14.9% | |
Andriese biggest weakness is that he allows a ton of hard and medium contact. Other than that, his numbers aren’t half bad. In nine starts this season, he has a 4.15 SIERA with a strikeout rate of 22% and a ground ball rate of 47%. Those numbers are certainly viable when talking about a cheap value pitcher. His matchup against the low-strikeout Angels isn’t ideal, but he gets to face them at home in a pitcher-friendly ballpark.
Quick Breakdown: Andriese is viable as an SP2 in cash games or as an SP1 in tournaments in the early slate.
Batter Grind Down
LA Angels
Matt Andriese isn’t a bad pitcher by any means, but he’s not someone that we should automatically fade hitters against. In the last two seasons, he has allowed a .324 xwOBA and a 36% hard contact rate to right-handed hitters. Mike Trout is good at baseball and should be treated as such. He has a massive .432 xwOBA against righties in the last two seasons. Luis Valbuena is also an interesting value play at his price point.
Projected Lineup (Splits vs. RH Pitching)
| # | Player | Bats | wOBA | xwOBA | ISO | HC% | BB% | K% | GB% | FD Pos. | FD Sal. | DK Pos. | DK Sal. | FDRFT Pos. | FDRFT Sal. |
|---|---|---|---|---|---|---|---|---|---|---|---|---|---|---|---|
| 1 | Cameron Maybin | RIGHT | 0.334 | 0.294 | 0.094 | 22.5% | 11.0% | 17.4% | 63.9% | OF | $3,500 | OF | $4,600 | CF | $9,000 |
| 2 | Mike Trout | RIGHT | 0.435 | 0.432 | 0.280 | 41.1% | 16.9% | 20.9% | 39.5% | OF | $5,000 | OF | $5,500 | CF | $10,800 |
| 3 | Albert Pujols | RIGHT | 0.317 | 0.362 | 0.160 | 35.1% | 7.7% | 13.2% | 44.4% | 1B | $2,800 | 1B | $3,700 | 1B | $7,200 |
| 4 | Luis Valbuena | LEFT | 0.344 | 0.331 | 0.205 | 36.9% | 14.2% | 25.2% | 36.6% | 3B | $2,400 | 1B/3B | $3,200 | 3B | $6,400 |
| 5 | Andrelton Simmons | RIGHT | 0.302 | 0.305 | 0.089 | 27.2% | 6.1% | 9.2% | 54.9% | SS | $3,100 | SS | $3,700 | SS | $7,600 |
| 6 | Kole Calhoun | LEFT | 0.327 | 0.339 | 0.154 | 34.4% | 9.7% | 18.8% | 38.1% | OF | $2,900 | OF | $3,100 | RF | $6,000 |
| 7 | Martin Maldonado | RIGHT | 0.278 | 0.295 | 0.131 | 28.7% | 10.7% | 22.1% | 46.5% | C | $2,500 | C | $2,500 | C | $4,500 |
| 8 | Danny Espinosa | SWITCH | 0.282 | 0.284 | 0.140 | 31.1% | 9.8% | 30.1% | 38.7% | 2B | $2,200 | 2B | $3,100 | 2B | $5,700 |
| 9 | Cliff Pennington | SWITCH | 0.284 | 0.277 | 0.089 | 25.6% | 9.3% | 26.6% | 38.1% | SS | $2,300 | 2B/SS | $2,100 | 2B | $4,000 |
Elite Plays – Mike Trout
Secondary Plays – Luis Valbuena
Stackability – ORANGE
Tampa Bay
Daniel Wright is a right-handed pitcher that struggles with all kinds of hitters. Left-handed, right-handed, no-handed, it doesn’t matter. In his last eight major league starts, he has allowed a .367+ xwOBA and a 33%+ hard contact rate to batters from both sides of the plate. This is a perfect matchup for Tampa Bay because their biggest weakness is that they are prone to strikeouts. That shouldn’t be a problem against Wright, who has a k-rate under 13%. A Ray’s stack is viable in both cash games and tournaments.
Projected Lineup (Splits vs. RH Pitching)
| # | Player | Bats | wOBA | xwOBA | ISO | HC% | BB% | K% | GB% | FD Pos. | FD Sal. | DK Pos. | DK Sal. | FDRFT Pos. | FDRFT Sal. |
|---|---|---|---|---|---|---|---|---|---|---|---|---|---|---|---|
| 1 | Corey Dickerson | LEFT | 0.356 | 0.325 | 0.276 | 33.3% | 6.6% | 22.5% | 34.8% | OF | $3,900 | OF | $4,700 | LF | $9,200 |
| 2 | Kevin Kiermaier | LEFT | 0.314 | 0.290 | 0.142 | 29.8% | 10.0% | 18.1% | 46.1% | OF | $2,700 | OF | $3,100 | CF | $6,300 |
| 3 | Evan Longoria | RIGHT | 0.356 | 0.355 | 0.249 | 37.2% | 5.9% | 20.7% | 34.1% | 3B | $2,800 | 3B | $4,000 | 3B | $8,100 |
| 4 | Logan Morrison | LEFT | 0.332 | 0.360 | 0.221 | 37.4% | 10.0% | 22.9% | 42.2% | 1B | $3,700 | 1B | $4,100 | 1B | $8,700 |
| 5 | Tim Beckham | RIGHT | 0.311 | 0.304 | 0.206 | 42.8% | 3.8% | 31.5% | 38.9% | SS | $2,900 | SS | $2,900 | SS | $5,700 |
| 6 | Colby Rasmus | LEFT | 0.305 | 0.308 | 0.174 | 36.4% | 10.6% | 29.9% | 38.1% | OF | $2,700 | OF | $3,200 | LF | $6,600 |
| 7 | Steve Souza | RIGHT | 0.328 | 0.305 | 0.174 | 30.9% | 9.0% | 31.8% | 41.3% | OF | $3,000 | OF | $3,200 | RF | $6,800 |
| 8 | Derek Norris | RIGHT | 0.253 | 0.270 | 0.138 | 31.5% | 7.0% | 32.1% | 33.9% | C | $2,700 | C | $2,800 | C | $6,000 |
| 9 | Daniel Robertson | RIGHT | 0.330 | 0.296 | 0.125 | 29.6% | 14.6% | 29.2% | 48.0% | OF | $2,200 | OF | $2,600 | SS | $5,200 |