MLB Grind Down: Wednesday, September 27th

Jump to Page 1 2 3
The RotoGrinders MLB Grind Down will give you an in-depth analysis into the upcoming MLB schedule. This article will break down the numbers for every single game and give you analysis on which trends you can exploit. While matchups are a major factor in daily fantasy baseball, there are plenty of other factors to consider such as injuries, weather, and salaries.
The analysis should point you in the right direction, but it is still up to you to decipher the information and make your own selections. No sport has more variance than baseball. The best choice is not always the right choice but following the trends will win you money over time.
Note: As always, if you want to try a new DFS site, be sure to click through a RotoGrinders link and use our DraftKings promo code, FanDuel promo code, and FantasyDraft promo code to receive the best perks in the industry.
Stackability Rating System:
GREEN – A viable full stack in cash games and GPPs.
YELLOW – A viable mini-stack in cash games and full stack in GPPs.
ORANGE – A viable stack in large field GPPs.
RED – Not a recommended stack for cash games or GPPs.
Houston at Texas – 2:05 PM ET
| Houston | Texas | ||||||||||||||
 | Justin Verlander |  | Nick Martinez | ||||||||||||
| RIGHT | RIGHT | ||||||||||||||
| Vegas Moneyline | Vegas Over/Under | ||||||||||||||
| HOU-170 | 10.0 | ||||||||||||||
| Stats | wOBA | xwOBA | HC% | BB% | K% | GB% | Stats | wOBA | xwOBA | HC% | BB% | K% | GB% | ||
|---|---|---|---|---|---|---|---|---|---|---|---|---|---|---|---|
| SP vs. Left (2016-17) | 0.308 | 0.322 | 36.0% | 11.0% | 26.7% | 31.8% | SP vs. Left (2016-17) | 0.357 | 0.358 | 32.0% | 9.3% | 13.4% | 38.5% | ||
| SP vs. Right (2016-17) | 0.273 | 0.306 | 34.8% | 6.7% | 23.8% | 35.3% | SP vs. Right (2016-17) | 0.346 | 0.330 | 28.1% | 3.4% | 14.0% | 42.1% | ||
Pitcher Grind Down
| Justin Verlander | |||||||||
 | FanDuel | DraftKings | FantasyDraft | ||||||
| Salary: | $10,600 | Salary: | $13,600 | Salary: | $26,400 | ||||
| Salary Rank: | 1 of 30 | Salary Rank: | 1 of 30 | Salary Rank: | 1 of 30 | ||||
| Stats | Starts | SIERA | ERA | K% | BB% | GB% | HC% | SC% | |
|---|---|---|---|---|---|---|---|---|---|
| 2016 | 34 | 3.42 | 3.04 | 28.1% | 6.3% | 33.7% | 28.9% | 19.7% | |
| 2017 | 31 | 4.14 | 3.50 | 25.2% | 8.7% | 33.7% | 35.4% | 17.7% | |
| L30 | 5 | 2.66 | 1.32 | 35.0% | 4.9% | 40.3% | 32.9% | 21.9% | |
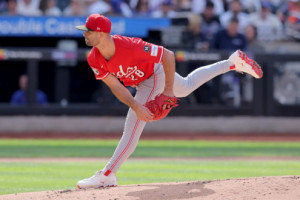
There are four early games on the schedule today and for once, all four are listed in the early slates on FanDuel, DraftKings, and FantasyDraft. Verlander has been close to unhittable in his last five starts, posting a 1.32 ERA (2.66 SIERA) with a strikeout rate of 35% and a walk rate of 5%. While he’s clearly the top pitching option of the early slate, this is his toughest matchup in quite some time. The Rangers have plenty of firepower in their lineup and he has to face them in Globe Life Park, which has yielded the second most runs of any ballpark in baseball this season.
Quick Breakdown: Verlander still has strikeout upside here, but expecting another shutout is a unrealistic. He’s the top option of the early slate.
| Nick Martinez | |||||||||
 | FanDuel | DraftKings | FantasyDraft | ||||||
| Salary: | $6,000 | Salary: | $5,200 | Salary: | $10,400 | ||||
| Salary Rank: | 25 of 30 | Salary Rank: | 28 of 30 | Salary Rank: | 27 of 30 | ||||
| Stats | Starts | SIERA | ERA | K% | BB% | GB% | HC% | SC% | |
|---|---|---|---|---|---|---|---|---|---|
| 2016 | 5 | 5.84 | 5.59 | 8.9% | 10.6% | 50.4% | 33.8% | 15.1% | |
| 2017 | 16 | 5.11 | 5.47 | 13.8% | 6.1% | 40.5% | 29.8% | 20.8% | |
| L30 | 3 | 4.09 | 5.85 | 19.8% | 3.7% | 38.7% | 27.4% | 22.6% | |
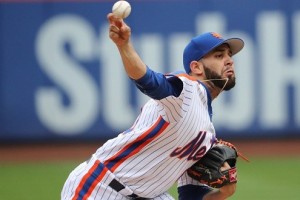
Martinez is not a pitcher that should be on your radar in DFS. Not today and not anytime in the near future. After posting a strikeout rate of 9% last season, it’s all the way up to 14% this season. Sarcasm aside, he doesn’t offer enough strikeout upside to make up for his mistakes. To make matters worse, he is facing an Astros’ offense that is ranked first in team wOBA and second in strikeout rate against right-handed pitching this season.
Quick Breakdown: The search for an SP2 on the slate is a fun one. Let’s keep looking.
Batter Grind Down
Houston
The Astros already clinched their division, but with a win and an Indians loss last night, they pulled within a game of Cleveland for the best record in the majors. Both teams have plenty to play for until one clinches home-field advantage. The Astros have the second highest implied run total in the early games, as they square off against Nick Martinez. On the season, he has allowed a .358 xwOBA to left-handed hitters and a .330 xwOBA to right-handed hitters. An Astros’ stack is viable, but we also have games in Coors Field and Chase Field to consider.
Projected Lineup (Splits vs. RH Pitching)
| # | Player | Bats | wOBA | xwOBA | ISO | HC% | BB% | K% | GB% | FD Pos. | FD Sal. | DK Pos. | DK Sal. | FDRFT Pos. | FDRFT Sal. |
|---|---|---|---|---|---|---|---|---|---|---|---|---|---|---|---|
| 1 | George Springer | RIGHT | 0.364 | 0.361 | 0.232 | 37.7% | 8.8% | 19.9% | 49.4% | OF | $3,300 | OF | $5,100 | RF | $9,900 |
| 2 | Jose Altuve | RIGHT | 0.410 | 0.358 | 0.209 | 29.3% | 8.9% | 12.8% | 45.4% | 2B | $4,400 | 2B | $5,500 | 2B | $10,800 |
| 3 | Carlos Correa | RIGHT | 0.356 | 0.374 | 0.215 | 37.6% | 10.9% | 20.9% | 47.3% | SS | $3,300 | SS | $4,700 | SS | $9,300 |
| 4 | Marwin Gonzalez | SWITCH | 0.387 | 0.331 | 0.226 | 34.8% | 9.3% | 20.3% | 43.5% | 2B | $3,400 | OF/SS | $4,400 | IF/OF | $8,400 |
| 5 | Evan Gattis | RIGHT | 0.346 | 0.323 | 0.189 | 32.5% | 6.2% | 15.3% | 35.6% | C | $2,900 | C | $3,700 | C | $7,200 |
| 6 | Alex Bregman | RIGHT | 0.328 | 0.329 | 0.171 | 32.5% | 8.3% | 16.4% | 40.9% | 3B | $3,800 | 3B/SS | $4,300 | 3B | $8,400 |
| 7 | Carlos Beltran | SWITCH | 0.305 | 0.300 | 0.180 | 32.6% | 7.1% | 18.0% | 42.5% | OF | $2,100 | OF | $3,300 | IF/OF | $6,600 |
| 8 | Tyler White | RIGHT | 0.389 | 0.319 | 0.211 | 39.3% | 7.1% | 26.2% | 39.3% | 1B | $2,500 | 1B | $3,200 | 1B | $6,400 |
| 9 | Derek Fisher | LEFT | 0.298 | 0.329 | 0.188 | 44.8% | 9.6% | 29.8% | 50.7% | OF | $2,200 | OF | $3,500 | RF | $6,900 |
Elite Plays – George Springer, Jose Altuve, Carlos Correa, Marwin Gonzalez
Secondary Plays – Evan Gattis, Alex Bregman
Stackability – GREEN
Texas
The Rangers draw the worst matchup of the slate, but at least they are playing at home in the hitter-friendly Globe Life Park. Justin Verlander has been in tremendous form over the last two months, but he’s a fly-ball pitcher that has allowed a 35% this season. In these conditions, I could certainly see a home run or two from the Rangers’ side of the ball. With that said, I’m not going to be chase it, as literally every other offense has a better matchup.
Projected Lineup (Splits vs. RH Pitching)
| # | Player | Bats | wOBA | xwOBA | ISO | HC% | BB% | K% | GB% | FD Pos. | FD Sal. | DK Pos. | DK Sal. | FDRFT Pos. | FDRFT Sal. |
|---|---|---|---|---|---|---|---|---|---|---|---|---|---|---|---|
| 1 | Shin-soo Choo | LEFT | 0.339 | 0.371 | 0.184 | 40.5% | 11.5% | 22.2% | 44.7% | OF | $3,300 | OF | $3,400 | RF | $6,600 |
| 2 | Elvis Andrus | RIGHT | 0.347 | 0.303 | 0.171 | 29.9% | 5.6% | 15.3% | 48.7% | SS | $3,300 | SS | $3,500 | SS | $6,900 |
| 3 | Nomar Mazara | LEFT | 0.340 | 0.337 | 0.200 | 34.7% | 10.6% | 19.2% | 42.3% | OF | $3,000 | OF | $3,500 | RF | $6,800 |
| 4 | Adrian Beltre | RIGHT | 0.364 | 0.343 | 0.221 | 35.5% | 8.6% | 14.5% | 45.0% | 3B | $3,200 | 3B | $3,600 | 3B | $7,200 |
| 5 | Joey Gallo | LEFT | 0.359 | 0.369 | 0.340 | 46.3% | 14.1% | 35.2% | 29.5% | 1B | $3,000 | 1B/3B | $3,400 | IF/OF | $6,600 |
| 6 | Carlos Gomez | RIGHT | 0.363 | 0.350 | 0.241 | 42.2% | 8.3% | 28.8% | 38.3% | OF | $3,500 | OF | $3,400 | CF | $6,800 |
| 7 | Rougned Odor | LEFT | 0.300 | 0.305 | 0.231 | 39.1% | 4.8% | 24.6% | 38.5% | 2B | $2,500 | 2B | $3,100 | 2B | $6,000 |
| 8 | Robinson Chirinos | RIGHT | 0.342 | 0.326 | 0.245 | 34.4% | 10.5% | 26.5% | 43.7% | C | $2,600 | C | $2,800 | C | $5,600 |
| 9 | Will Middlebrooks | RIGHT | 0.105 | 0.265 | 0.050 | 40.0% | 0.0% | 50.0% | 50.0% | 3B | $2,000 | 3B | $2,300 | 3B | $4,400 |
Elite Plays – None
Secondary Plays – None
Stackability – ORANGE
Miami at Colorado – 3:10 PM ET
| Miami | Colorado | ||||||||||||||
 | Adam Conley |  | Jon Gray | ||||||||||||
| LEFT | RIGHT | ||||||||||||||
| Vegas Moneyline | Vegas Over/Under | ||||||||||||||
| COL-180 | 11.5 | ||||||||||||||
| Stats | wOBA | xwOBA | HC% | BB% | K% | GB% | Stats | wOBA | xwOBA | HC% | BB% | K% | GB% | ||
|---|---|---|---|---|---|---|---|---|---|---|---|---|---|---|---|
| SP vs. Left (2016-17) | 0.341 | 0.331 | 35.4% | 2.9% | 15.5% | 43.6% | SP vs. Left (2016-17) | 0.310 | 0.299 | 28.9% | 8.2% | 20.6% | 52.3% | ||
| SP vs. Right (2016-17) | 0.349 | 0.348 | 39.1% | 10.5% | 16.8% | 38.3% | SP vs. Right (2016-17) | 0.321 | 0.304 | 27.9% | 5.3% | 28.7% | 43.6% | ||
Pitcher Grind Down
| Adam Conley | |||||||||
 | FanDuel | DraftKings | FantasyDraft | ||||||
| Salary: | $5,500 | Salary: | $5,000 | Salary: | $10,000 | ||||
| Salary Rank: | 28 of 30 | Salary Rank: | 30 of 30 | Salary Rank: | 29 of 30 | ||||
| Stats | Starts | SIERA | ERA | K% | BB% | GB% | HC% | SC% | |
|---|---|---|---|---|---|---|---|---|---|
| 2016 | 25 | 4.64 | 3.85 | 21.2% | 10.6% | 38.2% | 31.4% | 20.5% | |
| 2017 | 18 | 5.15 | 5.20 | 16.5% | 8.7% | 39.6% | 38.1% | 18.1% | |
| L30 | 5 | 5.44 | 5.96 | 14.7% | 7.8% | 32.6% | 46.1% | 15.7% | |
The Marlins have been out of playoff contention for quite some time, but they still have a chance to play the role of spoiler. The Rockies currently hold a game and a half lead over the Brewers for the second wildcard spot in the National League. For the Marlins to win, they will need a big outing from their offense. That’s basically a nice way of saying that Conley is going to get shelled. He has a low strikeout rate and he’s a fly-ball pitcher that gives up a lot of hard contact.
Quick Breakdown: Conley offers more downside than upside in a start against the Rockies.
| Jon Gray | |||||||||
 | FanDuel | DraftKings | FantasyDraft | ||||||
| Salary: | $7,600 | Salary: | $8,000 | Salary: | $15,600 | ||||
| Salary Rank: | 15 of 30 | Salary Rank: | 6 of 30 | Salary Rank: | 6 of 30 | ||||
| Stats | Starts | SIERA | ERA | K% | BB% | GB% | HC% | SC% | |
|---|---|---|---|---|---|---|---|---|---|
| 2016 | 29 | 3.72 | 4.61 | 26.0% | 8.3% | 43.5% | 30.6% | 17.8% | |
| 2017 | 18 | 3.83 | 3.75 | 23.9% | 7.0% | 48.9% | 28.5% | 23.6% | |
| L30 | 5 | 3.46 | 1.86 | 28.7% | 7.0% | 41.7% | 26.4% | 25.0% | |
Targeting pitchers in Coors Field is not on my list of priorities when it comes to fantasy baseball. However, when we have these short slates with limited options, we have to make difficult decisions. When it comes to an SP2, we can take Gray in Coors Field, Samardzija in Chase Field, or take a shot on a below-average starter in Oakland. I’m siding with the first option. Gray has been very sharp in his last five starts, posting a 3.46 SIERA with a strikeout rate of 29%. He has an above-average strikeout rate and an ability to generate soft and medium contact.
Quick Breakdown: While I don’t love the matchup or the ballpark, Gray is in good form and he’s the best of the SP2s that are available to us.
Batter Grind Down
Miami
The Marlins didn’t score a single run last night. I mentioned in each of the last two Grind Downs that it was expected to be cold in Denver. While the temperature hasn’t been the sole reason for the two low scoring games in this series, it has certainly played a role. It’s going to be in the upper-50s at first pitch, which is fairly cold baseball weather. Add in a matchup against Jon Gray and the Marlins aren’t very appealing. In addition to his high strikeout rate, Gray has held both left and right-handed hitters under a .305 xwOBA.
Projected Lineup (Splits vs. RH Pitching)
| # | Player | Bats | wOBA | xwOBA | ISO | HC% | BB% | K% | GB% | FD Pos. | FD Sal. | DK Pos. | DK Sal. | FDRFT Pos. | FDRFT Sal. |
|---|---|---|---|---|---|---|---|---|---|---|---|---|---|---|---|
| 1 | Dee Gordon | LEFT | 0.322 | 0.259 | 0.073 | 18.0% | 4.9% | 13.9% | 55.5% | 2B | $4,300 | 2B | $4,400 | 2B | $8,400 |
| 2 | Giancarlo Stanton | RIGHT | 0.396 | 0.386 | 0.331 | 38.1% | 10.9% | 26.0% | 43.3% | OF | $4,900 | OF | $5,600 | RF | $10,800 |
| 3 | Christian Yelich | LEFT | 0.359 | 0.363 | 0.174 | 37.2% | 12.4% | 19.8% | 54.6% | OF | $4,300 | OF | $4,500 | CF | $8,800 |
| 4 | Marcell Ozuna | RIGHT | 0.391 | 0.361 | 0.261 | 40.2% | 8.7% | 22.5% | 44.5% | OF | $4,600 | OF | $5,000 | LF | $9,900 |
| 5 | Justin Bour | LEFT | 0.383 | 0.398 | 0.250 | 43.8% | 11.4% | 20.3% | 38.9% | 1B | $4,500 | 1B | $4,900 | 1B | $9,600 |
| 6 | J.T. Realmuto | RIGHT | 0.322 | 0.322 | 0.169 | 32.9% | 4.9% | 18.4% | 49.8% | C | $3,900 | C | $4,000 | C | $7,600 |
| 7 | Derek Dietrich | LEFT | 0.305 | 0.311 | 0.184 | 33.3% | 7.0% | 21.4% | 35.8% | 3B | $3,900 | 3B | $3,800 | 3B | $7,600 |
| 8 | Miguel Rojas | RIGHT | 0.296 | 0.296 | 0.044 | 19.0% | 8.0% | 11.9% | 53.2% | SS | $3,400 | SS | $3,600 | 2B | $7,200 |
| 9 | Adam Conley | LEFT | 0.166 | 0.000 | 0.0% | 4.5% | 45.5% | 66.7% | P | $5,500 | P | $5,000 | P | $10,000 |
Elite Plays – None
Secondary Plays – Dee Gordon, Giancarlo Stanton, Christian Yelich, Justin Bour, J.T. Realmuto
Stackability – YELLOW
Colorado
The Rockies have the highest implied team total on the slate. They are playing at home in the hitter’s paradise that is Coors Field and they draw an exploitable matchup against Adam Conley. On the season, he has allowed a .331 xwOBA to left-handed hitters and a .348 xwOBA to right-handed hitters. He also has a high walk rate and a high hard contact rate. The Rockies need a win to stay ahead of the Brewers and they should get it today.
Projected Lineup (Splits vs. LH Pitching)
| # | Player | Bats | wOBA | xwOBA | ISO | HC% | BB% | K% | GB% | FD Pos. | FD Sal. | DK Pos. | DK Sal. | FDRFT Pos. | FDRFT Sal. |
|---|---|---|---|---|---|---|---|---|---|---|---|---|---|---|---|
| 1 | Charlie Blackmon | LEFT | 0.384 | 0.336 | 0.211 | 34.2% | 6.8% | 16.0% | 52.4% | OF | $4,800 | OF | $5,600 | CF | $10,800 |
| 2 | DJ LeMahieu | RIGHT | 0.415 | 0.406 | 0.190 | 39.7% | 10.4% | 9.2% | 53.9% | 2B | $3,900 | 2B | $4,700 | 2B | $9,200 |
| 3 | Nolan Arenado | RIGHT | 0.531 | 0.438 | 0.423 | 35.7% | 9.6% | 10.2% | 25.4% | 3B | $4,800 | 3B | $5,500 | 3B | $10,800 |
| 4 | Trevor Story | RIGHT | 0.430 | 0.357 | 0.382 | 54.6% | 11.5% | 33.1% | 28.6% | SS | $3,800 | SS | $3,900 | SS | $7,800 |
| 5 | Ian Desmond | RIGHT | 0.264 | 0.258 | 0.083 | 25.0% | 5.4% | 23.7% | 68.8% | OF | $3,800 | 1B/OF | $4,100 | LF | $8,100 |
| 6 | Carlos Gonzalez | LEFT | 0.217 | 0.204 | 0.087 | 33.3% | 3.1% | 32.1% | 58.3% | OF | $4,100 | OF | $4,200 | RF | $8,100 |
| 7 | Mark Reynolds | RIGHT | 0.330 | 0.306 | 0.168 | 34.5% | 15.3% | 31.3% | 44.8% | 1B | $3,700 | 1B | $3,700 | 1B | $7,200 |
| 8 | Jonathan Lucroy | RIGHT | 0.256 | 0.308 | 0.079 | 20.7% | 8.9% | 8.9% | 59.8% | C | $3,800 | C | $3,200 | C | $6,300 |
| 9 | Jon Gray | RIGHT | 0.063 | 0.077 | 0.000 | 20.0% | 0.0% | 64.3% | 60.0% | P | $7,600 | P | $8,000 | P | $15,600 |
Elite Plays – Charlie Blackmon, DJ LeMahieu, Nolan Arenado, Trevor Story
Secondary Plays – Ian Desmond, Mark Reynolds, Jonathan Lucroy
Stackability – GREEN
Seattle at Oakland – 3:35 PM ET
| Seattle | Oakland | ||||||||||||||
 | Erasmo Ramirez |  | Kendall Graveman | ||||||||||||
| RIGHT | RIGHT | ||||||||||||||
| Vegas Moneyline | Vegas Over/Under | ||||||||||||||
| OAK-115 | 9.5 | ||||||||||||||
| Stats | wOBA | xwOBA | HC% | BB% | K% | GB% | Stats | wOBA | xwOBA | HC% | BB% | K% | GB% | ||
|---|---|---|---|---|---|---|---|---|---|---|---|---|---|---|---|
| SP vs. Left (2016-17) | 0.354 | 0.381 | 45.9% | 8.8% | 21.2% | 41.0% | SP vs. Left (2016-17) | 0.305 | 0.320 | 28.0% | 8.3% | 17.2% | 40.7% | ||
| SP vs. Right (2016-17) | 0.282 | 0.292 | 34.2% | 4.1% | 19.0% | 48.0% | SP vs. Right (2016-17) | 0.362 | 0.369 | 33.3% | 6.3% | 14.9% | 56.7% | ||
Pitcher Grind Down
| Erasmo Ramirez | |||||||||
 | FanDuel | DraftKings | FantasyDraft | ||||||
| Salary: | $7,400 | Salary: | $7,700 | Salary: | $15,300 | ||||
| Salary Rank: | 17 of 30 | Salary Rank: | 9 of 30 | Salary Rank: | 7 of 30 | ||||
| Stats | Starts | SIERA | ERA | K% | BB% | GB% | HC% | SC% | |
|---|---|---|---|---|---|---|---|---|---|
| 2016 | 1 | 4.10 | 3.77 | 16.7% | 6.9% | 52.5% | 26.3% | 19.3% | |
| 2017 | 17 | 4.22 | 4.56 | 19.9% | 5.9% | 45.4% | 38.6% | 14.7% | |
| L30 | 5 | 4.09 | 4.71 | 24.4% | 8.1% | 43.2% | 34.2% | 12.2% | |
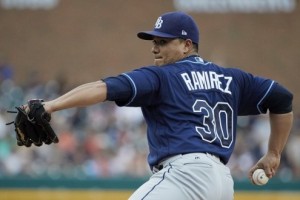
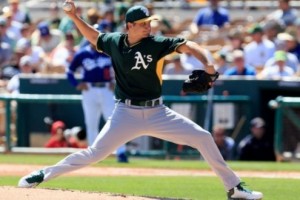
As long as the Diamondbacks don’t roll out their “B” squad again, Ramirez will be my second favorite SP2 in the early slate. While he doesn’t do anything particularly well, he has good command and an ability to pitch fairly deep into games. He is pitching in a good ballpark and he’s facing an A’s offense that has the fourth highest strikeout rate against right-handed pitching this season. The concern here is that the A’s have been red-hot and that most games in this ballpark don’t have run totals this high.
Quick Breakdown: When it comes to SP2, I prefer Jon Gray. However, Ramirez should be lower owned in tournaments.
| Kendall Graveman | |||||||||
 | FanDuel | DraftKings | FantasyDraft | ||||||
| Salary: | $7,900 | Salary: | $6,800 | Salary: | $13,500 | ||||
| Salary Rank: | 12 of 30 | Salary Rank: | 16 of 30 | Salary Rank: | 16 of 30 | ||||
| Stats | Starts | SIERA | ERA | K% | BB% | GB% | HC% | SC% | |
|---|---|---|---|---|---|---|---|---|---|
| 2016 | 31 | 4.57 | 4.11 | 13.7% | 6.0% | 52.1% | 29.1% | 17.0% | |
| 2017 | 17 | 4.75 | 4.39 | 15.9% | 7.2% | 50.0% | 31.1% | 16.6% | |
| L30 | 5 | 4.58 | 3.96 | 16.4% | 7.7% | 57.1% | 27.3% | 15.6% | |
Graveman has been an easy pitcher to avoid this season. In 17 starts, he has a 4.75 SIERA with a strikeout rate of only 16%. He’s a ground ball pitcher that is always at the mercy of BABIP thanks to a low k-rate. He draws a fairly difficult matchup against the Mariners, who are ranked above the major league average in both team wOBA and strikeout rate against right-handed pitching. Seattle has also hit him well in the past with a combined .416 wOBA in 85 plate appearances.
Quick Breakdown: Graveman is a risky play with little upside.
Batter Grind Down
Seattle
The Mariners are facing a ground ball pitcher in a pitcher-friendly ballpark. While that’s obviously not an ideal combination, Kendall Graveman has been hittable this season. He has a low strikeout rate and has allowed a .320 xwOBA to left-handed hitters and a .369 xwOBA to right-handed hitters this season. Nelson Cruz has some of the best BvP that you are going to find. He is 12-for-19 against Graveman in his career with a home run and two doubles.
Projected Lineup (Splits vs. RH Pitching)
| # | Player | Bats | wOBA | xwOBA | ISO | HC% | BB% | K% | GB% | FD Pos. | FD Sal. | DK Pos. | DK Sal. | FDRFT Pos. | FDRFT Sal. |
|---|---|---|---|---|---|---|---|---|---|---|---|---|---|---|---|
| 1 | Ben Gamel | LEFT | 0.323 | 0.300 | 0.136 | 28.5% | 7.7% | 20.5% | 43.2% | OF | $3,100 | OF | $3,700 | RF | $7,200 |
| 2 | Mitch Haniger | RIGHT | 0.361 | 0.324 | 0.201 | 37.3% | 9.0% | 24.4% | 44.0% | OF | $3,600 | OF | $4,300 | LF | $8,400 |
| 3 | Robinson Cano | LEFT | 0.381 | 0.395 | 0.216 | 39.9% | 8.5% | 10.4% | 49.0% | 2B | $3,400 | 2B | $4,300 | 2B | $8,400 |
| 4 | Nelson Cruz | RIGHT | 0.393 | 0.387 | 0.277 | 39.3% | 7.8% | 21.5% | 40.3% | OF | $4,000 | OF | $4,200 | RF | $8,000 |
| 5 | Kyle Seager | LEFT | 0.328 | 0.368 | 0.197 | 37.9% | 9.3% | 15.4% | 30.3% | 3B | $3,400 | 3B | $3,900 | 3B | $7,600 |
| 6 | Yonder Alonso | LEFT | 0.373 | 0.376 | 0.224 | 35.4% | 14.4% | 22.5% | 33.1% | 1B | $2,400 | 1B | $3,300 | 1B | $6,400 |
| 7 | Mike Zunino | RIGHT | 0.341 | 0.306 | 0.235 | 38.1% | 8.5% | 38.5% | 34.4% | C | $2,900 | C | $3,300 | C | $6,600 |
| 8 | Taylor Motter | RIGHT | 0.292 | 0.318 | 0.178 | 37.3% | 8.2% | 23.4% | 38.4% | SS | $2,100 | OF/SS | $2,600 | SS | $5,100 |
| 9 | Jacob Hannemann | LEFT | 0.219 | 0.000 | 0.0% | 0.0% | 25.0% | 66.7% | OF | $2,000 | OF | $2,000 | CF | $4,000 |
Elite Plays – Nelson Cruz
Secondary Plays – Ben Gamel, Mitch Haniger, Robinson Cano, Kyle Seager, Mike Zunino
Stackability – YELLOW
Oakland
Erasmo Ramirez is one of the easiest pitchers to break down. He has been tough on right-handed hitters this season, holding them to a .292 xwOBA with a 48% ground ball rate. His issue has clearly been against left-handed hitters, allowing a .381 xwOBA with a 46% hard contact rate. All of the left-handed hitters in this lineup are viable. Unfortunately, Matt Olson will not be in the lineup again this season. He has a Grade 2 hamstring strain that will force him to miss the last week.
Projected Lineup (Splits vs. RH Pitching)
| # | Player | Bats | wOBA | xwOBA | ISO | HC% | BB% | K% | GB% | FD Pos. | FD Sal. | DK Pos. | DK Sal. | FDRFT Pos. | FDRFT Sal. |
|---|---|---|---|---|---|---|---|---|---|---|---|---|---|---|---|
| 1 | Marcus Semien | RIGHT | 0.320 | 0.301 | 0.138 | 25.0% | 10.4% | 22.9% | 37.4% | SS | $3,900 | SS | $4,300 | SS | $8,400 |
| 2 | Matt Joyce | LEFT | 0.358 | 0.369 | 0.256 | 32.3% | 13.4% | 20.4% | 34.0% | OF | $3,100 | OF | $3,400 | RF | $6,600 |
| 3 | Jed Lowrie | SWITCH | 0.358 | 0.370 | 0.188 | 36.7% | 10.9% | 14.5% | 26.7% | 2B | $4,000 | 2B | $3,400 | 2B | $6,600 |
| 4 | Khris Davis | RIGHT | 0.371 | 0.376 | 0.295 | 39.6% | 10.0% | 31.0% | 38.8% | OF | $4,100 | OF | $4,000 | LF | $7,800 |
| 5 | Ryon Healy | RIGHT | 0.307 | 0.309 | 0.178 | 35.3% | 3.4% | 24.8% | 44.5% | 1B | $2,700 | 1B/3B | $3,400 | 3B | $6,800 |
| 6 | Matt Chapman | RIGHT | 0.323 | 0.290 | 0.251 | 37.0% | 9.6% | 29.2% | 36.2% | 3B | $2,500 | 3B | $2,700 | 3B | $5,400 |
| 7 | Bruce Maxwell | LEFT | 0.316 | 0.319 | 0.121 | 38.9% | 12.4% | 24.9% | 44.4% | C | $2,700 | C | $2,900 | C | $5,600 |
| 8 | Mark Canha | RIGHT | 0.319 | 0.316 | 0.210 | 35.3% | 5.6% | 33.7% | 31.4% | OF | $2,300 | OF | $2,800 | IF/OF | $5,400 |
| 9 | Jake Smolinski | RIGHT | 0.219 | 0.000 | 50.0% | 0.0% | 50.0% | 0.0% | OF | $2,000 | OF | $2,000 | CF | $4,000 |
Elite Plays – Jed Lowrie
Secondary Plays – Matt Joyce, Khris Davis, Bruce Maxwell
Stackability – ORANGE
San Francisco at Arizona – 3:40 PM ET
| San Francisco | Arizona | ||||||||||||||
 | Jeff Samardzija |  | Braden Shipley | ||||||||||||
| RIGHT | RIGHT | ||||||||||||||
| Vegas Moneyline | Vegas Over/Under | ||||||||||||||
| TBD | |||||||||||||||
| Stats | wOBA | xwOBA | HC% | BB% | K% | GB% | Stats | wOBA | xwOBA | HC% | BB% | K% | GB% | ||
|---|---|---|---|---|---|---|---|---|---|---|---|---|---|---|---|
| SP vs. Left (2016-17) | 0.324 | 0.321 | 31.7% | 4.5% | 26.1% | 37.2% | SP vs. Left (2016-17) | 0.244 | 0.253 | 25.0% | 4.4% | 13.3% | 50.0% | ||
| SP vs. Right (2016-17) | 0.292 | 0.261 | 27.1% | 2.6% | 22.7% | 47.5% | SP vs. Right (2016-17) | 0.526 | 0.436 | 42.4% | 20.4% | 16.7% | 42.4% | ||
Pitcher Grind Down
| Jeff Samardzija | |||||||||
 | FanDuel | DraftKings | FantasyDraft | ||||||
| Salary: | $8,300 | Salary: | $7,100 | Salary: | $14,100 | ||||
| Salary Rank: | 6 of 30 | Salary Rank: | 14 of 30 | Salary Rank: | 14 of 30 | ||||
| Stats | Starts | SIERA | ERA | K% | BB% | GB% | HC% | SC% | |
|---|---|---|---|---|---|---|---|---|---|
| 2016 | 32 | 4.13 | 3.81 | 20.1% | 6.5% | 46.5% | 31.5% | 18.1% | |
| 2017 | 30 | 3.57 | 4.42 | 24.5% | 3.6% | 42.3% | 29.4% | 21.3% | |
| L30 | 4 | 3.47 | 3.03 | 25.0% | 2.8% | 43.6% | 29.5% | 26.9% | |
Samardzija has pitched well all year, posting a 3.57 SIERA with a strikeout rate of 25% and a walk rate of 4%. Other than facing the Padres, he has quietly been a very nice option in DFS. He draws a difficult matchup today against the Diamondbacks, but they have officially locked up home-field advantage in the wildcard game. They have nothing to play for the rest of the way, so don’t be surprised if they rest a few starters here or there. Samardzija is viable in tournaments either way, but if the Diamondbacks’ lineup looks shaky, he could challenge Jon Gray as the top SP2 of the slate.
Quick Breakdown:Samardzija is viable today, but let’s wait and see what the Diamondbacks look like first.
| Braden Shipley | |||||||||
 | FanDuel | DraftKings | FantasyDraft | ||||||
| Salary: | $5,500 | Salary: | $5,500 | Salary: | $10,800 | ||||
| Salary Rank: | 27 of 30 | Salary Rank: | 25 of 30 | Salary Rank: | 25 of 30 | ||||
| Stats | Starts | SIERA | ERA | K% | BB% | GB% | HC% | SC% | |
|---|---|---|---|---|---|---|---|---|---|
| 2016 | 11 | 5.20 | 5.27 | 14.1% | 9.2% | 42.8% | 37.2% | 11.1% | |
| 2017 | 2 | 5.65 | 5.85 | 15.2% | 13.1% | 46.4% | 33.3% | 18.8% | |
| L30 | 0 | 3.54 | 3.00 | 27.3% | 9.1% | 42.9% | 14.3% | 28.6% | |
Shipley is only making his third start of the season, after spending most of his time at the Triple-A level, where he posted a 5.92 SIERA with a strikeout rate of only 15%. The Diamondbacks were scheduled to start Zack Greinke, but they will obviously need him for the wildcard game, so they are rearranging the rotation. Shipley offers no fantasy value at this time, even in a favorable matchup against the Giants.
Quick Breakdown: Avoid Shipley in all formats.
Batter Grind Down
San Francisco
The Giants are the preferred offense to target in this game, which sounds a bit strange. They clearly draw the better matchup of the two teams and this ballpark is a big step up from AT&T Park in terms of run production. The sample size is small, but Braden Shipley has allowed a .344 wOBA to left-handed hitters and a .425 wOBA to right-handed hitters in his career. The Giants are a great source of value for the early slate.
Projected Lineup (Splits vs. RH Pitching)
| # | Player | Bats | wOBA | xwOBA | ISO | HC% | BB% | K% | GB% | FD Pos. | FD Sal. | DK Pos. | DK Sal. | FDRFT Pos. | FDRFT Sal. |
|---|---|---|---|---|---|---|---|---|---|---|---|---|---|---|---|
| 1 | Hunter Pence | RIGHT | 0.288 | 0.279 | 0.113 | 27.6% | 6.1% | 22.2% | 62.3% | OF | $3,600 | OF | $3,800 | RF | $7,500 |
| 2 | Joe Panik | LEFT | 0.340 | 0.319 | 0.172 | 26.1% | 8.2% | 8.8% | 40.5% | 2B | $2,900 | 2B | $3,400 | 2B | $6,600 |
| 3 | Denard Span | LEFT | 0.334 | 0.329 | 0.183 | 27.5% | 7.2% | 11.9% | 42.0% | OF | $2,900 | OF | $3,700 | CF | $7,200 |
| 4 | Buster Posey | RIGHT | 0.338 | 0.349 | 0.109 | 30.2% | 9.3% | 11.9% | 46.3% | C | $2,900 | 1B/C | $3,800 | C | $7,500 |
| 5 | Brandon Crawford | LEFT | 0.303 | 0.315 | 0.160 | 33.3% | 7.4% | 21.4% | 49.1% | SS | $2,600 | SS | $3,500 | SS | $6,900 |
| 6 | Pablo Sandoval | SWITCH | 0.280 | 0.323 | 0.137 | 35.4% | 6.5% | 20.6% | 47.2% | 3B | $2,600 | 3B | $3,300 | 3B | $6,600 |
| 7 | Jarrett Parker | LEFT | 0.292 | 0.291 | 0.180 | 24.1% | 6.2% | 26.9% | 50.6% | OF | $3,000 | OF | $2,600 | LF | $5,100 |
| 8 | Nick Hundley | RIGHT | 0.242 | 0.281 | 0.128 | 33.1% | 2.7% | 29.4% | 42.1% | C | $2,500 | C | $3,000 | C | $6,000 |
| 9 | Jeff Samardzija | RIGHT | 0.121 | 0.153 | 0.098 | 17.9% | 0.0% | 34.9% | 57.7% | P | $8,300 | P | $7,100 | P | $14,100 |
Elite Plays – Joe Panik, Denard Span, Buster Posey
Secondary Plays – Hunter Pence, Brandon Crawford
Stackability – YELLOW
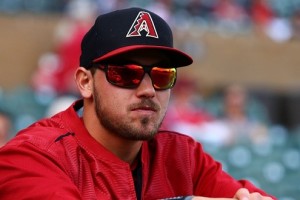
Arizona
The Diamondbacks have nothing to play for the rest of the way, which makes predicting fantasy production difficult. While this offense still has upside, my plan is to lean on the teams and players that are still motivated. When you add in a matchup against Jeff Samardzija, it makes the Arizona fade a little easier. On the season, Samardzija has held both left and right-handed hitters under a .325 xwOBA and under a 32% hard contact rate.
Projected Lineup (Splits vs. RH Pitching)
| # | Player | Bats | wOBA | xwOBA | ISO | HC% | BB% | K% | GB% | FD Pos. | FD Sal. | DK Pos. | DK Sal. | FDRFT Pos. | FDRFT Sal. |
|---|---|---|---|---|---|---|---|---|---|---|---|---|---|---|---|
| 1 | David Peralta | LEFT | 0.358 | 0.316 | 0.168 | 35.1% | 7.3% | 16.3% | 53.4% | OF | $3,800 | OF | $4,500 | RF | $8,800 |
| 2 | A.J. Pollock | RIGHT | 0.336 | 0.329 | 0.184 | 37.1% | 8.5% | 18.0% | 43.7% | OF | $3,800 | OF | $4,400 | CF | $8,700 |
| 3 | Paul Goldschmidt | RIGHT | 0.412 | 0.393 | 0.274 | 43.1% | 13.6% | 23.0% | 46.8% | 1B | $4,400 | 1B | $5,600 | 1B | $10,800 |
| 4 | J.D. Martinez | RIGHT | 0.392 | 0.399 | 0.344 | 46.2% | 10.5% | 26.6% | 41.3% | OF | $4,900 | OF | $5,600 | RF | $10,800 |
| 5 | Chris Iannetta | RIGHT | 0.342 | 0.322 | 0.251 | 40.0% | 10.2% | 31.6% | 32.2% | C | $2,700 | C | $4,000 | C | $7,800 |
| 6 | Brandon Drury | RIGHT | 0.329 | 0.308 | 0.193 | 32.2% | 6.8% | 20.1% | 48.9% | 2B | $3,100 | 2B | $3,300 | IF/OF | $6,600 |
| 7 | Jake Lamb | LEFT | 0.380 | 0.372 | 0.262 | 36.8% | 13.7% | 21.1% | 37.8% | 3B | $3,300 | 3B | $4,100 | 3B | $8,000 |
| 8 | Ketel Marte | SWITCH | 0.330 | 0.326 | 0.136 | 21.6% | 9.5% | 16.5% | 39.5% | SS | $2,600 | SS | $3,800 | SS | $7,500 |
| 9 | Braden Shipley | RIGHT | 0.000 | 0.000 | 75.0% | 0.0% | 20.0% | 75.0% | P | $5,500 | P | $5,500 | P | $10,800 |
Elite Plays – None
Secondary Plays – David Peralta, Jake Lamb
Stackability – ORANGE
Baltimore at Pittsburgh – 7:05 PM ET
| Baltimore | Pittsburgh | ||||||||||||||
 | Gabriel Ynoa |  | Chad Kuhl | ||||||||||||
| RIGHT | RIGHT | ||||||||||||||
| Vegas Moneyline | Vegas Over/Under | ||||||||||||||
| PIT-125 | 9.0 | ||||||||||||||
| Stats | wOBA | xwOBA | HC% | BB% | K% | GB% | Stats | wOBA | xwOBA | HC% | BB% | K% | GB% | ||
|---|---|---|---|---|---|---|---|---|---|---|---|---|---|---|---|
| SP vs. Left (2016-17) | 0.334 | 0.331 | 41.1% | 4.4% | 13.0% | 38.9% | SP vs. Left (2016-17) | 0.366 | 0.338 | 39.1% | 12.6% | 22.7% | 36.1% | ||
| SP vs. Right (2016-17) | 0.304 | 0.350 | 34.8% | 6.3% | 21.9% | 34.8% | SP vs. Right (2016-17) | 0.306 | 0.322 | 32.1% | 9.1% | 19.0% | 46.5% | ||
Pitcher Grind Down
| Gabriel Ynoa | |||||||||
 | FanDuel | DraftKings | FantasyDraft | ||||||
| Salary: | $6,100 | Salary: | $5,800 | Salary: | $11,400 | ||||
| Salary Rank: | 23 of 30 | Salary Rank: | 22 of 30 | Salary Rank: | 22 of 30 | ||||
| Stats | Starts | SIERA | ERA | K% | BB% | GB% | HC% | SC% | |
|---|---|---|---|---|---|---|---|---|---|
| 2016 | 3 | 4.08 | 6.38 | 19.3% | 8.0% | 49.2% | 28.6% | 14.3% | |
| 2017 | 3 | 4.62 | 3.41 | 17.3% | 5.3% | 37.0% | 38.2% | 20.6% | |
| L30 | 3 | 5.18 | 2.84 | 14.3% | 6.5% | 39.7% | 36.7% | 25.0% | |
Ynoa has a low ERA this season, but his peripheral stats and his major league track record both suggest that he’s not a great pitcher. He has a below-average strikeout rate and he’s listed as a small underdog on the road against the Pirates. The fact that a game in PNC Park has a total of 9.0 runs is alarming for both of the starters.
Quick Breakdown: Ynoa is an easy fade in all formats.
| Chad Kuhl | |||||||||
 | FanDuel | DraftKings | FantasyDraft | ||||||
| Salary: | $7,800 | Salary: | $6,500 | Salary: | $12,900 | ||||
| Salary Rank: | 13 of 30 | Salary Rank: | 18 of 30 | Salary Rank: | 18 of 30 | ||||
| Stats | Starts | SIERA | ERA | K% | BB% | GB% | HC% | SC% | |
|---|---|---|---|---|---|---|---|---|---|
| 2016 | 14 | 4.50 | 4.20 | 17.6% | 6.6% | 44.3% | 33.0% | 19.6% | |
| 2017 | 30 | 4.83 | 4.31 | 20.9% | 10.8% | 41.6% | 35.4% | 17.3% | |
| L30 | 5 | 5.17 | 3.33 | 24.2% | 15.0% | 27.8% | 46.6% | 17.8% | |
Kuhl used to be dominant against right-handed hitters, which gave us opportunities to target him against right-handed heavy lineups. However, this season, he has allowed a .322+ xwOBA to both lefties and righties, which gives me some pause in a start tonight against the Orioles. Baltimore loses the DH in this series, but they still have plenty of firepower in their lineup.
Quick Breakdown: Kuhl is the preferred pitcher in this game, but both can be avoided.
Batter Grind Down
Baltimore
The Orioles draw a decent matchup against Chad Kuhl, but they are facing him in a pitcher-friendly ballpark and they lose the use of their designated hitter. This isn’t a great spot for the Orioles, but they will be low-owned if you are looking for a one-off target or two. On the season, Kuhl has allowed a .338 xwOBA to left-handed hitters and a .322 xwOBA to right-handed hitters.
Projected Lineup (Splits vs. RH Pitching)
| # | Player | Bats | wOBA | xwOBA | ISO | HC% | BB% | K% | GB% | FD Pos. | FD Sal. | DK Pos. | DK Sal. | FDRFT Pos. | FDRFT Sal. |
|---|---|---|---|---|---|---|---|---|---|---|---|---|---|---|---|
| 1 | Austin Hays | RIGHT | 0.263 | 0.222 | 0.043 | 18.8% | 4.2% | 29.2% | 75.0% | OF | $2,700 | OF | $2,600 | CF | $5,200 |
| 2 | Manny Machado | RIGHT | 0.331 | 0.362 | 0.214 | 37.4% | 8.0% | 16.5% | 43.1% | 3B | $3,600 | 3B | $4,500 | 3B | $8,800 |
| 3 | Jonathan Schoop | RIGHT | 0.343 | 0.304 | 0.191 | 33.4% | 4.2% | 20.3% | 41.9% | 2B | $3,000 | 2B | $3,900 | 2B | $7,800 |
| 4 | Chris Davis | LEFT | 0.324 | 0.337 | 0.246 | 44.6% | 12.2% | 35.6% | 36.2% | 1B | $3,300 | 1B | $3,200 | IF/OF | $6,300 |
| 5 | Trey Mancini | RIGHT | 0.368 | 0.349 | 0.236 | 34.7% | 6.4% | 22.6% | 52.2% | OF | $3,300 | 1B/OF | $3,800 | IF/OF | $7,500 |
| 6 | Mark Trumbo | RIGHT | 0.285 | 0.296 | 0.160 | 30.3% | 7.5% | 25.1% | 42.4% | OF | $2,500 | OF | $3,500 | IF/OF | $6,800 |
| 7 | Chance Sisco | LEFT | 0.956 | 1.000 | 100.0% | 20.0% | 20.0% | 33.3% | C | $2,300 | C | $2,600 | C | $5,100 | |
| 8 | J.J. Hardy | RIGHT | 0.245 | 0.276 | 0.094 | 23.3% | 3.6% | 16.7% | 42.0% | SS | $2,500 | SS | $2,700 | SS | $5,200 |
| 9 | Gabriel Ynoa | RIGHT | P | $6,100 | P | $5,800 | P | $11,400 |
Elite Plays – None
Secondary Plays – Austin Hays, Manny Machado, Chris Davis, Trey Mancini
Stackability – ORANGE / YELLOW
Pittsburgh
How about Andrew McCutchen last night? He went 4-for-4 with eight runs batted in. The Pirates draw an even better matchup tonight, as they square off against Gabriel Ynoa. In addition to his low strikeout rate, Ynoa has allowed a .331 xwOBA to left-handed hitters and a .350 xwOBA to right-handed hitters this season.
Projected Lineup (Splits vs. RH Pitching)
| # | Player | Bats | wOBA | xwOBA | ISO | HC% | BB% | K% | GB% | FD Pos. | FD Sal. | DK Pos. | DK Sal. | FDRFT Pos. | FDRFT Sal. |
|---|---|---|---|---|---|---|---|---|---|---|---|---|---|---|---|
| 1 | Adam Frazier | LEFT | 0.332 | 0.333 | 0.144 | 29.7% | 8.7% | 11.5% | 46.5% | OF | $3,400 | 2B/OF | $3,600 | IF/OF | $7,200 |
| 2 | Starling Marte | RIGHT | 0.336 | 0.323 | 0.121 | 25.3% | 5.3% | 18.1% | 48.1% | OF | $3,900 | OF | $4,400 | CF | $8,400 |
| 3 | Andrew McCutchen | RIGHT | 0.325 | 0.332 | 0.156 | 32.7% | 9.9% | 18.7% | 44.0% | OF | $3,200 | OF | $3,700 | RF | $7,200 |
| 4 | Josh Bell | SWITCH | 0.344 | 0.328 | 0.214 | 32.1% | 11.3% | 19.0% | 51.4% | 1B | $2,400 | 1B | $3,700 | IF/OF | $7,200 |
| 5 | David Freese | RIGHT | 0.316 | 0.331 | 0.106 | 31.3% | 10.7% | 24.7% | 56.2% | 3B | $3,000 | 3B | $2,800 | 3B | $5,400 |
| 6 | Gregory Polanco | LEFT | 0.307 | 0.314 | 0.160 | 27.5% | 6.8% | 12.3% | 39.5% | OF | $2,300 | OF | $2,800 | RF | $5,600 |
| 7 | Elias Diaz | RIGHT | 0.262 | 0.268 | 0.098 | 25.3% | 6.1% | 18.3% | 54.5% | C | $2,600 | C | $2,900 | C | $5,600 |
| 8 | Max Moroff | SWITCH | 0.261 | 0.283 | 0.132 | 33.3% | 7.1% | 31.0% | 38.0% | SS | $2,000 | 2B/SS | $2,500 | SS | $4,800 |
| 9 | Chad Kuhl | RIGHT | 0.112 | 0.154 | 0.057 | 26.9% | 2.6% | 28.9% | 68.2% | P | $7,800 | P | $6,500 | P | $12,900 |