MLB Grind Down: Sunday, August 5th

Jump to Page 1 2 3
Editor’s Note: Page 3 will be posted shortly!
The RotoGrinders MLB Grind Down will give you an in-depth analysis into the upcoming MLB schedule. This article will break down the numbers for every single game and give you analysis on which trends you can exploit. While matchups are a major factor in daily fantasy baseball, there are plenty of other factors to consider such as injuries, weather, and salaries.
The analysis should point you in the right direction, but it is still up to you to decipher the information and make your own selections. No sport has more variance than baseball. The best choice is not always the right choice but following the trends will win you money over time.
Note: As always, if you want to try a new DFS site, be sure to click through a RotoGrinders link and use our DraftKings promo code, FanDuel promo code, and FantasyDraft promo code to receive the best perks in the industry.

Stackability Rating System:
GREEN – A viable full stack in cash games and GPPs.
YELLOW – A viable mini-stack in cash games and full stack in GPPs.
ORANGE – A viable stack in large field GPPs.
RED – Not a recommended stack for cash games or GPPs.
Implied Run Totals
Ballpark Ratings
Atlanta at NY Mets – 1:10 PM ET
| Atlanta | NY Mets | ||||||||||||||
 | Julio Teheran |  | Corey Oswalt | ||||||||||||
| RIGHT | RIGHT | ||||||||||||||
| Vegas Moneyline | Vegas Over/Under | ||||||||||||||
| ATL-115 | 8.5 | ||||||||||||||
| Stats | wOBA | xwOBA | HC% | HR/9 | K% | GB% | Stats | wOBA | xwOBA | HC% | HR/9 | K% | GB% | ||
|---|---|---|---|---|---|---|---|---|---|---|---|---|---|---|---|
| SP vs. Left (2016-17) | 0.344 | 0.376 | 42.4% | 1.38 | 17.7% | 39.5% | SP vs. Left (2016-17) | 0.264 | 0.348 | 21.2% | 1.46 | 15.2% | 38.7% | ||
| SP vs. Right (2016-17) | 0.294 | 0.323 | 37.4% | 1.87 | 25.5% | 39.4% | SP vs. Right (2016-17) | 0.285 | 0.354 | 39.1% | 1.80 | 19.4% | 50.0% | ||
Pitcher Grind Down
| Julio Teheran | |||||||||||
 | FanDuel | DraftKings | FantasyDraft | ||||||||
| Salary: | $7,600 | Salary: | $7,800 | Salary: | $15,300 | ||||||
| Salary Rank: | 11 of 29 | Salary Rank: | 11 of 29 | Salary Rank: | 7 of 29 | ||||||
| Stats | Starts | SIERA | ERA | K% | BB% | GB% | HC% | SC% | aFV | SwS% | |
|---|---|---|---|---|---|---|---|---|---|---|---|
| 2017 | 32 | 4.89 | 4.49 | 18.6% | 8.9% | 40.0% | 30.4% | 21.1% | 91.4 | 9.4% | |
| 2018 | 21 | 4.75 | 4.46 | 21.7% | 11.8% | 39.4% | 39.8% | 18.9% | 89.9 | 10.8% | |
| L14 | 2 | 5.74 | 9.64 | 15.2% | 13.0% | 40.6% | 43.8% | 21.9% | 90.7 | 7.7% | |
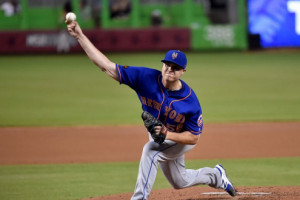
Kevin Gausman proved to be quite mediocre on Saturday in this matchup, but I think we can go right back to the well with Julio Teheran here. Of course, it’s worth noting that Teheran isn’t in the midst of his best season. The right-hander has a strikeout rate of 21.7% along with a high walk rate of 11.8%. He has also allowed hard hits at a 39.7% clip, which is dangerous. All things told, he hasn’t been anything special. Still, he’s a pitcher with a solid track record taking on a middling Mets lineup in what may be the best pitcher’s park in all of baseball. There is admittedly plenty of risk when it comes to Teheran, but he’s in a pretty solid spot today. I think he’s in the SP2 conversation as a result.
Quick Breakdown: Teheran is a viable SP2 option today in New York.
| Corey Oswalt | |||||||||||
 | FanDuel | DraftKings | FantasyDraft | ||||||||
| Salary: | $6,000 | Salary: | $5,500 | Salary: | $11,300 | ||||||
| Salary Rank: | 26 of 29 | Salary Rank: | 22 of 29 | Salary Rank: | 16 of 29 | ||||||
| Stats | Starts | SIERA | ERA | K% | BB% | GB% | HC% | SC% | aFV | SwS% | |
|---|---|---|---|---|---|---|---|---|---|---|---|
| 2018 | 5 | 4.50 | 5.27 | 17.6% | 7.4% | 45.5% | 31.7% | 19.0% | 90.3 | 7.3% | |
| L14 | 1 | 4.79 | 3.60 | 21.1% | 10.5% | 27.3% | 33.3% | 0.0% | 90.7 | 8.1% | |
Corey “Not Roy” Oswalt has only pitched in 6 games for the Mets this season, including 5 starts. The young right-hander has an uninspiring strikeout rate of 17.6%, but his 4.30 SIERA is quite a bit more palatable than his 5.27 ERA. His hard contact rate allowed isn’t egregious by any means and he keeps the ball on the ground more often than not. The Braves offense opposing him today isn’t bad by any means, but Citi Field strongly favors pitchers and Oswalt hasn’t been bad. If you want to go super cheap with your SP2 and load up on some pricey bats I think Oswalt is a solid-if-unspectacular option.
Quick Breakdown: Oswalt is a viable punt SP2 for tournaments but he’s unnecessary for cash games.
Batter Grind Down
Atlanta
Corey Oswalt has looked serviceable for the Mets this season. That plus the pitcher-friendly nature of Citi Field means I don’t find myself having a ton of interest in the Braves bats here today. Freddie Freeman and Ozzie Albies rake right-handed pitching, but they’re both expensive enough to where I think they’re tournament-only here. Ronald Acuna, Nick Markakis and Ender Inciarte are fine plays if you want to stack ATL bats in GPPs. Whichever catcher (Kurt Suzuki or Tyler Flowers) starts is fine if you need to save some salary.
Projected Lineup (Splits vs. RH Pitching)
| # | Player | Bats | xwOBA | ISO | HC% | BB% | K% | GB% | FD Pos. | FD Sal. | DK Pos. | DK Sal. | FDRFT Pos. | FDRFT Sal. |
|---|---|---|---|---|---|---|---|---|---|---|---|---|---|---|
| 1 | Ronald Acuna | RIGHT | 0.373 | 0.248 | 45.1% | 6.8% | 29.6% | 40.2% | OF | $4,000 | OF | $4,700 | LF | $9,300 |
| 2 | Ozzie Albies | SWITCH | 0.318 | 0.226 | 35.9% | 4.3% | 17.5% | 36.0% | 2B | $4,100 | 2B | $5,000 | 2B | $9,500 |
| 3 | Freddie Freeman | LEFT | 0.408 | 0.185 | 45.0% | 13.4% | 16.9% | 37.6% | 1B | $4,200 | 1B | $5,000 | 1B | $9,700 |
| 4 | Nick Markakis | LEFT | 0.398 | 0.167 | 42.3% | 10.4% | 8.8% | 42.3% | OF | $3,400 | OF | $4,400 | RF | $8,400 |
| 5 | Kurt Suzuki | RIGHT | 0.322 | 0.146 | 35.1% | 5.7% | 8.6% | 32.7% | C | $2,700 | C | $3,500 | C | $6,900 |
| 6 | Johan Camargo | SWITCH | 0.318 | 0.160 | 38.5% | 13.2% | 20.5% | 51.0% | 3B | $3,200 | 3B/SS | $4,100 | 3B | $8,300 |
| 7 | Ender Inciarte | LEFT | 0.291 | 0.121 | 27.1% | 7.7% | 12.6% | 45.6% | OF | $2,700 | OF | $4,000 | CF | $7,300 |
| 8 | Dansby Swanson | RIGHT | 0.280 | 0.142 | 33.2% | 6.7% | 22.6% | 44.4% | SS | $2,600 | SS | $3,500 | SS | $6,300 |
| 9 | Julio Teheran | RIGHT | 0.212 | 0.000 | 21.4% | 0.0% | 12.5% | 63.6% | P | $7,600 | P | $7,800 | P | $15,300 |
| Team Averages | 0.324 | 0.155 | 36.0% | 7.6% | 16.6% | 43.7% |
Elite Plays – Freddie Freeman (GPP)
Secondary Plays – Freddie Freeman (cash), Ozzie Albies, Nick Markakis, Ender Inciarte, Ronald Acuna, Kurt Suzuki / Tyler Flowers
Stackability – ORANGE
NY Mets
Julio Teheran has stifled right-handed bats in his career while struggling quite a bit with lefties. There isn’t a whole lot to like in this Mets lineup these days, but Michael Conforto and Brandon Nimmo are some quality LHBs that should be able to capitalize on Teheran’s weakness. Jeff McNeil is also a solid option from the left side, especially because he’s still cheap. Given the spacious park and the general terribleness of this Mets lineup, though, I’d stay away from any of the NYM bats in cash games.
Projected Lineup (Splits vs. RH Pitching)
| # | Player | Bats | xwOBA | ISO | HC% | BB% | K% | GB% | FD Pos. | FD Sal. | DK Pos. | DK Sal. | FDRFT Pos. | FDRFT Sal. |
|---|---|---|---|---|---|---|---|---|---|---|---|---|---|---|
| 1 | Brandon Nimmo | LEFT | 0.365 | 0.244 | 35.9% | 13.3% | 27.3% | 34.7% | OF | $3,100 | OF | $4,500 | LF | $9,100 |
| 2 | Jose Bautista | RIGHT | 0.349 | 0.155 | 41.9% | 14.8% | 29.6% | 35.5% | OF | $2,300 | 3B/OF | $3,600 | IF/OF | $7,600 |
| 3 | Michael Conforto | LEFT | 0.349 | 0.164 | 36.8% | 16.8% | 22.0% | 36.8% | OF | $3,100 | OF | $4,100 | LF | $8,200 |
| 4 | Wilmer Flores | RIGHT | 0.318 | 0.234 | 37.4% | 7.5% | 9.1% | 35.5% | 1B | $2,900 | 1B/3B | $3,700 | 3B | $7,400 |
| 5 | Todd Frazier | RIGHT | 0.355 | 0.178 | 45.5% | 10.0% | 22.0% | 35.8% | 3B | $2,400 | 3B | $3,700 | 3B | $7,500 |
| 6 | Jeff McNeil | LEFT | 0.317 | 0.158 | 20.0% | 12.0% | 20.0% | 38.5% | 2B | $2,400 | 2B/3B | $3,300 | 2B | $6,800 |
| 7 | Amed Rosario | RIGHT | 0.276 | 0.117 | 26.5% | 5.2% | 19.1% | 50.8% | SS | $2,300 | SS | $3,100 | SS | $5,700 |
| 8 | Devin Mesoraco | RIGHT | 0.315 | 0.174 | 32.0% | 6.0% | 18.5% | 32.0% | C | $2,300 | C | $3,200 | C | $6,600 |
| 9 | Corey Oswalt | RIGHT | 0.028 | 0.000 | 0.0% | 0.0% | 75.0% | 100.0% | P | $6,000 | P | $5,500 | P | $11,300 |
| Team Averages | 0.297 | 0.158 | 30.7% | 9.5% | 27.0% | 44.4% |
Elite Plays – None
Secondary Plays – Jeff McNeil, Brandon Nimmo, Michael Conforto
Stackability – RED
Chicago White Sox at Tampa Bay – 1:10 PM ET
| Chicago White Sox | Tampa Bay | ||||||||||||||
 | James Shields |  | Hunter Wood | ||||||||||||
| RIGHT | RIGHT | ||||||||||||||
| Vegas Moneyline | Vegas Over/Under | ||||||||||||||
| TBD | |||||||||||||||
| Stats | wOBA | xwOBA | HC% | HR/9 | K% | GB% | Stats | wOBA | xwOBA | HC% | HR/9 | K% | GB% | ||
|---|---|---|---|---|---|---|---|---|---|---|---|---|---|---|---|
| SP vs. Left (2016-17) | 0.299 | 0.359 | 30.2% | 1.25 | 19.2% | 38.6% | SP vs. Left (2016-17) | 0.302 | 0.243 | 28.6% | 1.00 | 32.5% | 50.0% | ||
| SP vs. Right (2016-17) | 0.328 | 0.349 | 36.1% | 1.25 | 17.3% | 33.5% | SP vs. Right (2016-17) | 0.314 | 0.285 | 32.4% | 1.54 | 26.0% | 44.1% | ||
Pitcher Grind Down
| James Shields | |||||||||||
 | FanDuel | DraftKings | FantasyDraft | ||||||||
| Salary: | $7,300 | Salary: | $6,800 | Salary: | $14,000 | ||||||
| Salary Rank: | 15 of 29 | Salary Rank: | 15 of 29 | Salary Rank: | 11 of 29 | ||||||
| Stats | Starts | SIERA | ERA | K% | BB% | GB% | HC% | SC% | aFV | SwS% | |
|---|---|---|---|---|---|---|---|---|---|---|---|
| 2017 | 21 | 4.94 | 5.23 | 20.0% | 10.3% | 38.2% | 33.3% | 19.3% | 90.0 | 10.2% | |
| 2018 | 23 | 4.87 | 4.56 | 18.2% | 9.1% | 35.9% | 33.3% | 15.2% | 89.4 | 10.4% | |
| L14 | 2 | 3.88 | 8.18 | 29.4% | 11.8% | 34.5% | 37.9% | 10.3% | 90.3 | 16.7% | |
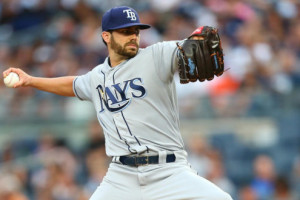
James Shields and his 18.2% strikeout rate will be taking the mound for the White Sox today against the Rays. Shields has had some decent starts this season, but he doesn’t miss many bats and his 4.87 SIERA isn’t quite as friendly as his 4.56 ERA. The right-hander has also allowed 20 homers across his 24 outings. While all-out stacks against Shields haven’t been all that fruitful this season, he still isn’t a guy you want to be rostering on a full slate. The upside is limited here.
Quick Breakdown: James Shields is an easy fade.
| Hunter Wood | |||||||||||
 | FanDuel | DraftKings | FantasyDraft | ||||||||
| Salary: | $5,500 | Salary: | $4,300 | Salary: | $8,300 | ||||||
| Salary Rank: | 28 of 29 | Salary Rank: | 26 of 29 | Salary Rank: | 18 of 29 | ||||||
| Stats | Starts | SIERA | ERA | K% | BB% | GB% | HC% | SC% | aFV | SwS% | |
|---|---|---|---|---|---|---|---|---|---|---|---|
| 2017 | 0 | 13.42 | 0.00 | 0.0% | 0.0% | 0.0% | 0.0% | 100.0% | 90.0 | 0.0% | |
| 2018 | 4 | 3.37 | 3.05 | 28.9% | 10.0% | 46.3% | 30.9% | 21.8% | 94.1 | 14.9% | |
| L14 | 3 | 2.23 | 3.86 | 41.9% | 9.3% | 42.9% | 19.1% | 14.3% | 94.5 | 16.9% | |
Hunter Wood is another of the Rays’ openers that will likely throw no more than a couple of innings today. Wood is a decent strikeout pitcher in a good strikeout matchup against the White Sox, but rostering a guy that probably won’t even crack 50 pitches isn’t something you want to be doing on this slate.
Quick Breakdown: Fade Wood and his pitch cap today.
Batter Grind Down
Chicago White Sox
The White Sox’ hitters are getting a major park downgrade going from Guaranteed Rate Field into the Trop. The Rays will also be going with their patented bullpen game in this one, which makes figuring out which players to use from the opposing offense rather tricky. Kevin Cash has been generally secretive about which pitchers will come in and throw long relief in lieu of his openers. We know the White Sox aren’t a great offense in the first place, so they can be pretty easily ignored outside of a deep GPP flier stack. Yoan Moncada, Jose Abreu and Avisail Garcia would be the best targets in that scenario, but I have very little interest in the Sox today.
Projected Lineup (Splits vs. RH Pitching)
| # | Player | Bats | xwOBA | ISO | HC% | BB% | K% | GB% | FD Pos. | FD Sal. | DK Pos. | DK Sal. | FDRFT Pos. | FDRFT Sal. |
|---|---|---|---|---|---|---|---|---|---|---|---|---|---|---|
| 1 | Yoan Moncada | SWITCH | 0.347 | 0.207 | 39.0% | 10.4% | 33.8% | 31.7% | 2B | $3,700 | 2B | $4,100 | 2B | $8,100 |
| 2 | Yolmer Sanchez | SWITCH | 0.310 | 0.169 | 27.8% | 6.4% | 18.7% | 46.2% | 3B | $2,800 | 3B | $3,400 | 2B | $6,500 |
| 3 | Jose Abreu | RIGHT | 0.381 | 0.210 | 35.6% | 6.6% | 17.9% | 43.8% | 1B | $3,900 | 1B | $4,500 | 1B | $9,400 |
| 4 | Daniel Palka | LEFT | 0.329 | 0.280 | 37.7% | 5.5% | 35.2% | 39.2% | OF | $2,900 | OF | $4,600 | IF/OF | $9,200 |
| 5 | Avisail Garcia | RIGHT | 0.366 | 0.241 | 42.0% | 2.0% | 23.5% | 47.3% | OF | $2,900 | OF | $3,800 | RF | $7,200 |
| 6 | Omar Narvaez | LEFT | 0.346 | 0.156 | 26.9% | 9.2% | 17.8% | 38.1% | C | $2,200 | C | $3,300 | C | $6,600 |
| 7 | Leury Garcia | SWITCH | 0.288 | 0.115 | 25.9% | 4.2% | 25.1% | 51.3% | OF | $2,500 | OF | $3,700 | IF/OF | $7,500 |
| 8 | Nick Delmonico | LEFT | 0.341 | 0.146 | 28.0% | 10.0% | 16.4% | 43.0% | OF | $2,300 | OF | $3,800 | IF/OF | $7,400 |
| 9 | Tim Anderson | RIGHT | 0.271 | 0.147 | 26.6% | 6.0% | 25.5% | 49.0% | SS | $2,600 | SS | $3,600 | SS | $7,500 |
| Team Averages | 0.331 | 0.186 | 32.2% | 6.7% | 23.8% | 43.3% |
Elite Plays – None
Secondary Plays – Jose Abreu, Avisail Garcia, Yoan Moncada
Stackability – ORANGE
Tampa Bay
James Shields has been annoying to stack against this season, but his numbers still aren’t very good. He has still conceded 20 dongs already and his xFIP against hitters of either handedness is over 5.00. Lefties are the more traditional way to attack Shields, which puts Kevin Kiermaier, Jake Bauers, Joey Wendle and Ji-Man Choi in play. C.J. Cron is the best power hitter from the right side, while Matt Duffy is a fine enough option given the matchup. I wouldn’t go crazy with Rays bats in cash games, but Tampa does make for a viable stack in GPPs.
Projected Lineup (Splits vs. RH Pitching)
| # | Player | Bats | xwOBA | ISO | HC% | BB% | K% | GB% | FD Pos. | FD Sal. | DK Pos. | DK Sal. | FDRFT Pos. | FDRFT Sal. |
|---|---|---|---|---|---|---|---|---|---|---|---|---|---|---|
| 1 | Kevin Kiermaier | LEFT | 0.274 | 0.113 | 33.3% | 8.7% | 25.5% | 51.1% | OF | $3,000 | OF | $4,100 | CF | $8,000 |
| 2 | Matt Duffy | RIGHT | 0.311 | 0.087 | 28.5% | 5.6% | 15.1% | 52.5% | 3B | $2,800 | 3B | $3,600 | 3B | $7,300 |
| 3 | Jake Bauers | LEFT | 0.376 | 0.261 | 45.5% | 14.0% | 24.4% | 40.4% | 1B | $3,700 | 1B/OF | $4,300 | 1B | $8,300 |
| 4 | C.J. Cron | RIGHT | 0.355 | 0.237 | 38.7% | 5.6% | 24.6% | 42.7% | 1B | $3,100 | 1B | $4,200 | 1B | $8,400 |
| 5 | Michael Perez | LEFT | 0.383 | 0.063 | 41.7% | 0.0% | 25.0% | 33.3% | C | $2,300 | C | $3,000 | C | $5,700 |
| 6 | Joey Wendle | LEFT | 0.320 | 0.117 | 36.9% | 6.0% | 19.9% | 47.0% | 2B | $2,800 | 2B/OF | $3,800 | 2B | $7,700 |
| 7 | 0.000 | 0.0% | 0.0% | 0.0% | 100.0% | P | $5,600 | P | $6,600 | P | $8,000 | |||
| 8 | Willy Adames | RIGHT | 0.262 | 0.112 | 25.8% | 7.2% | 28.9% | 42.6% | SS | $2,400 | 2B/SS | $3,400 | SS | $6,300 |
| 9 | Mallex Smith | LEFT | 0.289 | 0.129 | 30.0% | 8.9% | 18.6% | 45.2% | OF | $2,900 | OF | $4,300 | CF | $8,600 |
| Team Averages | 0.321 | 0.124 | 31.2% | 6.2% | 20.2% | 50.5% |
Elite Plays – Kevin Kiermaier, Jake Bauers, C.J. Cron
Secondary Plays – Joey Wendle, Matt Duffy, Ji-Man Choi
Stackability – YELLOW
LA Angels at Cleveland – 1:10 PM ET
| LA Angels | Cleveland | ||||||||||||||
 | Deck McGuire |  | Shane Bieber | ||||||||||||
| RIGHT | RIGHT | ||||||||||||||
| Vegas Moneyline | Vegas Over/Under | ||||||||||||||
| CLE-167 | 9.0 | ||||||||||||||
| Stats | wOBA | xwOBA | HC% | HR/9 | K% | GB% | Stats | wOBA | xwOBA | HC% | HR/9 | K% | GB% | ||
|---|---|---|---|---|---|---|---|---|---|---|---|---|---|---|---|
| SP vs. Left (2016-17) | 0.299 | 0.334 | 30.8% | 1.42 | 13.2% | 46.2% | SP vs. Left (2016-17) | 0.410 | 0.368 | 48.2% | 1.40 | 22.9% | 37.0% | ||
| SP vs. Right (2016-17) | 0.480 | 0.460 | 57.9% | 4.38 | 22.6% | 18.4% | SP vs. Right (2016-17) | 0.278 | 0.277 | 41.0% | 0.70 | 23.1% | 53.8% | ||
Pitcher Grind Down
| Deck McGuire | |||||||||||
 | FanDuel | DraftKings | FantasyDraft | ||||||||
| Salary: | $5,500 | Salary: | $4,400 | Salary: | $8,200 | ||||||
| Salary Rank: | 28 of 29 | Salary Rank: | 25 of 29 | Salary Rank: | 19 of 29 | ||||||
| Stats | Starts | SIERA | ERA | K% | BB% | GB% | HC% | SC% | aFV | SwS% | |
|---|---|---|---|---|---|---|---|---|---|---|---|
| 2017 | 2 | 4.56 | 2.63 | 19.6% | 3.6% | 28.6% | 40.5% | 11.9% | 92.7 | 9.5% | |
| 2018 | 3 | 5.19 | 6.12 | 18.3% | 13.0% | 32.5% | 44.2% | 10.4% | 93.4 | 10.0% | |
| L14 | 0 | 11.47 | 0.00 | 0.0% | 33.3% | 50.0% | 25.0% | 0.0% | 93.9 | 5.7% | |
Deck McGuire has pitched in 7 games for the Angels this season, including 3 starts. The right-hander hasn’t gone very deep in any of his starts, with his season-high for pitches currently sitting at 64. He threw just 24 pitches in a minor league appearance a couple of days ago, so it’s safe to say he’s not all that stretched out. McGuire is also a low-strikeout guy going into a hitter-friendly park to take on the Indians, so that’s pretty much all you need to know.
Quick Breakdown: Don’t play McGuire.
| Shane Bieber | |||||||||||
 | FanDuel | DraftKings | FantasyDraft | ||||||||
| Salary: | $7,400 | Salary: | $7,400 | Salary: | $14,900 | ||||||
| Salary Rank: | 14 of 29 | Salary Rank: | 12 of 29 | Salary Rank: | 9 of 29 | ||||||
| Stats | Starts | SIERA | ERA | K% | BB% | GB% | HC% | SC% | aFV | SwS% | |
|---|---|---|---|---|---|---|---|---|---|---|---|
| 2018 | 9 | 3.62 | 4.73 | 23.0% | 4.5% | 45.3% | 44.7% | 10.1% | 92.7 | 11.2% | |
| L14 | 2 | 3.88 | 11.25 | 23.1% | 5.1% | 32.1% | 42.9% | 10.7% | 93.7 | 10.1% | |
Shane Bieber has had some decent success as a rookie this season. The right-hander has a respectable strikeout rate of 23% alongside a low 4.5% walk rate. His 3.62 SIERA is quite a bit better than his 4.73 ERA, and he has kept the ball on the ground at a 45.3% clip. The 44.7% hard-hit rate against him is a concern, and he will be facing a Halos lineup today that doesn’t strike out all that much. That said, Mike Trout has missed the last couple of games with a wrist injury, and we saw Corey Kluber absolutely dominate a Trout-free lineup on Saturday. Trout being out of the lineup would be a pretty hefty boost, and Bieber is affordably priced today.
UPDATE: The Angels are without Trout, Justin Upton and Albert Pujols today, which puts Bieber squarely in play as a strong SP2 in all formats.
Quick Breakdown: Bieber is a solid SP2 option today assuming the Angels will still be without Mike Trout.
Batter Grind Down
LA Angels
Shane Bieber has been decent for the Tribe this season, but he has still struggled against left-handed hitters. The Biebs has allowed a .410 wOBA with 4 of his 6 home runs allowed coming against LHBs. There aren’t many lefties of note in this lineup, but Shohei Ohtani and Kole Calhoun grade out as solid plays in the outfield. Bieber has been effective against righties, and the Angels have a low implied total this afternoon. Other than a sprinkling of Ohtani and/or Calhoun, they make for an easy fade in my eyes.
Projected Lineup (Splits vs. RH Pitching)
| # | Player | Bats | xwOBA | ISO | HC% | BB% | K% | GB% | FD Pos. | FD Sal. | DK Pos. | DK Sal. | FDRFT Pos. | FDRFT Sal. |
|---|---|---|---|---|---|---|---|---|---|---|---|---|---|---|
| 1 | Kole Calhoun | LEFT | 0.336 | 0.210 | 40.5% | 6.7% | 24.9% | 48.0% | OF | $3,300 | OF | $4,600 | RF | $8,900 |
| 2 | Justin Upton | RIGHT | 0.388 | 0.216 | 46.3% | 11.8% | 27.3% | 42.6% | OF | $3,200 | OF | $4,600 | LF | $9,100 |
| 3 | Shohei Ohtani | RIGHT | 0.430 | 0.338 | 45.3% | 9.7% | 24.1% | 41.1% | OF | $3,100 | OF | $4,400 | N/A | N/A |
| 4 | Albert Pujols | RIGHT | 0.366 | 0.176 | 41.5% | 4.3% | 12.7% | 38.1% | 1B | $2,700 | 1B | $4,300 | 1B | $8,600 |
| 5 | Andrelton Simmons | RIGHT | 0.349 | 0.117 | 36.8% | 5.6% | 5.2% | 48.6% | SS | $2,900 | SS | $4,500 | SS | $9,000 |
| 6 | David Fletcher | RIGHT | 0.285 | 0.082 | 27.4% | 5.2% | 14.3% | 30.6% | 2B | $2,600 | 2B/3B | $3,700 | 3B | $7,200 |
| 7 | Francisco Arcia | LEFT | 0.497 | 0.615 | 70.0% | 7.1% | 21.4% | 40.0% | C | $2,400 | C | $3,300 | C | $6,500 |
| 8 | Kaleb Cowart | SWITCH | 0.220 | 0.091 | 37.5% | 8.3% | 25.0% | 25.0% | 3B | $2,000 | 3B | $3,700 | 3B | $7,600 |
| 9 | Eric Young | SWITCH | 0.167 | 20.0% | 0.0% | 14.3% | 40.0% | OF | $2,200 | OF | $3,300 | CF | $6,700 | |
| Team Averages | 0.359 | 0.224 | 40.6% | 6.5% | 18.8% | 39.3% |
Elite Plays – Shohei Ohtani
Secondary Plays – Kole Calhoun
Stackability – ORANGE
Cleveland
The Indians bats will have to deal with a hittable righty in Deck McGuire as well as a number of LAA relievers today. As usual, Cleveland makes for one of the top overall offenses today and an elite stacking option. The usual suspects (Francisco Lindor, Jose Ramirez, Michael Brantley, Edwin Encarnacion) are your prime targets, while Jason Kipnis, Yan Gomes and Yonder Alonso can be deployed wherever you see fit. The Tribe stack won’t come cheap, but it’s an offense you’re going to want some exposure to today. With most of the chalk presumably siding with the game at Wrigley today, the Indians might go a little overlooked.
Projected Lineup (Splits vs. RH Pitching)
| # | Player | Bats | xwOBA | ISO | HC% | BB% | K% | GB% | FD Pos. | FD Sal. | DK Pos. | DK Sal. | FDRFT Pos. | FDRFT Sal. |
|---|---|---|---|---|---|---|---|---|---|---|---|---|---|---|
| 1 | Francisco Lindor | SWITCH | 0.412 | 0.286 | 42.7% | 10.0% | 16.3% | 33.7% | SS | $4,800 | SS | $5,700 | SS | $10,200 |
| 2 | Michael Brantley | LEFT | 0.401 | 0.192 | 43.7% | 6.9% | 8.2% | 43.1% | OF | $3,600 | OF | $4,100 | LF | $8,500 |
| 3 | Jose Ramirez | SWITCH | 0.424 | 0.367 | 40.2% | 17.8% | 11.9% | 29.7% | 3B | $5,200 | 3B | $5,900 | IF/OF | $11,000 |
| 4 | Edwin Encarnacion | RIGHT | 0.388 | 0.261 | 43.5% | 8.6% | 23.3% | 38.6% | 1B | $4,000 | 1B | $4,700 | 1B | $9,100 |
| 5 | Yonder Alonso | LEFT | 0.391 | 0.208 | 40.5% | 10.1% | 19.1% | 39.2% | 1B | $3,300 | 1B | $4,200 | 1B | $8,300 |
| 6 | Melky Cabrera | SWITCH | 0.316 | 0.105 | 35.7% | 4.7% | 11.8% | 45.7% | OF | $2,300 | OF | $3,800 | LF | $7,700 |
| 7 | Jason Kipnis | LEFT | 0.335 | 0.125 | 36.0% | 9.6% | 18.8% | 36.5% | 2B | $2,800 | 2B | $3,200 | 2B | $6,800 |
| 8 | Yan Gomes | RIGHT | 0.289 | 0.158 | 40.0% | 4.1% | 29.5% | 32.9% | C | $2,400 | C | $4,000 | C | $7,400 |
| 9 | Leonys Martin | LEFT | 0.395 | 0.167 | 41.7% | 9.9% | 21.0% | 38.9% | OF | $2,900 | OF | $4,200 | CF | $8,400 |
| Team Averages | 0.372 | 0.208 | 40.4% | 9.1% | 17.8% | 37.6% |
Elite Plays – Jose Ramirez, Francisco Lindor, Edwin Encarnacion, Michael Brantley
Secondary Plays – Yan Gomes, Jason Kipnis, Yonder Alonso
Stackability – GREEN
Cincinnati at Washington – 1:35 PM ET
| Cincinnati | Washington | ||||||||||||||
 | Luis Castillo |  | Tanner Roark | ||||||||||||
| RIGHT | RIGHT | ||||||||||||||
| Vegas Moneyline | Vegas Over/Under | ||||||||||||||
| WAS-160 | 9.0 | ||||||||||||||
| Stats | wOBA | xwOBA | HC% | HR/9 | K% | GB% | Stats | wOBA | xwOBA | HC% | HR/9 | K% | GB% | ||
|---|---|---|---|---|---|---|---|---|---|---|---|---|---|---|---|
| SP vs. Left (2016-17) | 0.376 | 0.377 | 44.4% | 1.90 | 21.9% | 38.4% | SP vs. Left (2016-17) | 0.329 | 0.320 | 26.8% | 1.27 | 24.6% | 39.3% | ||
| SP vs. Right (2016-17) | 0.285 | 0.324 | 34.4% | 1.13 | 22.8% | 48.6% | SP vs. Right (2016-17) | 0.305 | 0.352 | 29.6% | 0.95 | 17.5% | 46.0% | ||
Pitcher Grind Down
| Luis Castillo | |||||||||||
 | FanDuel | DraftKings | FantasyDraft | ||||||||
| Salary: | $6,900 | Salary: | $7,900 | Salary: | $15,000 | ||||||
| Salary Rank: | 18 of 29 | Salary Rank: | 10 of 29 | Salary Rank: | 8 of 29 | ||||||
| Stats | Starts | SIERA | ERA | K% | BB% | GB% | HC% | SC% | aFV | SwS% | |
|---|---|---|---|---|---|---|---|---|---|---|---|
| 2017 | 15 | 3.63 | 3.12 | 27.3% | 8.9% | 58.8% | 29.7% | 22.1% | 97.5 | 12.7% | |
| 2018 | 22 | 4.05 | 4.98 | 22.4% | 7.5% | 43.8% | 39.2% | 18.1% | 95.4 | 14.0% | |
| L14 | 2 | 2.94 | 0.73 | 30.4% | 4.4% | 34.5% | 48.3% | 10.3% | 96.1 | 13.4% | |
Luis Castillo has been a guy we’ve wanted to play in certain matchups, but that’s not the case today in DC. The right-hander has a 22.4% strikeout rate and his walks aren’t often an issue. His 4.05 SIERA is also quite a bit more friendly than his 4.98 ERA. Castillo’s ground ball rate this year has plummeted from where it was last season, and he has yielded an unsightly hard contact rate over 39%. He has also allowed 19 homers in his 22 starts. Castillo has also struggled with lefties, and we know the Nationals have plenty of quality LHBs to throw at him. The risk outweighs the reward here, in my opinion.
Quick Breakdown: This isn’t the right spot for Castillo.
| Tanner Roark | |||||||||||
 | FanDuel | DraftKings | FantasyDraft | ||||||||
| Salary: | $7,800 | Salary: | $9,600 | Salary: | $18,700 | ||||||
| Salary Rank: | 10 of 29 | Salary Rank: | 4 of 29 | Salary Rank: | 2 of 29 | ||||||
| Stats | Starts | SIERA | ERA | K% | BB% | GB% | HC% | SC% | aFV | SwS% | |
|---|---|---|---|---|---|---|---|---|---|---|---|
| 2017 | 30 | 4.31 | 4.67 | 21.4% | 8.3% | 48.2% | 27.8% | 16.7% | 92.2 | 10.1% | |
| 2018 | 21 | 4.28 | 4.37 | 21.1% | 8.0% | 42.8% | 28.3% | 19.1% | 91.3 | 8.9% | |
| L14 | 2 | 2.32 | 0.60 | 34.0% | 1.9% | 50.0% | 17.7% | 20.6% | 92.1 | 10.0% | |
Tanner Roark has been his usual unremarkable (from a fantasy perspective) self this season. The righty has a strikeout rate a hair over 21% and a SIERA of 4.28. While the ground balls have come down a tick, he has still been good about limiting hard-hit balls (28.3% hard contact). Roark isn’t a bad pitcher by any means, but his DFS upside is always limited, and today he comes in vastly overpriced at $9,600 on DraftKings. His price is more playable on FanDuel, but this isn’t that great a matchup to begin with. While he comes with a fairly long leash, there are better pitching options on the slate today.
Quick Breakdown: Roark doesn’t have as much upside as some of the other SP2s we can play today.
Batter Grind Down
Cincinnati
Roark has struggled against lefties this season to the tune of a .329 wOBA allowed. 9 of the 16 dingers he has conceded have also come off the bats of lefties. While the Reds aren’t a good team, they do have some quality bats in the lineup. Joey Votto and Scooter Gennett are your top options from the left side, but I wouldn’t talk you out of Eugenio Suarez or Jose Peraza from the right side, either. Cincinnati looks like a middle-of-the-road offense in general today. The problem with playing them in cash games is that they’re fairly expensive and there are stronger offenses to target. The Reds do make for a potentially contrarian GPP stack, however.
Projected Lineup (Splits vs. RH Pitching)
| # | Player | Bats | xwOBA | ISO | HC% | BB% | K% | GB% | FD Pos. | FD Sal. | DK Pos. | DK Sal. | FDRFT Pos. | FDRFT Sal. |
|---|---|---|---|---|---|---|---|---|---|---|---|---|---|---|
| 1 | Jose Peraza | RIGHT | 0.300 | 0.109 | 31.6% | 6.2% | 12.5% | 36.9% | SS | $2,700 | SS | $3,500 | SS | $6,500 |
| 2 | Scooter Gennett | LEFT | 0.351 | 0.192 | 38.7% | 8.0% | 17.5% | 38.6% | 2B | $3,500 | 2B | $4,400 | 2B | $8,000 |
| 3 | Joey Votto | LEFT | 0.455 | 0.159 | 38.7% | 19.3% | 13.0% | 34.4% | 1B | $3,600 | 1B | $4,400 | 1B | $8,200 |
| 4 | Eugenio Suarez | RIGHT | 0.382 | 0.261 | 51.0% | 8.9% | 23.2% | 35.1% | 3B | $3,900 | 3B | $4,600 | 3B | $9,100 |
| 5 | Mason Williams | LEFT | 0.313 | 0.167 | 53.3% | 0.0% | 25.0% | 69.2% | OF | $2,100 | OF | $3,000 | CF | $5,500 |
| 6 | Preston Tucker | LEFT | 0.294 | 0.189 | 41.3% | 5.8% | 26.7% | 48.1% | OF | $2,200 | OF | $3,500 | LF | $6,700 |
| 7 | Tucker Barnhart | SWITCH | 0.340 | 0.111 | 40.5% | 10.7% | 16.6% | 41.7% | C | $2,500 | C | $3,600 | C | $7,700 |
| 8 | Luis Castillo | RIGHT | 0.173 | 0.040 | 18.8% | 7.1% | 35.7% | 85.7% | P | $6,900 | P | $7,900 | P | $15,000 |
| 9 | Billy Hamilton | SWITCH | 0.250 | 0.069 | 20.3% | 10.1% | 24.1% | 44.6% | OF | $2,400 | OF | $3,300 | CF | $6,500 |
| Team Averages | 0.318 | 0.144 | 37.1% | 8.5% | 21.6% | 48.3% |
Elite Plays – Joey Votto, Scooter Gennett
Secondary Plays – Eugenio Suarez, Jose Peraza
Stackability – ORANGE
Washington
The Nationals have been raking lately, and today they’ll take their hacks against Luis Castillo, who has really struggled getting lefties out this season. Left-handed hitters have a wOBA of .376 and they have accounted for 11 of the 19 home runs he’s given up on the year. Bryce Harper left last night’s game with a leg injury, but I’ll still have plenty of interest if he’s good to go this afternoon. Matt Adams, Juan Soto, Adam Eaton and Daniel Murphy are the other top options from the left side. While Castillo has been significantly better against right-handed bats, I still think rounding out your stacks with Trea Turner and Anthony Rendon is viable. Once again, the Nats are one of the best offenses on the slate.
Projected Lineup (Splits vs. RH Pitching)
| # | Player | Bats | xwOBA | ISO | HC% | BB% | K% | GB% | FD Pos. | FD Sal. | DK Pos. | DK Sal. | FDRFT Pos. | FDRFT Sal. |
|---|---|---|---|---|---|---|---|---|---|---|---|---|---|---|
| 1 | Adam Eaton | LEFT | 0.394 | 0.112 | 41.3% | 10.3% | 13.3% | 46.7% | OF | $3,100 | OF | $4,500 | CF | $9,100 |
| 2 | Trea Turner | RIGHT | 0.326 | 0.155 | 32.2% | 8.2% | 20.8% | 52.2% | SS | $4,300 | SS | $5,500 | IF/OF | $10,300 |
| 3 | Anthony Rendon | RIGHT | 0.381 | 0.211 | 37.8% | 9.1% | 14.9% | 36.5% | 3B | $3,800 | 3B | $4,300 | 3B | $8,600 |
| 4 | Bryce Harper | LEFT | 0.397 | 0.280 | 42.4% | 18.8% | 26.2% | 36.4% | OF | $4,600 | OF | $5,500 | RF | $10,300 |
| 5 | Juan Soto | LEFT | 0.379 | 0.229 | 34.6% | 17.4% | 17.9% | 50.0% | OF | $4,000 | OF | $4,900 | LF | $8,700 |
| 6 | Matt Adams | LEFT | 0.389 | 0.283 | 37.6% | 9.3% | 19.6% | 32.2% | 1B | $2,900 | 1B/OF | $4,200 | 1B | $8,000 |
| 7 | Daniel Murphy | LEFT | 0.386 | 0.167 | 19.4% | 8.8% | 8.8% | 30.1% | 2B | $3,500 | 1B/2B | $4,300 | 2B | $8,300 |
| 8 | Matt Wieters | SWITCH | 0.277 | 0.098 | 27.9% | 9.5% | 14.3% | 39.7% | C | $2,400 | C | $3,100 | C | $5,500 |
| 9 | Tanner Roark | RIGHT | 0.161 | 0.080 | 11.8% | 0.0% | 33.3% | 81.3% | P | $7,800 | P | $9,600 | P | $18,700 |
| Team Averages | 0.343 | 0.179 | 31.7% | 10.2% | 18.8% | 45.0% |
Elite Plays – Bryce Harper, Matt Adams, Juan Soto, Daniel Murphy, Anthony Rendon
Secondary Plays – Adam Eaton, Trea Turner, Matt Wieters
Stackability – GREEN
Miami at Philadelphia – 1:35 PM ET
| Miami | Philadelphia | ||||||||||||||
 | Dan Straily |  | Aaron Nola | ||||||||||||
| RIGHT | RIGHT | ||||||||||||||
| Vegas Moneyline | Vegas Over/Under | ||||||||||||||
| PHI-240 | 7.5 | ||||||||||||||
| Stats | wOBA | xwOBA | HC% | HR/9 | K% | GB% | Stats | wOBA | xwOBA | HC% | HR/9 | K% | GB% | ||
|---|---|---|---|---|---|---|---|---|---|---|---|---|---|---|---|
| SP vs. Left (2016-17) | 0.362 | 0.369 | 43.5% | 1.58 | 19.8% | 33.6% | SP vs. Left (2016-17) | 0.258 | 0.284 | 23.5% | 0.40 | 23.4% | 48.0% | ||
| SP vs. Right (2016-17) | 0.311 | 0.380 | 46.0% | 1.93 | 18.5% | 35.5% | SP vs. Right (2016-17) | 0.225 | 0.243 | 26.3% | 0.48 | 28.1% | 53.3% | ||
Pitcher Grind Down
| Dan Straily | |||||||||||
 | FanDuel | DraftKings | FantasyDraft | ||||||||
| Salary: | $6,800 | Salary: | $6,100 | Salary: | $11,900 | ||||||
| Salary Rank: | 19 of 29 | Salary Rank: | 20 of 29 | Salary Rank: | 15 of 29 | ||||||
| Stats | Starts | SIERA | ERA | K% | BB% | GB% | HC% | SC% | aFV | SwS% | |
|---|---|---|---|---|---|---|---|---|---|---|---|
| 2017 | 33 | 4.43 | 4.26 | 22.1% | 7.8% | 34.2% | 32.6% | 19.1% | 90.3 | 12.2% | |
| 2018 | 17 | 4.93 | 4.41 | 19.2% | 10.8% | 34.5% | 44.7% | 14.1% | 90.4 | 10.2% | |
| L14 | 2 | 4.30 | 7.71 | 21.7% | 8.7% | 41.9% | 59.4% | 15.6% | 90.0 | 10.0% | |
Dan Straily has struggled quite a bit this season after being decent in 2017. The right-hander has a 4.93 SIERA along with a subpar K-rate of 19.2%. Straily has allowed hard hits at a gross 44.7% clip, and his fly ball tendency has resulted in 17 homers allowed in 17 starts. While he will get the benefit of facing the high-strikeout Phillies today, Straily also gets a sizable park hit going from Marlins Park to Citizens Bank. I think the downside is greater than the upside here.
Quick Breakdown: Straily isn’t worth the headache on this slate.
| Aaron Nola | |||||||||||
 | FanDuel | DraftKings | FantasyDraft | ||||||||
| Salary: | $10,000 | Salary: | $12,400 | Salary: | $23,800 | ||||||
| Salary Rank: | 2 of 29 | Salary Rank: | 2 of 29 | Salary Rank: | 1 of 29 | ||||||
| Stats | Starts | SIERA | ERA | K% | BB% | GB% | HC% | SC% | aFV | SwS% | |
|---|---|---|---|---|---|---|---|---|---|---|---|
| 2017 | 27 | 3.60 | 3.54 | 26.6% | 7.1% | 49.8% | 29.7% | 21.6% | 92.0 | 10.8% | |
| 2018 | 22 | 3.51 | 2.35 | 25.7% | 6.9% | 50.7% | 24.9% | 22.0% | 92.3 | 11.7% | |
| L14 | 2 | 4.02 | 2.77 | 22.0% | 6.0% | 41.2% | 22.2% | 30.6% | 93.2 | 13.3% | |
Finally, a good pitching option. Aaron Nola has been dominant this season. The right-hander has a 25.7% strikeout rate along with a high ground ball rate of 50.7%. His 3.50 SIERA is quite a bit less friendly than his 2.35 ERA, but he doesn’t walk anybody and his soft contact rate (22%) is nearly as high as his hard contact rate (24.9%). Today he’ll be taking the mound against a punchless Marlins lineup. Miami has struck out 23% of the time against right-handed pitching this season, which is the 10th-highest mark in the league. Nola is expensive, but I think he’s worth paying for today.
Quick Breakdown: Nola is the top pitching option on the main slate.
Batter Grind Down
Miami
I love Nola today, so I certainly don’t like the Marlins. Nola’s been tough on hitters of either handedness and he’s only allowed 7 homers on the year. No, thanks.
Projected Lineup (Splits vs. RH Pitching)
| # | Player | Bats | xwOBA | ISO | HC% | BB% | K% | GB% | FD Pos. | FD Sal. | DK Pos. | DK Sal. | FDRFT Pos. | FDRFT Sal. |
|---|---|---|---|---|---|---|---|---|---|---|---|---|---|---|
| 1 | Starlin Castro | RIGHT | 0.325 | 0.119 | 38.1% | 5.5% | 18.9% | 48.1% | 2B | $2,200 | 2B | $3,700 | 2B | $7,500 |
| 2 | Brian Anderson | RIGHT | 0.360 | 0.126 | 38.0% | 7.0% | 17.4% | 50.4% | OF | $2,800 | 3B/OF | $4,000 | IF/OF | $7,200 |
| 3 | J.T. Realmuto | RIGHT | 0.380 | 0.236 | 39.5% | 5.2% | 16.9% | 42.5% | C | $3,100 | C | $4,400 | C | $8,400 |
| 4 | Justin Bour | LEFT | 0.369 | 0.223 | 42.0% | 16.2% | 25.8% | 39.3% | 1B | $2,500 | 1B | $3,600 | 1B | $7,600 |
| 5 | Martin Prado | RIGHT | 0.274 | 0.075 | 29.1% | 3.6% | 21.7% | 47.6% | 3B | $2,100 | 3B | $2,800 | 3B | $5,900 |
| 6 | Derek Dietrich | LEFT | 0.339 | 0.156 | 36.8% | 6.8% | 23.8% | 39.6% | OF | $2,500 | OF | $3,800 | IF/OF | $7,200 |
| 7 | JT Riddle | LEFT | 0.305 | 0.157 | 34.9% | 4.7% | 22.1% | 48.6% | SS | $2,200 | SS | $2,800 | SS | $5,700 |
| 8 | Magneuris Sierra | LEFT | 0.102 | 0.000 | 18.2% | 0.0% | 38.9% | 77.8% | OF | $2,000 | OF | $3,200 | CF | $6,300 |
| 9 | Wei-Yin Chen | LEFT | 0.120 | 0.048 | 7.7% | 0.0% | 38.1% | 83.3% | P | $5,900 | P | $4,300 | P | $8,300 |
| Team Averages | 0.286 | 0.127 | 31.6% | 5.4% | 24.8% | 53.0% |
Elite Plays – None
Secondary Plays – None
Stackability – RED
Philadelphia
Dan Straily hasn’t been good this season, and he’s really scuffled against lefties. LHBs have a .362 wOBA against him so far in 2018, so the Phillies make for some fine targets this afternoon. The lefties (Odubel Herrera, Carlos Santana, Asdrubal Cabrera, Nick Williams, Cesar Hernandez) stand out as strong plays as one-offs or as a part of a stack. Rhys Hoskins and Maikel Franco are your best bets from the right side. Philly isn’t there with the Cubs, Nationals or Indians today, but there’s some upside here.
Projected Lineup (Splits vs. RH Pitching)
| # | Player | Bats | xwOBA | ISO | HC% | BB% | K% | GB% | FD Pos. | FD Sal. | DK Pos. | DK Sal. | FDRFT Pos. | FDRFT Sal. |
|---|---|---|---|---|---|---|---|---|---|---|---|---|---|---|
| 1 | Cesar Hernandez | SWITCH | 0.320 | 0.124 | 23.3% | 14.2% | 21.9% | 42.1% | 2B | $3,200 | 2B | $4,100 | 2B | $8,500 |
| 2 | Rhys Hoskins | RIGHT | 0.387 | 0.287 | 37.8% | 11.7% | 26.0% | 28.4% | OF | $4,500 | OF | $5,400 | IF/OF | $10,500 |
| 3 | Odubel Herrera | LEFT | 0.304 | 0.197 | 26.1% | 7.5% | 21.6% | 40.3% | OF | $3,200 | OF | $4,200 | IF/OF | $8,200 |
| 4 | Carlos Santana | SWITCH | 0.367 | 0.174 | 34.2% | 20.0% | 15.7% | 39.4% | 1B | $3,500 | 1B | $4,200 | 1B | $8,100 |
| 5 | Asdrubal Cabrera | SWITCH | 0.362 | 0.237 | 43.8% | 8.0% | 21.4% | 39.7% | SS | $3,100 | 2B/SS | $4,200 | SS | $8,500 |
| 6 | Maikel Franco | RIGHT | 0.327 | 0.222 | 25.9% | 5.0% | 14.1% | 53.3% | 3B | $3,700 | 3B | $4,200 | 3B | $8,300 |
| 7 | Roman Quinn | SWITCH | 0.344 | 0.125 | 12.5% | 0.0% | 0.0% | 71.4% | OF | $2,500 | OF | $4,200 | CF | $8,500 |
| 8 | Jorge Alfaro | RIGHT | 0.276 | 0.139 | 33.6% | 4.3% | 38.8% | 53.1% | C | $2,500 | C | $3,300 | C | $6,700 |
| 9 | Aaron Nola | RIGHT | 0.126 | 0.034 | 5.6% | 2.9% | 44.1% | 63.6% | P | $10,000 | P | $12,400 | P | $23,800 |
| Team Averages | 0.313 | 0.171 | 27.0% | 8.2% | 22.6% | 47.9% |
Elite Plays – Odubel Herrera, Asdrubal Cabrera, Nick Williams, Rhys Hoskins, Carlos Santana, Cesar Hernandez
Secondary Plays – Maikel Franco, Jorge Alfaro
Stackability – YELLOW
Note: Unless noted, all statistics in the Grind Down are from the 2018 season.