MLB Grind Down: Thursday, July 28th
The RotoGrinders MLB Grind Down will give you an in-depth analysis into the upcoming MLB schedule. This article will break down the numbers for every single game and give you analysis on which trends you can exploit. While matchups are a major factor in daily fantasy baseball, there are plenty of other factors to consider such as injuries, weather, and salaries.
The analysis should point you in the right direction, but it is still up to you to decipher the information and make your own selections. No sport has more variance than baseball. The best choice is not always the right choice but following the trends will win you money over time.
Note: As always, if you want to try a new DFS site, be sure to click through a RotoGrinders link and use our DraftKings promo code and FanDuel promo code to receive the best perks in the industry.
Stackability Rating System:
GREEN – One of the top stacks of the day, viable in cash games and GPPs
YELLOW – A viable stack option in most formats, specifically GPPs
ORANGE – There are better stacks out there, but playable in large GPPs
RED – Not a recommended stack for cash games or GPPs
Colorado at NY Mets – 1:10 PM ET
| Colorado | NY Mets |
 | |  | Jacob deGrom |
| LEFT | RIGHT |
| Vegas Moneyline | Vegas Over/Under |
| NYM -180 | 7.0 |
| Stats | wOBA | HR All. | K% | BB% | Stats | wOBA | HR All. | K% | BB% |
| SP vs. Left | 0.298 | 0 | 15.7% | 13.7% | SP vs. Left | 0.275 | 15 | 25.5% | 5.1% |
| SP vs. Right | 0.322 | 4 | 21.9% | 2.0% | SP vs. Right | 0.245 | 11 | 27.0% | 5.4% |
Pitcher Grind Down
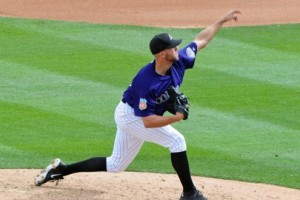
| Tyler Anderson |
 | FanDuel | DraftKings |
| Salary: | $6,300 | Salary: | $7,700 |
| FPPG: | 27.3 | FPPG: | 14.0 |
| Pitcher Rating: | 57.8 | Pitcher Rank: | 10 |
| Statistics | Starts | PitchPS | SIERA | ERA | K% | BB% | SS% | GB% | FB% | HH% |
| L30 Days | 5 | 96.8 | 3.95 | 4.15 | 17.8% | 5.4% | 9.9% | 53.7% | 25.3% | 27.8% |
| 2016 | 8 | 96.6 | 3.51 | 3.56 | 20.3% | 5.0% | 10.5% | 56.6% | 22.8% | 28.2% |
Anderson has been sharp in his first eight major league starts, posting a 3.51 SIERA with a strikeout rate of 20.3%. He has an above-average swinging strike rate and he is inducing ground balls at a rate of 56.6%. Typically, ground ball pitchers limit the hard hit contact against them and that’s the case here, as Anderson has a 28.2% hard hit contact rate. He is listed as a heavy underdog today against the Mets, but that has more to do with the opposing pitcher than anything else. Anderson is a sneaky GPP play, as the Mets are ranked 22nd in team wOBA (.310) and 23rd in team strikeout rate (23%) against left-handed pitching.
| Jacob deGrom |
 | FanDuel | DraftKings |
| Salary: | $10,400 | Salary: | $10,300 |
| FPPG: | 31.7 | FPPG: | 17.8 |
| Pitcher Rating: | 90.2 | Pitcher Rank: | 2 |
| Statistics | Starts | PitchPS | SIERA | ERA | K% | BB% | SS% | GB% | FB% | HH% |
| L30 Days | 4 | 100.3 | 3.15 | 2.92 | 26.8% | 5.2% | 9.2% | 49.2% | 29.2% | 25.8% |
| 2016 | 17 | 98.2 | 3.50 | 2.73 | 24.3% | 5.7% | 10.3% | 47.4% | 29.8% | 31.5% |
| 2015 | 30 | 99.2 | 2.99 | 2.54 | 27.3% | 5.1% | 12.7% | 44.4% | 34.7% | 26.3% |
If you are playing in the early-only slate with two games, deGrom is the obvious chalk of all chalk. He will likely be 95% owned in cash games and 70% owned in tournaments. When the other options are , , and , it’s hard not to plug deGrom in at pitcher. He has been in excellent form over the last four starts and he draws a favorable matchup today against the Rockies, who are ranked 29th in team wOBA (.292) on the road this season.
Batter Grind Down
Colorado
The Rockies have the lowest implied team total in the early slate and the second lowest of the 18 teams in action today. They draw a difficult matchup against Jacob deGrom and they have to face him in the pitcher-friendly Citi Field. As mentioned earlier, the Rockies are one of the worst road offenses in baseball, which doesn’t bode well for their fantasy appeal today.
- Rockies Offense (2016)
Team wOBA vs. RHP — 0.337 (4 of 30)
Team ISO vs. RHP — 0.185 (6 of 30)
Team K% vs. RHP — 20.3% (12 of 30)
Pitches Per PA vs. RHP — 3.87 (16 of 30)
Runs Per Game — 5.12 (2 of 30)
Projected Run Total — 3.04 (17 of 18)
Confirmed Lineup
| # | Player | Bats | wOBA vs. RHP | ISO vs. RHP | wOBA L14 | FD Position | FD Salary | DK Position | DK Salary |
| 1 | | LEFT | 0.360 | 0.178 | 0.234 | OF | $3,200 | OF | $3,300 |
| 2 | | RIGHT | 0.339 | 0.112 | 0.333 | 2B | $3,200 | 2B | $2,900 |
| 3 | | RIGHT | 0.386 | 0.309 | 0.367 | 3B | $3,400 | 3B | $4,000 |
| 4 | | LEFT | 0.409 | 0.287 | 0.363 | OF | $3,000 | OF | $3,800 |
| 5 | | RIGHT | 0.365 | 0.295 | 0.497 | SS | $3,400 | SS | $4,600 |
| 6 | | LEFT | 0.315 | 0.250 | 0.315 | OF | $2,400 | OF | $2,000 |
| 7 | | LEFT | 0.306 | 0.126 | 0.295 | 2B | $2,700 | 1B/OF | $2,400 |
| 8 | | LEFT | 0.316 | 0.138 | 0.558 | C | $2,800 | C | $2,200 |
| 9 | | LEFT | 0.241 | 0.250 | 0.000 | P | $6,300 | P | $7,700 |
| | Team Averages | — | 0.337 | 0.216 | 0.329 | — | — | — | — |
Elite Plays – NONE
Secondary Plays – NONE
Stackability – RED
NY Mets
If you are playing in the all-day slate, I would recommend fading the Mets in lieu of some of the better matchups out there. However, if you are playing in the early-only slate, you may want to give a few of the right-handed hitters in this lineup a look. The sample size is small (eight starts), but has allowed a .322 wOBA and four home runs to batters from the right side of the plate.
- Mets Offense (2016)
Team wOBA vs. LHP — 0.310 (22 of 30)
Team ISO vs. LHP — 0.170 (12 of 30)
Team K% vs. LHP — 23.0% (21 of 30)
Pitches Per PA vs. LHP — 3.90 (11 of 30)
Runs Per Game — 3.71 (28 of 30)
Projected Run Total — 3.96 (9 of 18)
Confirmed Lineup
| # | Player | Bats | wOBA vs. LHP | ISO vs. LHP | wOBA L14 | FD Position | FD Salary | DK Position | DK Salary |
| 1 | | RIGHT | 0.319 | 0.136 | 0.316 | OF | $2,500 | OF | $2,800 |
| 2 | | LEFT | 0.279 | 0.135 | 0.263 | OF | $2,900 | OF | $3,300 |
| 3 | | RIGHT | 0.418 | 0.313 | 0.412 | 3B | $3,200 | 3B | $4,200 |
| 4 | | SWITCH | 0.296 | 0.134 | 0.224 | 2B | $3,100 | 2B | $3,100 |
| 5 | | SWITCH | 0.317 | 0.137 | 0.274 | SS | $2,500 | SS | $3,000 |
| 6 | | LEFT | 0.244 | 0.088 | 0.337 | 1B | $2,400 | 1B | $3,000 |
| 7 | | RIGHT | 0.238 | 0.087 | 0.389 | C | $2,200 | C | $2,400 |
| 8 | Alejandro | LEFT | 0.232 | 0.098 | 0.427 | OF | $2,200 | OF | $2,900 |
| 9 | Jacob deGrom | RIGHT | 0.068 | 0.000 | 0.530 | P | $10,400 | P | $10,300 |
| | Team Averages | — | 0.268 | 0.125 | 0.352 | — | — | — | — |
Elite Plays –
Secondary Plays – ,
Stackability – ORANGE / YELLOW
Arizona at Milwaukee – 2:10 PM ET
| Arizona | Milwaukee |
 | |  | |
| LEFT | RIGHT |
| Vegas Moneyline | Vegas Over/Under |
| MIL -136 | 8.5 |
| Stats | wOBA | HR All. | K% | BB% | Stats | wOBA | HR All. | K% | BB% |
| SP vs. Left | 0.314 | 4 | 25.7% | 5.8% | SP vs. Left | 0.310 | 7 | 19.0% | 8.1% |
| SP vs. Right | 0.334 | 19 | 23.7% | 9.9% | SP vs. Right | 0.284 | 7 | 19.3% | 7.0% |
Pitcher Grind Down
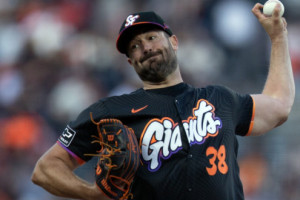
| Robbie Ray |
 | FanDuel | DraftKings |
| Salary: | $7,800 | Salary: | $9,100 |
| FPPG: | 31.0 | FPPG: | 15.9 |
| Pitcher Rating: | 62.5 | Pitcher Rank: | 9 |
| Statistics | Starts | PitchPS | SIERA | ERA | K% | BB% | SS% | GB% | FB% | HH% |
| L30 Days | 4 | 100.0 | 3.14 | 3.91 | 31.1% | 7.8% | 14.0% | 41.7% | 35.0% | 35.0% |
| 2016 | 20 | 100.2 | 3.65 | 4.53 | 26.8% | 8.7% | 10.8% | 45.0% | 31.6% | 34.9% |
| 2015 | 23 | 98.1 | 4.05 | 3.52 | 21.8% | 9.0% | 9.0% | 43.3% | 34.6% | 35.0% |
After a slow start to the season, Ray is finally finding some form. In his last four starts, he has a 3.14 SIERA with a strikeout rate of 31.1%. During that stretch, he had a swinging strike rate of 14%. He draws a boom or bust type of matchup tonight against the Brewers. While Miller Park is known as a hitter’s ballpark, the Brewers have the highest strikeout rate (24.2%) against left-handed pitching. Once again, Jacob deGrom makes the most sense on single-pitcher sites, but Ray is certainly worth a look on multi-pitcher sites like DraftKings.
| Zach Davies |
 | FanDuel | DraftKings |
| Salary: | $7,500 | Salary: | $8,600 |
| FPPG: | 29.5 | FPPG: | 15.2 |
| Pitcher Rating: | 52.3 | Pitcher Rank: | 11 |
| Statistics | Starts | PitchPS | SIERA | ERA | K% | BB% | SS% | GB% | FB% | HH% |
| L30 Days | 4 | 93.5 | 4.42 | 3.33 | 15.5% | 5.2% | 7.5% | 50.0% | 32.9% | 36.4% |
| 2016 | 17 | 92.5 | 4.12 | 3.64 | 19.8% | 6.4% | 7.9% | 46.9% | 32.6% | 34.4% |
| 2015 | 6 | 89.8 | 4.34 | 3.71 | 17.3% | 10.8% | 10.0% | 57.6% | 21.2% | 32.0% |
Davies hasn’t been in his best form recently, posting a 4.42 SIERA with a strikeout rate of only 15.5% in his last four starts. He had that one stretch where he was striking everyone out, but for the most part he has been a low strikeout pitcher. He draws a decent matchup today against the Diamondbacks, who have the fifth highest strikeout rate (23.4%) against right-handed pitching. Davies is a small favorite in this one, but he doesn’t have as much strikeout upside as his pitching counterpart, .
Batter Grind Down
Arizona
The Brewers have been a mediocre offense against right-handed pitching this season, but they have the second highest implied team total in the early-only slate. They draw a decent matchup against , who has a 34.4% hard hit contact rate on the season. Davies has been tough on batters from both sides of the plate, but he is a low strikeout pitcher and the Diamondbacks get to face him in Miller Park.
- Diamondbacks Offense (2016)
Team wOBA vs. RHP — 0.314 (17 of 30)
Team ISO vs. RHP — 0.158 (17 of 30)
Team K% vs. RHP — 23.4% (26 of 30)
Pitches Per PA vs. RHP — 3.85 (19 of 30)
Runs Per Game — 4.44 (17 of 30)
Projected Run Total — 4.04 (7 of 18)
Confirmed Lineup
| # | Player | Bats | wOBA vs. RHP | ISO vs. RHP | wOBA L14 | FD Position | FD Salary | DK Position | DK Salary |
| 1 | | LEFT | 0.275 | 0.071 | 0.301 | OF | $3,000 | OF | $3,800 |
| 2 | | RIGHT | 0.333 | 0.146 | 0.250 | 2B | $2,200 | 2B/3B | $3,000 |
| 3 | | RIGHT | 0.304 | 0.102 | 0.414 | 2B | $3,800 | 2B | $4,900 |
| 4 | | RIGHT | 0.392 | 0.227 | 0.346 | 1B | $3,900 | 1B | $4,400 |
| 5 | | RIGHT | 0.232 | 0.087 | 0.257 | OF | $2,500 | OF | $3,900 |
| 6 | | RIGHT | 0.297 | 0.136 | 0.442 | OF | $3,400 | OF | $3,400 |
| 7 | | RIGHT | 0.319 | 0.165 | 0.286 | OF | $3,000 | 3B/OF | $3,600 |
| 8 | | RIGHT | 0.233 | 0.065 | 0.193 | C | $2,300 | C | $2,500 |
| 9 | | LEFT | 0.167 | 0.104 | 0.311 | P | $7,800 | P | $9,100 |
| | Team Averages | — | 0.284 | 0.123 | 0.311 | — | — | — | — |
Elite Plays – , ,
Secondary Plays – , ,
Stackability – YELLOW
Milwaukee
The Brewers haven’t been great against southpaws as a whole, but they have a few hitters that mash left-handed pitching historically. They come into the game with the fifth highest implied team total overall and the highest of the four teams in the early-only slate. Over the last two seasons, has allowed a .334 wOBA and 19 home runs to right-handed hitters.
- Brewers Offense (2016)
Team wOBA vs. LHP — 0.321 (16 of 30)
Team ISO vs. LHP — 0.144 (24 of 30)
Team K% vs. LHP — 24.2% (30 of 30)
Pitches Per PA vs. LHP — 3.93 (4 of 30)
Runs Per Game — 4.03 (24 of 30)
Projected Run Total — 4.46 (5 of 18)
Confirmed Lineup
| # | Player | Bats | wOBA vs. LHP | ISO vs. LHP | wOBA L14 | FD Position | FD Salary | DK Position | DK Salary |
| 1 | | RIGHT | 0.363 | 0.119 | 0.366 | 2B | $2,200 | 1B/3B | $2,400 |
| 2 | | LEFT | 0.264 | 0.129 | 0.315 | 2B | $3,000 | 2B | $3,900 |
| 3 | | RIGHT | 0.415 | 0.227 | 0.435 | OF | $3,800 | OF | $5,200 |
| 4 | | RIGHT | 0.336 | 0.246 | 0.194 | 1B | $3,600 | 1B | $3,700 |
| 5 | | RIGHT | 0.296 | 0.186 | 0.366 | 3B | $2,700 | 3B/OF | $3,500 |
| 6 | | RIGHT | 0.308 | 0.173 | 0.558 | C | $2,300 | C | $2,500 |
| 7 | | RIGHT | 0.252 | 0.026 | 0.224 | OF | $2,100 | OF | $3,200 |
| 8 | | LEFT | 0.236 | 0.000 | 0.208 | OF | $2,200 | OF | $2,100 |
| 9 | | RIGHT | 0.084 | 0.000 | 0.000 | P | $7,500 | P | $8,600 |
| | Team Averages | — | 0.284 | 0.123 | 0.296 | — | — | — | — |
Elite Plays – , ,
Secondary Plays – ,
Stackability – YELLOW
Philadelphia at Atlanta – 7:10 PM ET
| Philadelphia | Atlanta |
 | |  | |
| RIGHT | RIGHT |
| Vegas Moneyline | Vegas Over/Under |
| PHI -130 | 7.5 |
| Stats | wOBA | HR All. | K% | BB% | Stats | wOBA | HR All. | K% | BB% |
| SP vs. Left | 0.320 | 10 | 18.6% | 7.7% | SP vs. Left | 0.379 | 20 | 11.9% | 10.9% |
| SP vs. Right | 0.289 | 11 | 27.8% | 4.4% | SP vs. Right | 0.290 | 15 | 21.1% | 4.0% |
Pitcher Grind Down
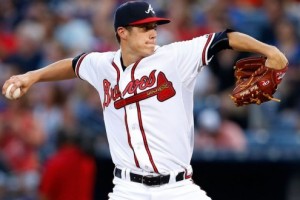
| Aaron Nola |
 | FanDuel | DraftKings |
| Salary: | $8,000 | Salary: | $8,400 |
| FPPG: | 29.4 | FPPG: | 15.5 |
| Pitcher Rating: | 74.2 | Pitcher Rank: | 6 |
| Statistics | Starts | PitchPS | SIERA | ERA | K% | BB% | SS% | GB% | FB% | HH% |
| L30 Days | 3 | 81.0 | 3.30 | 6.60 | 27.4% | 6.5% | 10.7% | 50.0% | 34.2% | 31.7% |
| 2016 | 19 | 89.5 | 3.21 | 4.75 | 25.4% | 5.7% | 9.6% | 54.9% | 24.9% | 27.5% |
| 2015 | 13 | 85.9 | 3.66 | 3.59 | 21.4% | 6.0% | 8.6% | 47.6% | 32.4% | 28.8% |
Nola has a full run and a half difference between his SIERA and ERA. Luckily (at least for DFS purposes), his ERA in higher than his SIERA, which suggests some improvement in the second half of the season. The peripheral stats look great, as he currently boasts a 3.21 SIERA with a strikeout rate of 25.4%. He draws a favorable matchup tonight against the Braves, who are ranked dead last in both team wOBA (.286) and team ISO (.120) against right-handed pitching. At his discounted price, I like Nola in all league formats tonight.
| Matt Wisler |
 | FanDuel | DraftKings |
| Salary: | $6,700 | Salary: | $5,600 |
| FPPG: | 23.6 | FPPG: | 11.6 |
| Pitcher Rating: | 49.9 | Pitcher Rank: | 14 |
| Statistics | Starts | PitchPS | SIERA | ERA | K% | BB% | SS% | GB% | FB% | HH% |
| L30 Days | 5 | 94.2 | 4.04 | 7.24 | 21.4% | 6.4% | 12.3% | 40.9% | 37.5% | 35.6% |
| 2016 | 19 | 95.5 | 4.62 | 4.92 | 17.6% | 6.8% | 9.0% | 38.2% | 42.3% | 37.3% |
| 2015 | 19 | 93.3 | 4.98 | 4.71 | 15.1% | 8.4% | 8.1% | 33.6% | 43.2% | 28.2% |
This should be a fun series, as two of the worst offenses in baseball square off in a pitcher-friendly ballpark. Wisler is not having a great season thus far, posting a 4.62 SIERA with a strikeout rate of only 17.6%. He is a fly-ball pitcher that has given up a 37.3% hard hit contact rate. That’s generally not a great combination, especially when you throw in the low strikeout rate. Even though his matchup looks favorable, I will be fading Wisler in both cash games and GPPs.
Batter Grind Down
Philadelphia
The Phillies are a sneaky offense to target tonight, as they have the tenth highest team total on the board. Turner Field isn’t exactly built for offensive production, but they draw a favorable matchup against the struggling . In the last two seasons, Wisler has allowed a .379 wOBA and 20 home runs to left-handed hitters. I always like targeting batters against pitchers that have both a high fly ball rate and a high hard contact rate.
- Phillies Offense (2016)
Team wOBA vs. RHP — 0.295 (28 of 30)
Team ISO vs. RHP — 0.154 (20 of 30)
Team K% vs. RHP — 21.6% (18 of 30)
Pitches Per PA vs. RHP — 3.74 (28 of 30)
Runs Per Game — 3.51 (29 of 30)
Projected Run Total — 3.93 (10 of 18)
Projected Lineup
| # | Player | Bats | wOBA vs. RHP | ISO vs. RHP | wOBA L14 | FD Position | FD Salary | DK Position | DK Salary |
| 1 | | SWITCH | 0.300 | 0.088 | 0.326 | 2B | $2,800 | 2B | $3,800 |
| 2 | | LEFT | 0.351 | 0.148 | 0.298 | OF | $3,800 | OF | $4,900 |
| 3 | | RIGHT | 0.339 | 0.203 | 0.211 | 3B | $3,300 | 3B | $3,300 |
| 4 | | RIGHT | 0.313 | 0.239 | 0.360 | 1B | $3,100 | 1B | $3,900 |
| 5 | | RIGHT | 0.291 | 0.142 | 0.273 | C | $2,900 | C | $3,500 |
| 6 | | LEFT | 0.300 | 0.165 | 0.149 | OF | $2,900 | OF | $2,900 |
| 7 | | SWITCH | 0.290 | 0.125 | 0.246 | SS | $2,700 | SS | $3,400 |
| 8 | | SWITCH | 0.316 | 0.156 | 0.110 | OF | $2,000 | OF | $2,600 |
| 9 | | RIGHT | 0.111 | 0.023 | 0.144 | P | $8,000 | P | $8,400 |
| | Team Averages | — | 0.290 | 0.143 | 0.235 | — | — | — | — |
Elite Plays –
Secondary Plays – , ,
Stackability – ORANGE / YELLOW
Atlanta
With being one of my favorite value plays on the board tonight, I’m obviously not very high on the Braves’ offense. They continue to struggle against right-handed pitching and they come into tonight’s game with the sixth lowest team total on the board. Nola has allowed a .320 wOBA to left-handed hitters in the last two seasons, but as we mentioned above, his peripheral statistics suggest improvement moving forward.
- Braves Offense (2016)
Team wOBA vs. RHP — 0.286 (30 of 30)
Team ISO vs. RHP — 0.120 (30 of 30)
Team K% vs. RHP — 20.0% (9 of 30)
Pitches Per PA vs. RHP — 3.69 (29 of 30)
Runs Per Game — 3.43 (30 of 30)
Projected Run Total — 3.57 (13 of 18)
Projected Lineup
| # | Player | Bats | wOBA vs. RHP | ISO vs. RHP | wOBA L14 | FD Position | FD Salary | DK Position | DK Salary |
| 1 | | LEFT | 0.314 | 0.113 | 0.335 | 2B | $3,100 | 2B/OF | $3,100 |
| 2 | | RIGHT | 0.286 | 0.137 | 0.186 | 2B | $2,400 | 2B/3B | $2,800 |
| 3 | | LEFT | 0.373 | 0.239 | 0.330 | 1B | $3,300 | 1B | $3,600 |
| 4 | | LEFT | 0.336 | 0.103 | 0.339 | OF | $2,500 | OF | $3,500 |
| 5 | | RIGHT | 0.299 | 0.173 | 0.219 | OF | $2,900 | OF | $2,700 |
| 6 | | LEFT | 0.333 | 0.113 | 0.336 | OF | $2,200 | OF | $3,700 |
| 7 | | LEFT | 0.309 | 0.127 | 0.332 | C | $2,100 | C | $2,500 |
| 8 | | SWITCH | 0.278 | 0.070 | 0.296 | SS | $2,000 | SS | $2,400 |
| 9 | | RIGHT | 0.119 | 0.000 | 0.293 | P | $6,700 | P | $5,600 |
| | Team Averages | — | 0.294 | 0.119 | 0.296 | — | — | — | — |
Elite Plays – NONE
Secondary Plays –
Stackability – RED
St. Louis at Miami – 7:10 PM ET
| St. Louis | Miami |
 | |  | |
| RIGHT | RIGHT |
| Vegas Moneyline | Vegas Over/Under |
| MIA -185 | 7.0 |
| Stats | wOBA | HR All. | K% | BB% | Stats | wOBA | HR All. | K% | BB% |
| SP vs. Left | 0.289 | 10 | 19.4% | 7.9% | SP vs. Left | 0.315 | 8 | 27.2% | 8.6% |
| SP vs. Right | 0.320 | 20 | 20.6% | 7.5% | SP vs. Right | 0.210 | 4 | 41.5% | 4.6% |
Pitcher Grind Down
| Michael Wacha |
 | FanDuel | DraftKings |
| Salary: | $7,300 | Salary: | $6,500 |
| FPPG: | 27.1 | FPPG: | 13.5 |
| Pitcher Rating: | 50.6 | Pitcher Rank: | 13 |
| Statistics | Starts | PitchPS | SIERA | ERA | K% | BB% | SS% | GB% | FB% | HH% |
| L30 Days | 5 | 97.6 | 3.84 | 4.23 | 20.2% | 5.4% | 9.2% | 48.9% | 27.7% | 34.4% |
| 2016 | 20 | 96.5 | 4.22 | 4.37 | 20.1% | 7.8% | 8.5% | 46.1% | 29.8% | 30.1% |
| 2015 | 30 | 97.9 | 4.02 | 3.37 | 20.1% | 7.6% | 9.5% | 45.8% | 32.0% | 29.7% |
Wacha has been the definition of mediocre. He has a 4.22 SIERA, a strikeout rate of 20.1%, and a walk rate of 7.8%. He doesn’t do anything great, but he doesn’t do anything poorly either. There are times when we can target him in DFS, but tonight is not one of them. It has more to do with the opposing pitcher than anything else. Wacha is a heavy underdog tonight against the Marlins, who have the fifth lowest strikeout rate (19%) against right-handed pitching.
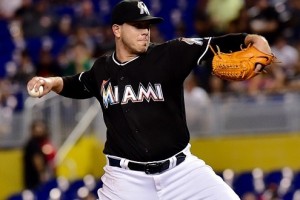
| Jose Fernandez |
 | FanDuel | DraftKings |
| Salary: | $11,800 | Salary: | $13,400 |
| FPPG: | 46.5 | FPPG: | 26.2 |
| Pitcher Rating: | 97.8 | Pitcher Rank: | 1 |
| Statistics | Starts | PitchPS | SIERA | ERA | K% | BB% | SS% | GB% | FB% | HH% |
| L30 Days | 4 | 101.8 | 2.48 | 3.46 | 33.9% | 4.6% | 14.0% | 40.6% | 25.0% | 24.2% |
| 2016 | 19 | 100.8 | 2.55 | 2.54 | 36.8% | 7.4% | 14.8% | 41.3% | 30.3% | 31.3% |
| 2015 | 11 | 90.2 | 2.77 | 2.92 | 29.8% | 5.3% | 13.3% | 40.1% | 31.1% | 29.4% |
Fernandez rarely has a bad outing these days. In 19 starts this season, he has a 2.55 SIERA with a strikeout rate of 36.8%. He generates a ton of swings and misses and he has limited the hard hit contact against him. When you put him in that massive Marlins Park, he can attack each and every hitter, as he knows how hard it is to hit home runs in Miami. He is the premier play at pitcher tonight and I’m not overly concerned about the matchup. The Cardinals are a tough offense, but is pitching at home, don’t overthink this one.
Batter Grind Down
St. Louis
The Cardinals may be ranked third in team wOBA and first in team ISO against right-handed pitching this season, but we can throw all of that out the window tonight. Targeting hitters against is never a great idea, especially when he is pitching at home. Unless the site you are playing on rewards fantasy points for swings and misses, you should be avoiding the hitters from the Cardinals.
- Cardinals Offense (2016)
Team wOBA vs. RHP — 0.340 (3 of 30)
Team ISO vs. RHP — 0.198 (1 of 30)
Team K% vs. RHP — 20.0% (9 of 30)
Pitches Per PA vs. RHP — 3.83 (20 of 30)
Runs Per Game — 5.08 (3 of 30)
Projected Run Total — 3.01 (18 of 18)
Projected Lineup
| # | Player | Bats | wOBA vs. RHP | ISO vs. RHP | wOBA L14 | FD Position | FD Salary | DK Position | DK Salary |
| 1 | | LEFT | 0.346 | 0.136 | 0.317 | 2B | $2,300 | 2B/3B | $2,300 |
| 2 | | RIGHT | 0.387 | 0.216 | 0.318 | SS | $2,700 | SS | $3,500 |
| 3 | | RIGHT | 0.339 | 0.167 | 0.335 | OF | $3,200 | OF | $3,000 |
| 4 | | RIGHT | 0.339 | 0.167 | 0.280 | OF | $2,600 | OF | $2,700 |
| 5 | | LEFT | 0.320 | 0.203 | 0.333 | 1B | $2,700 | 1B | $2,700 |
| 6 | | RIGHT | 0.312 | 0.202 | 0.457 | 3B | $2,900 | 1B/2B | $3,300 |
| 7 | | RIGHT | 0.358 | 0.266 | 0.288 | OF | $3,000 | OF | $3,100 |
| 8 | | RIGHT | 0.301 | 0.094 | 0.364 | C | $3,200 | C | $2,500 |
| 9 | | RIGHT | 0.135 | 0.014 | 0.000 | P | $7,300 | P | $6,500 |
| | Team Averages | — | 0.315 | 0.163 | 0.299 | — | — | — | — |
Elite Plays – NONE
Secondary Plays – NONE
Stackability – RED
Miami
The Marlins are favored in this game, but their matchup against is less than ideal. Over the last two seasons, Wacha has held left-handed hitters to a .289 wOBA. He has given up a .320 wOBA to right-handed hitters though, so you could certainly give a look tonight. is really the only elite play in this game. Oh, before we move on, Dee Gordon is on track to return to the Marlins’ lineup tonight. He is going to really help this offense moving forward and he will be a great fantasy option soon enough.
- Marlins Offense (2016)
Team wOBA vs. RHP — 0.318 (12 of 30)
Team ISO vs. RHP — 0.135 (28 of 30)
Team K% vs. RHP — 19.0% (5 of 30)
Pitches Per PA vs. RHP — 3.82 (23 of 30)
Runs Per Game — 4.21 (21 of 30)
Projected Run Total — 3.99 (8 of 18)
Projected Lineup
| # | Player | Bats | wOBA vs. RHP | ISO vs. RHP | wOBA L14 | FD Position | FD Salary | DK Position | DK Salary |
| 1 | Dee Gordon | LEFT | 0.321 | 0.080 | | | | 2B | $4,500 |
| 2 | | RIGHT | 0.306 | 0.090 | 0.365 | 3B | $3,100 | 3B | $3,400 |
| 3 | | LEFT | 0.376 | 0.164 | 0.407 | OF | $3,600 | OF | $5,300 |
| 4 | | RIGHT | 0.356 | 0.259 | 0.386 | OF | $3,600 | OF | $4,200 |
| 5 | | RIGHT | 0.306 | 0.139 | 0.262 | OF | $3,200 | OF | $3,400 |
| 6 | | RIGHT | 0.318 | 0.123 | 0.304 | C | $3,000 | C | $3,900 |
| 7 | | RIGHT | 0.275 | 0.085 | 0.319 | SS | $2,000 | SS | $2,900 |
| 8 | Chris Johnson | RIGHT | 0.251 | 0.096 | 0.320 | 1B | $2,000 | 1B | $2,400 |
| 9 | | RIGHT | 0.250 | 0.104 | 0.585 | P | $11,800 | P | $13,400 |
| | Team Averages | — | 0.307 | 0.127 | 0.369 | — | — | — | — |
Elite Plays – NONE
Secondary Plays – ,
Stackability – ORANGE
Baltimore at Minnesota – 7:10 PM ET
| Baltimore | Minnesota |
 | |  | |
| RIGHT | RIGHT |
| Vegas Moneyline | Vegas Over/Under |
| MIN -105 | 10.0 |
| Stats | wOBA | HR All. | K% | BB% | Stats | wOBA | HR All. | K% | BB% |
| SP vs. Left | 0.343 | 20 | 21.3% | 9.8% | SP vs. Left | 0.314 | 12 | 16.3% | 8.5% |
| SP vs. Right | 0.341 | 10 | 19.1% | 10.0% | SP vs. Right | 0.301 | 14 | 18.5% | 7.4% |
Pitcher Grind Down
| Ubaldo Jimenez |
 | FanDuel | DraftKings |
| Salary: | $6,200 | Salary: | $4,700 |
| FPPG: | 17.8 | FPPG: | 6.4 |
| Pitcher Rating: | 40.4 | Pitcher Rank: | 17 |
| Statistics | Starts | PitchPS | SIERA | ERA | K% | BB% | SS% | GB% | FB% | HH% |
| L30 Days | 3 | 71.0 | 6.26 | 10.13 | 14.8% | 16.7% | 8.9% | 44.4% | 36.1% | 29.7% |
| 2016 | 17 | 91.2 | 5.06 | 7.38 | 18.0% | 12.5% | 7.7% | 49.1% | 29.7% | 33.3% |
| 2015 | 32 | 95.6 | 3.93 | 4.11 | 21.2% | 8.6% | 8.0% | 49.1% | 28.8% | 27.0% |
The argument can be made that is the worst starting pitcher in baseball. There are some great candidates for that title, but Jimenez is trying his best to make a run for it. In 17 starts this season, he has a 7.38 ERA with a strikeout rate of 18% and a walk rate of 12.5%. He has been an easy fade for quite some time now and there is no reason to change our thought process with him tonight. This game is basically set as a pick ‘em with an over/under of 10.0 runs.
| Kyle Gibson |
 | FanDuel | DraftKings |
| Salary: | $6,700 | Salary: | $6,600 |
| FPPG: | 24.3 | FPPG: | 11.7 |
| Pitcher Rating: | 47.0 | Pitcher Rank: | 15 |
| Statistics | Starts | PitchPS | SIERA | ERA | K% | BB% | SS% | GB% | FB% | HH% |
| L30 Days | 5 | 100.8 | 3.74 | 3.03 | 21.8% | 6.0% | 9.5% | 50.5% | 29.5% | 25.0% |
| 2016 | 12 | 97.8 | 4.51 | 4.67 | 16.6% | 8.1% | 9.2% | 52.4% | 27.8% | 26.5% |
| 2015 | 32 | 101.1 | 4.12 | 3.84 | 17.7% | 7.9% | 9.8% | 53.4% | 26.8% | 27.7% |
Gisbon has been in good form over the last month of play, posting a 3.74 SIERA with a strikeout rate of 21.8%. He’s not a pitcher that I will be trusting in DFS anytime soon, but his form does at least give me pause when it comes to targeting hitters against him. The strikeout potential against the Orioles is there, but so is the downside. On the season, Baltimore is ranked second in both team wOBA (.341) and team ISO (.193) against right-handed pitching.
Batter Grind Down
Baltimore
With these two pitchers on the mound, everyone is expecting a shootout tonight. The Orioles are one of the best offenses in baseball against right-handed pitching and they currently have the second highest run projection on the board. The one concern in this matchup is that has a 52% ground ball rate. However, the Orioles are known as a team that hits ground ball pitchers well. Target them with confidence tonight.
- Orioles Offense (2016)
Team wOBA vs. RHP — 0.341 (2 of 30)
Team ISO vs. RHP — 0.193 (2 of 30)
Team K% vs. RHP — 22.4% (23 of 30)
Pitches Per PA vs. RHP — 3.86 (18 of 30)
Runs Per Game — 4.78 (7 of 30)
Projected Run Total — 4.97 (2 of 18)
Projected Lineup
| # | Player | Bats | wOBA vs. RHP | ISO vs. RHP | wOBA L14 | FD Position | FD Salary | DK Position | DK Salary |
| 1 | | RIGHT | 0.341 | 0.205 | 0.277 | OF | $3,500 | OF | $4,500 |
| 2 | Hyun-Soo Kim | LEFT | 0.395 | 0.128 | 0.306 | OF | $3,000 | OF | $3,800 |
| 3 | | RIGHT | 0.384 | 0.239 | 0.321 | 3B | $3,800 | 3B/SS | $4,400 |
| 4 | | LEFT | 0.385 | 0.309 | 0.196 | 1B | $4,000 | 1B | $4,100 |
| 5 | | RIGHT | 0.348 | 0.212 | 0.239 | OF | $3,900 | OF | $4,700 |
| 6 | | SWITCH | 0.324 | 0.165 | 0.155 | C | $2,500 | C | $3,100 |
| 7 | | RIGHT | 0.365 | 0.236 | 0.276 | 2B | $3,700 | 2B | $4,200 |
| 8 | | LEFT | 0.339 | 0.243 | 0.251 | 3B | $3,200 | 1B | $3,700 |
| 9 | | RIGHT | 0.276 | 0.113 | 0.361 | SS | $2,500 | SS | $3,000 |
| | Team Averages | — | 0.351 | 0.206 | 0.265 | — | — | — | — |
Elite Plays – , ,
Secondary Plays – , Hyun-Soo Kim, ,
Stackability – GREEN
Minnesota
The Twins have the highest implied team total on the board. That’s not something that you hear everyday, so let me say that again. The Twins have the highest implied team total on the board. It kinda has a nice ring to it. You have to love their matchup against , whose ERA is approaching double-digits on the season. In addition to a high walk rate, Jimenez has allowed a .340+ wOBA to both left and right-handed hitters in the last two seasons.
- Twins Offense (2016)
Team wOBA vs. RHP — 0.308 (20 of 30)
Team ISO vs. RHP — 0.155 (19 of 30)
Team K% vs. RHP — 22.2% (22 of 30)
Pitches Per PA vs. RHP — 3.95 (4 of 30)
Runs Per Game — 4.42 (18 of 30)
Projected Run Total — 5.03 (1 of 18)
Projected Lineup
| # | Player | Bats | wOBA vs. RHP | ISO vs. RHP | wOBA L14 | FD Position | FD Salary | DK Position | DK Salary |
| 1 | | RIGHT | 0.331 | 0.122 | 0.169 | SS | $3,700 | 3B/SS | $4,500 |
| 2 | | LEFT | 0.321 | 0.114 | 0.237 | 1B | $3,000 | 1B | $4,400 |
| 3 | | RIGHT | 0.359 | 0.233 | 0.289 | OF | $3,800 | 3B/OF | $4,300 |
| 4 | | RIGHT | 0.315 | 0.193 | 0.329 | 2B | $3,400 | 2B | $4,200 |
| 5 | | LEFT | 0.338 | 0.281 | 0.331 | OF | $3,200 | OF | $4,700 |
| 6 | | SWITCH | 0.276 | 0.153 | 0.289 | 1B | $3,000 | 1B | $4,100 |
| 7 | | LEFT | 0.301 | 0.185 | 0.350 | OF | $2,400 | OF | $4,200 |
| 8 | | RIGHT | 0.280 | 0.093 | 0.320 | C | $2,500 | C | $3,100 |
| 9 | | RIGHT | 0.280 | 0.139 | 0.218 | OF | $2,500 | OF | $3,600 |
| | Team Averages | — | 0.311 | 0.168 | 0.281 | — | — | — | — |
Elite Plays – , ,
Secondary Plays – , , ,
Stackability – GREEN
Want to discuss strategy for today’s games? Head over to the RotoGrinders Forums
Jump to Page 1 2
