MLB Grind Down: Wednesday, June 13th

Jump to Page 1 2 3
The RotoGrinders MLB Grind Down will give you an in-depth analysis into the upcoming MLB schedule. This article will break down the numbers for every single game and give you analysis on which trends you can exploit. While matchups are a major factor in daily fantasy baseball, there are plenty of other factors to consider such as injuries, weather, and salaries.
The analysis should point you in the right direction, but it is still up to you to decipher the information and make your own selections. No sport has more variance than baseball. The best choice is not always the right choice but following the trends will win you money over time.
Note: As always, if you want to try a new DFS site, be sure to click through a RotoGrinders link and use our DraftKings promo code, FanDuel promo code, and FantasyDraft promo code to receive the best perks in the industry.

Stackability Rating System:
GREEN – A viable full stack in cash games and GPPs.
YELLOW – A viable mini-stack in cash games and full stack in GPPs.
ORANGE – A viable stack in large field GPPs.
RED – Not a recommended stack for cash games or GPPs.
Implied Run Totals
Ballpark Ratings
NY Mets at Atlanta – 12:10 PM ET
| NY Mets | Atlanta | ||||||||||||||
 | Jacob deGrom |  | Mike Soroka | ||||||||||||
| RIGHT | RIGHT | ||||||||||||||
| Vegas Moneyline | Vegas Over/Under | ||||||||||||||
| NYM-105 | 8.0 | ||||||||||||||
| Stats | wOBA | xwOBA | HC% | BB% | K% | GB% | Stats | wOBA | xwOBA | HC% | BB% | K% | GB% | ||
|---|---|---|---|---|---|---|---|---|---|---|---|---|---|---|---|
| SP vs. Left (2016-17) | 0.266 | 0.265 | 20.8% | 7.5% | 31.3% | 40.2% | SP vs. Left (2016-17) | 0.258 | 0.348 | 26.1% | 5.7% | 28.6% | 50.0% | ||
| SP vs. Right (2016-17) | 0.208 | 0.229 | 27.8% | 7.0% | 35.4% | 47.2% | SP vs. Right (2016-17) | 0.444 | 0.382 | 25.9% | 5.9% | 14.7% | 37.0% | ||
Pitcher Grind Down
| Jacob deGrom | |||||||||
 | FanDuel | DraftKings | FantasyDraft | ||||||
| Salary: | $10,700 | Salary: | $12,600 | Salary: | |||||
| Salary Rank: | 3 of 30 | Salary Rank: | 3 of 30 | Salary Rank: | |||||
| Stats | Starts | SIERA | ERA | K% | BB% | GB% | HC% | SC% | |
|---|---|---|---|---|---|---|---|---|---|
| 2017 | 31 | 3.44 | 3.53 | 28.9% | 7.1% | 45.3% | 31.9% | 21.3% | |
| 2018 | 13 | 2.78 | 1.57 | 33.3% | 7.2% | 43.6% | 24.2% | 26.3% | |
| L14 | 2 | 2.50 | 1.80 | 35.6% | 6.8% | 42.4% | 23.5% | 29.4% | |
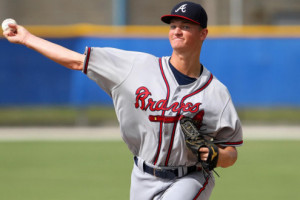
There are technically six early games on the schedule today. FanDuel has divided them up into two three-game slates, while DraftKings has a five-game slate that doesn’t include this game. We start with the Mets and their ace, Jacob deGrom. He’s established himself as one of the best pitchers in baseball, posting a 2.78 SIERA with a strikeout rate of 33% this season. He has good control and he induces soft and medium contact. There isn’t a single weakness in his resume. A matchup against the Braves is far from ideal, but I don’t worry about matchups as much when it comes to elite pitchers.
Quick Breakdown: DeGrom is an elite play in all formats, even on the road against the Braves.
| Mike Soroka | |||||||||
 | FanDuel | DraftKings | FantasyDraft | ||||||
| Salary: | $6,400 | Salary: | $7,400 | Salary: | |||||
| Salary Rank: | 23 of 30 | Salary Rank: | 15 of 30 | Salary Rank: | |||||
| Stats | Starts | SIERA | ERA | K% | BB% | GB% | HC% | SC% | |
|---|---|---|---|---|---|---|---|---|---|
| 2018 | 3 | 3.60 | 3.68 | 21.7% | 5.8% | 42.9% | 26.0% | 16.0% | |
Soroka missed nearly a month with a shoulder injury. He made two rehab starts at the Triple-A level, but will likely still be on a pitch count in today’s outing against the Mets. He is the team’s fourth-ranked prospect and he fared well in his first three major league starts — 3.60 SIERA with a strikeout rate of 22% and a walk rate of 6%. He has a good fastball (mid-90s), a good slider, and a bright future. The issue here is twofold — this is his first major league start since his injury and he’s only included in the all-day slate that features 15 games and 30 different pitching options.
Quick Breakdown: Soroka is a pitcher to keep an eye on moving forward, but he should be avoided against the Mets.
Batter Grind Down
NY Mets
The Mets are facing a rookie pitcher in a ballpark that favors left-handed power. That combination alone brings a few hitters into play for tournaments. Michael Conforto, Brandon Nimmo, Asdrubal Cabrera, and Jay Bruce all bat from the left side of the plate and all have power against right-handed pitching. Mike Soroka is a talented young righty, but he has allowed a .348 xwOBA to lefties in his first three major league starts.
Projected Lineup (Splits vs. RH Pitching)
| # | Player | Bats | xwOBA | L15 | ISO | HC% | BB% | K% | GB% | FD Pos. | FD Sal. | DK Pos. | DK Sal. | FDRFT Pos. | FDRFT Sal. |
|---|---|---|---|---|---|---|---|---|---|---|---|---|---|---|---|
| 1 | Michael Conforto | LEFT | 0.336 | 0.307 | 0.146 | 28.1% | 16.0% | 21.8% | 37.5% | OF | $2,700 | OF | $3,500 | N/A | N/A |
| 2 | Todd Frazier | RIGHT | 0.377 | 0.333 | 0.206 | 44.3% | 13.3% | 23.4% | 32.9% | 3B | $3,300 | 3B | $3,900 | N/A | N/A |
| 3 | Brandon Nimmo | LEFT | 0.441 | 0.400 | 0.343 | 43.0% | 14.4% | 19.7% | 28.2% | OF | $3,200 | OF | $4,000 | N/A | N/A |
| 4 | Asdrubal Cabrera | SWITCH | 0.397 | 0.394 | 0.237 | 47.4% | 5.0% | 20.1% | 36.4% | 2B | $2,900 | 2B | $3,800 | N/A | N/A |
| 5 | Jay Bruce | LEFT | 0.383 | 0.374 | 0.125 | 34.8% | 11.7% | 17.2% | 30.4% | OF | $2,400 | OF | $3,200 | N/A | N/A |
| 6 | Devin Mesoraco | RIGHT | 0.335 | 0.315 | 0.263 | 32.3% | 6.8% | 20.5% | 35.5% | C | $2,400 | C | $3,200 | N/A | N/A |
| 7 | Dominic Smith | LEFT | 0.000 | 0.000 | 0.0% | 0.0% | 100.0% | 0.0% | 1B | $2,000 | 1B | $3,300 | N/A | N/A | |
| 8 | Amed Rosario | RIGHT | 0.278 | 0.227 | 0.092 | 26.5% | 3.7% | 21.5% | 50.4% | SS | $2,100 | SS | $2,800 | N/A | N/A |
| 9 | Jacob deGrom | RIGHT | 0.194 | 0.142 | 0.000 | 0.0% | 5.9% | 41.2% | 37.5% | P | $10,700 | P | $12,600 | N/A | N/A |
| Team Averages | 0.305 | 0.312 | 0.157 | 28.5% | 8.5% | 31.7% | 32.1% |
Elite Plays – None
Secondary Plays – Michael Conforto, Brandon Nimmo, Asdrubal Cabrera, Jay Bruce
Stackability – ORANGE / YELLOW
Atlanta
I’m still kicking myself for not taking my own advice yesterday. I said to play Ozzie Albies, Freddie Freeman, and Nick Markakis against Zack Wheeler and I didn’t end up doing it. I may have missed my opportunity, but I won’t be chasing that loss by going back to the Braves in a matchup against Jacob deGrom. In addition to an elite strikeout rate, deGrom has held both left and right-handed hitters .270 xwOBA and under a 28% hard contact rate.
Projected Lineup (Splits vs. RH Pitching)
| # | Player | Bats | xwOBA | L15 | ISO | HC% | BB% | K% | GB% | FD Pos. | FD Sal. | DK Pos. | DK Sal. | FDRFT Pos. | FDRFT Sal. |
|---|---|---|---|---|---|---|---|---|---|---|---|---|---|---|---|
| 1 | Ozzie Albies | SWITCH | 0.314 | 0.302 | 0.224 | 31.6% | 5.6% | 20.2% | 37.3% | 2B | $4,300 | 2B | $4,300 | N/A | N/A |
| 2 | Dansby Swanson | RIGHT | 0.303 | 0.315 | 0.167 | 31.1% | 6.7% | 27.6% | 45.7% | SS | $3,000 | SS | $3,700 | N/A | N/A |
| 3 | Freddie Freeman | LEFT | 0.457 | 0.419 | 0.208 | 48.1% | 15.7% | 14.1% | 30.1% | 1B | $4,700 | 1B | $4,600 | N/A | N/A |
| 4 | Nick Markakis | LEFT | 0.401 | 0.362 | 0.154 | 37.3% | 10.8% | 6.5% | 43.1% | OF | $3,800 | OF | $3,900 | N/A | N/A |
| 5 | Tyler Flowers | RIGHT | 0.384 | 0.466 | 0.106 | 53.1% | 11.1% | 27.8% | 31.3% | C | $3,100 | C | $3,100 | N/A | N/A |
| 6 | Johan Camargo | SWITCH | 0.372 | 0.342 | 0.198 | 45.3% | 20.2% | 16.3% | 53.1% | 3B | $2,600 | 3B/SS | $3,000 | N/A | N/A |
| 7 | Ender Inciarte | LEFT | 0.280 | 0.244 | 0.119 | 26.1% | 7.4% | 12.9% | 46.2% | OF | $2,700 | OF | $3,600 | N/A | N/A |
| 8 | Charlie Culberson | RIGHT | 0.251 | 0.296 | 0.184 | 39.4% | 5.7% | 30.2% | 53.1% | SS | $2,400 | 3B/OF | $2,700 | N/A | N/A |
| 9 | Mike Soroka | RIGHT | 0.194 | 0.000 | 0.0% | 0.0% | 0.0% | 100.0% | P | $6,400 | P | $7,400 | N/A | N/A | |
| Team Averages | 0.328 | 0.343 | 0.151 | 34.7% | 9.2% | 17.3% | 48.9% |
Elite Plays – None
Secondary Plays – None
Stackability – RED
Toronto at Tampa Bay – 1:10 PM ET
| Toronto | Tampa Bay | ||||||||||||||
 | J.A. Happ |  | Wilmer Font | ||||||||||||
| LEFT | RIGHT | ||||||||||||||
| Vegas Moneyline | Vegas Over/Under | ||||||||||||||
| TBD | |||||||||||||||
| Stats | wOBA | xwOBA | HC% | BB% | K% | GB% | Stats | wOBA | xwOBA | HC% | BB% | K% | GB% | ||
|---|---|---|---|---|---|---|---|---|---|---|---|---|---|---|---|
| SP vs. Left (2016-17) | 0.187 | 0.248 | 21.1% | 3.3% | 33.3% | 57.9% | SP vs. Left (2016-17) | 0.474 | 0.446 | 47.1% | 8.5% | 17.0% | 47.1% | ||
| SP vs. Right (2016-17) | 0.301 | 0.310 | 31.1% | 7.8% | 27.5% | 43.5% | SP vs. Right (2016-17) | 0.411 | 0.315 | 43.4% | 6.9% | 20.6% | 39.6% | ||
Pitcher Grind Down
| J.A. Happ | |||||||||
 | FanDuel | DraftKings | FantasyDraft | ||||||
| Salary: | $9,500 | Salary: | $10,900 | Salary: | |||||
| Salary Rank: | 6 of 30 | Salary Rank: | 6 of 30 | Salary Rank: | |||||
| Stats | Starts | SIERA | ERA | K% | BB% | GB% | HC% | SC% | |
|---|---|---|---|---|---|---|---|---|---|
| 2017 | 25 | 4.11 | 3.53 | 22.7% | 7.4% | 46.9% | 26.7% | 20.3% | |
| 2018 | 13 | 3.25 | 3.71 | 28.6% | 7.0% | 46.2% | 29.2% | 22.1% | |
| L14 | 2 | 4.16 | 3.00 | 23.4% | 8.5% | 37.5% | 31.3% | 21.9% | |
Happ is having one of his best seasons ever, which is a bit strange considering the fact that he is 35 years old. In 13 starts this season, he has a 3.25 SIERA with a strikeout rate of 29%. I ultimately expect that k-rate to come down to around 25% given the fact that his swinging strike rate is just above the major league average. He sees a ballpark bump playing in Tampa Bay and draws one of the best matchups of the early slate. The Rays’ projected lineup has a .294 xwOBA with a 29% strikeout rate against left-handed pitching this season.
Quick Breakdown: Sale is the top ace of the slate, but Happ is arguably number two.
| Wilmer Font | |||||||||
 | FanDuel | DraftKings | FantasyDraft | ||||||
| Salary: | $5,500 | Salary: | $4,000 | Salary: | |||||
| Salary Rank: | 28 of 30 | Salary Rank: | 29 of 30 | Salary Rank: | |||||
| Stats | Starts | SIERA | ERA | K% | BB% | GB% | HC% | SC% | |
|---|---|---|---|---|---|---|---|---|---|
| 2017 | 0 | 6.76 | 17.18 | 13.6% | 18.2% | 26.7% | 53.3% | 26.7% | |
| 2018 | 1 | 4.08 | 9.59 | 19.2% | 7.5% | 42.5% | 44.8% | 12.6% | |
| L14 | 1 | 4.52 | 3.24 | 20.0% | 11.4% | 47.8% | 43.5% | 17.4% | |
Font is making his second “start” of the season, but won’t pitch more than a few innings. This is another bullpen start for the Rays. It was a fun experiment, but it’s starting to get old. Am I the only one that gets frustrated by this? It immediately takes a pitcher out of consideration and it makes predicting fantasy production for the opponent difficult. Even if Font was stretched enough to throw 80+ pitches, he’d still be an easy fade against the Blue Jays.
Quick Breakdown: Avoid Font in both cash games and tournaments.
Batter Grind Down
Toronto
The Blue Jays draw another mediocre matchup against the Rays’ bullpen. On paper, Wilmer Font is an exploitable matchup, but they will likely only face him for two or three innings. The rest will depend on the reliever that ends up in the game at the time of each at-bat. With so many unknowns, it makes sense to target the Blue Jays’ hitters that hit both left and right-handed hitters well. This includes Teoscar Hernandez, Justin Smoak, and potentially Kevin Pillar.
Projected Lineup (Splits vs. RH Pitching)
| # | Player | Bats | xwOBA | L15 | ISO | HC% | BB% | K% | GB% | FD Pos. | FD Sal. | DK Pos. | DK Sal. | FDRFT Pos. | FDRFT Sal. |
|---|---|---|---|---|---|---|---|---|---|---|---|---|---|---|---|
| 1 | Curtis Granderson | LEFT | 0.370 | 0.383 | 0.213 | 39.8% | 15.3% | 29.4% | 32.2% | OF | $3,200 | OF | $4,000 | N/A | N/A |
| 2 | Yangervis Solarte | SWITCH | 0.332 | 0.255 | 0.170 | 28.2% | 7.5% | 16.7% | 42.7% | 3B | $3,600 | 2B/3B | $3,900 | N/A | N/A |
| 3 | Teoscar Hernandez | RIGHT | 0.395 | 0.356 | 0.256 | 36.9% | 4.2% | 21.8% | 36.9% | OF | $4,000 | OF | $4,500 | N/A | N/A |
| 4 | Justin Smoak | SWITCH | 0.394 | 0.358 | 0.235 | 34.8% | 19.3% | 26.5% | 34.8% | 1B | $3,300 | 1B | $3,800 | N/A | N/A |
| 5 | Kevin Pillar | RIGHT | 0.366 | 0.309 | 0.182 | 36.5% | 5.5% | 19.1% | 39.7% | OF | $3,000 | OF | $3,600 | N/A | N/A |
| 6 | Russell Martin | RIGHT | 0.312 | 0.320 | 0.186 | 33.3% | 14.1% | 25.9% | 50.0% | C | $2,300 | C | $2,900 | N/A | N/A |
| 7 | Randal Grichuk | RIGHT | 0.337 | 0.324 | 0.295 | 39.5% | 7.2% | 27.5% | 48.8% | OF | $2,800 | OF | $3,500 | N/A | N/A |
| 8 | Aledmys Diaz | RIGHT | 0.373 | 0.356 | 0.240 | 40.5% | 3.7% | 13.8% | 42.7% | SS | $2,500 | SS | $3,100 | N/A | N/A |
| 9 | Devon Travis | RIGHT | 0.255 | 0.325 | 0.063 | 17.9% | 5.7% | 26.4% | 64.3% | 2B | $2,300 | 2B | $2,800 | N/A | N/A |
| Team Averages | 0.348 | 0.332 | 0.204 | 34.2% | 9.2% | 23.0% | 43.6% |
Elite Plays – None
Secondary Plays – Teoscar Hernandez, Justin Smoak, Kevin Pillar
Stackability – ORANGE / YELLOW
Tampa Bay
The Rays have one of the smallest collections of talent in the majors. They have struggled against left-handed pitching all season and draw a difficult matchup against J.A. Happ. In addition to a high strikeout rate and a low hard contact rate, Happ has held both left and right-handed hitters under a .310 xwOBA this season. Wilson Ramos and C.J. Cron are viable tournament plays, as they both own a .360+ xwOBA against left-handed pitching this season.
Projected Lineup (Splits vs. LH Pitching)
| # | Player | Bats | xwOBA | L15 | ISO | HC% | BB% | K% | GB% | FD Pos. | FD Sal. | DK Pos. | DK Sal. | FDRFT Pos. | FDRFT Sal. |
|---|---|---|---|---|---|---|---|---|---|---|---|---|---|---|---|
| 1 | Matt Duffy | RIGHT | 0.283 | 0.369 | 0.050 | 34.9% | 6.3% | 26.6% | 62.8% | 3B | $2,800 | 3B | $3,400 | N/A | N/A |
| 2 | Jake Bauers | LEFT | 0.235 | 0.375 | 0.125 | 42.9% | 0.0% | 12.5% | 42.9% | 1B | $2,800 | 1B | $3,500 | N/A | N/A |
| 3 | Wilson Ramos | RIGHT | 0.386 | 0.357 | 0.161 | 42.0% | 4.6% | 18.5% | 50.0% | C | $2,600 | C | $3,500 | N/A | N/A |
| 4 | C.J. Cron | RIGHT | 0.364 | 0.432 | 0.260 | 41.2% | 6.2% | 27.2% | 39.2% | 1B | $3,600 | 1B | $4,000 | N/A | N/A |
| 5 | Willy Adames | RIGHT | 0.239 | 0.336 | 0.429 | 66.7% | 0.0% | 57.1% | 0.0% | SS | $2,900 | SS | $3,400 | N/A | N/A |
| 6 | Christian Arroyo | RIGHT | 0.284 | 0.300 | 0.217 | 46.7% | 8.0% | 32.0% | 80.0% | 3B | $2,500 | 2B/3B | $3,200 | N/A | N/A |
| 7 | Carlos Gomez | RIGHT | 0.241 | 0.289 | 0.177 | 22.0% | 1.5% | 31.3% | 19.5% | OF | $2,300 | OF | $3,200 | N/A | N/A |
| 8 | Mallex Smith | LEFT | 0.240 | 0.277 | 0.068 | 21.9% | 4.3% | 27.7% | 58.6% | OF | $2,500 | OF | $3,300 | N/A | N/A |
| 9 | Rob Refsnyder | RIGHT | 0.371 | 0.270 | 0.178 | 45.2% | 19.3% | 24.6% | 45.2% | OF | $2,000 | OF | $2,600 | N/A | N/A |
| Team Averages | 0.294 | 0.334 | 0.185 | 40.4% | 5.6% | 28.6% | 44.2% |
Elite Plays – None
Secondary Plays – Wilson Ramos, C.J. Cron
Stackability – ORANGE
Chicago Cubs at Milwaukee – 2:10 PM ET
| Chicago Cubs | Milwaukee | ||||||||||||||
 | Mike Montgomery |  | Jhoulys Chacin | ||||||||||||
| LEFT | RIGHT | ||||||||||||||
| Vegas Moneyline | Vegas Over/Under | ||||||||||||||
| MIL-105 | 9.0 | ||||||||||||||
| Stats | wOBA | xwOBA | HC% | BB% | K% | GB% | Stats | wOBA | xwOBA | HC% | BB% | K% | GB% | ||
|---|---|---|---|---|---|---|---|---|---|---|---|---|---|---|---|
| SP vs. Left (2016-17) | 0.308 | 0.306 | 24.4% | 5.1% | 17.0% | 77.3% | SP vs. Left (2016-17) | 0.349 | 0.373 | 39.5% | 11.7% | 12.4% | 41.7% | ||
| SP vs. Right (2016-17) | 0.261 | 0.286 | 25.0% | 7.7% | 12.8% | 55.6% | SP vs. Right (2016-17) | 0.238 | 0.287 | 40.2% | 7.1% | 23.9% | 35.6% | ||
Pitcher Grind Down
| Mike Montgomery | |||||||||
 | FanDuel | DraftKings | FantasyDraft | ||||||
| Salary: | $6,900 | Salary: | $6,800 | Salary: | |||||
| Salary Rank: | 19 of 30 | Salary Rank: | 19 of 30 | Salary Rank: | |||||
| Stats | Starts | SIERA | ERA | K% | BB% | GB% | HC% | SC% | |
|---|---|---|---|---|---|---|---|---|---|
| 2017 | 14 | 4.46 | 3.38 | 18.5% | 10.2% | 57.8% | 30.2% | 20.7% | |
| 2018 | 3 | 4.05 | 3.56 | 14.2% | 6.8% | 62.7% | 24.8% | 28.5% | |
| L14 | 2 | 4.12 | 1.50 | 10.4% | 4.2% | 65.0% | 30.0% | 15.0% | |
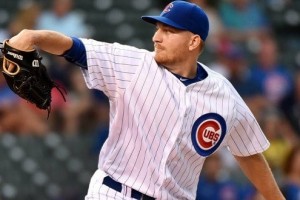
Montgomery has only allowed two combined earned runs in his last three starts. While he’s been effective, the signs don’t suggest that he’s going to have this much success moving forward, especially when it comes to fantasy production. His SIERA is higher than his ERA and his strikeout rate of 15% is well below the major league average. His biggest strength is his ability to induce ground balls and soft contact, which makes him a better real life pitcher than daily fantasy pitcher.
Quick Breakdown: Given Montgomery’s lack of strikeout upside, he can be avoided against the Brewers.
| Jhoulys Chacin | |||||||||
 | FanDuel | DraftKings | FantasyDraft | ||||||
| Salary: | $7,200 | Salary: | $5,900 | Salary: | |||||
| Salary Rank: | 17 of 30 | Salary Rank: | 23 of 30 | Salary Rank: | |||||
| Stats | Starts | SIERA | ERA | K% | BB% | GB% | HC% | SC% | |
|---|---|---|---|---|---|---|---|---|---|
| 2017 | 32 | 4.63 | 3.89 | 20.0% | 9.4% | 49.1% | 28.5% | 20.2% | |
| 2018 | 14 | 4.81 | 3.58 | 18.0% | 9.5% | 38.8% | 39.8% | 17.7% | |
| L14 | 2 | 3.56 | 3.00 | 25.5% | 4.3% | 29.0% | 34.4% | 9.4% | |
Chacin has pitched well in his last three starts, but he needs the following criteria to deserve consideration in DFS:
— he needs to be facing a right-handed heavy lineup
— he needs to be pitching in a pitcher-friendly ballpark
I hate to break it to him, but he doesn’t meet either criteria today against the Cubs. If you include the pitcher, Chicago has six lefties in their projected lineup. Miller Park clearly doesn’t grade out as a pitcher’s park, which gives Chacin more risk than upside.
Quick Breakdown: Avoid Chacin in all formats.
Batter Grind Down
Chicago Cubs
The Cubs’ matchup against Jhoulys Chacin is one of the easiest of the slate to break down. Throughout his career, he has been tough on right-handed hitters and that has been the case against this season (.287 xwOBA allowed with a 24% strikeout rate). Lefties are a completely different story though, as he has allowed a .373 xwOBA, a 40% hard contact rate, and only a 12% strikeout rate. Jason Heyward, Ben Zobrist, Anthony Rizzo, and Kyle Schwarber are the top target here, but I wouldn’t rule out a complete stack with Kris Bryant and Willson Contreras.
Projected Lineup (Splits vs. RH Pitching)
| # | Player | Bats | xwOBA | L15 | ISO | HC% | BB% | K% | GB% | FD Pos. | FD Sal. | DK Pos. | DK Sal. | FDRFT Pos. | FDRFT Sal. |
|---|---|---|---|---|---|---|---|---|---|---|---|---|---|---|---|
| 1 | Kris Bryant | RIGHT | 0.363 | 0.246 | 0.133 | 30.9% | 12.0% | 19.4% | 36.7% | 3B | $4,300 | 3B | $4,700 | N/A | N/A |
| 2 | Jason Heyward | LEFT | 0.372 | 0.365 | 0.153 | 33.3% | 8.2% | 8.8% | 36.7% | OF | $3,100 | OF | $3,700 | N/A | N/A |
| 3 | Ben Zobrist | SWITCH | 0.360 | 0.331 | 0.158 | 30.4% | 14.3% | 12.9% | 44.1% | 2B | $3,000 | 2B/OF | $4,200 | N/A | N/A |
| 4 | Anthony Rizzo | LEFT | 0.404 | 0.469 | 0.220 | 35.2% | 11.0% | 9.9% | 33.1% | 1B | $4,600 | 1B | $4,900 | N/A | N/A |
| 5 | Willson Contreras | RIGHT | 0.327 | 0.297 | 0.174 | 29.0% | 8.1% | 17.3% | 47.7% | C | $3,100 | C | $3,800 | N/A | N/A |
| 6 | Kyle Schwarber | LEFT | 0.379 | 0.361 | 0.277 | 40.6% | 16.7% | 24.4% | 47.1% | OF | $3,600 | OF | $4,100 | N/A | N/A |
| 7 | Ian Happ | SWITCH | 0.337 | 0.331 | 0.234 | 36.2% | 17.2% | 39.6% | 29.3% | OF | $2,700 | OF | $3,600 | N/A | N/A |
| 8 | Addison Russell | RIGHT | 0.270 | 0.255 | 0.056 | 32.4% | 9.3% | 24.2% | 38.8% | SS | $2,700 | SS | $3,000 | N/A | N/A |
| 9 | Mike Montgomery | LEFT | 0.271 | 0.380 | 0.000 | 33.3% | 12.5% | 50.0% | 50.0% | P | $6,900 | P | $6,800 | N/A | N/A |
| Team Averages | 0.343 | 0.337 | 0.156 | 33.5% | 12.1% | 22.9% | 40.4% |
Elite Plays – Jason Heyward, Ben Zobrist, Anthony Rizzo, Kyle Schwarber
Secondary Plays – Kris Bryant, Willson Contreras (DK)
Stackability – YELLOW / GREEN
Milwaukee
Mike Montgomery doesn’t quite have the strikeout upside that we are looking for in a pitcher, but his high ground ball rate makes him a tough pitcher to target hitters against. He is one of the few starters in baseball with a higher soft contact rate than hard contact rate. On the season, he has held both left and right-handed hitters under a .310 xwOBA and under a 25% hard contact rate. Lorenzo Cain, Ryan Braun, and Jesus Aguilar all hit southpaws well, but are secondary plays at their respective positions.
Projected Lineup (Splits vs. LH Pitching)
| # | Player | Bats | xwOBA | L15 | ISO | HC% | BB% | K% | GB% | FD Pos. | FD Sal. | DK Pos. | DK Sal. | FDRFT Pos. | FDRFT Sal. |
|---|---|---|---|---|---|---|---|---|---|---|---|---|---|---|---|
| 1 | Lorenzo Cain | RIGHT | 0.411 | 0.278 | 0.250 | 36.4% | 15.8% | 7.0% | 29.5% | OF | $3,700 | OF | $4,400 | N/A | N/A |
| 2 | Christian Yelich | LEFT | 0.342 | 0.432 | 0.131 | 39.6% | 7.4% | 20.6% | 57.4% | OF | $4,100 | OF | $5,100 | N/A | N/A |
| 3 | Ryan Braun | RIGHT | 0.444 | 0.455 | 0.267 | 43.9% | 16.4% | 9.1% | 48.8% | OF | $3,600 | 1B/OF | $4,800 | N/A | N/A |
| 4 | Jesus Aguilar | RIGHT | 0.396 | 0.289 | 0.333 | 44.8% | 13.0% | 21.7% | 27.6% | 1B | $3,100 | 1B | $4,200 | N/A | N/A |
| 5 | Travis Shaw | LEFT | 0.216 | 0.316 | 0.052 | 23.4% | 7.8% | 18.8% | 53.3% | 3B | $3,500 | 3B | $4,300 | N/A | N/A |
| 6 | Hernan Perez | RIGHT | 0.317 | 0.322 | 0.195 | 45.5% | 0.0% | 21.4% | 36.4% | OF | $2,300 | 2B/OF | $3,000 | N/A | N/A |
| 7 | Manny Pina | RIGHT | 0.368 | 0.306 | 0.160 | 36.4% | 16.7% | 10.0% | 50.0% | C | $2,000 | C | $2,800 | N/A | N/A |
| 8 | Orlando Arcia | RIGHT | 0.194 | 0.207 | 0.027 | 26.7% | 5.1% | 17.9% | 63.3% | SS | $2,100 | SS | $2,800 | N/A | N/A |
| 9 | Jhoulys Chacin | RIGHT | 0.664 | 0.203 | 0.000 | 66.7% | 0.0% | 0.0% | 50.0% | P | $7,200 | P | $5,900 | N/A | N/A |
| Team Averages | 0.372 | 0.312 | 0.157 | 40.4% | 9.1% | 14.1% | 46.3% |
Elite Plays – None
Secondary Plays – Lorenzo Cain, Ryan Braun, Jesus Aguilar
Stackability – ORANGE / YELLOW
Boston at Baltimore – 3:05 PM ET
| Boston | Baltimore | ||||||||||||||
 | Chris Sale |  | Yefry Ramirez | ||||||||||||
| LEFT | RIGHT | ||||||||||||||
| Vegas Moneyline | Vegas Over/Under | ||||||||||||||
| BOS-205 | 8.0 | ||||||||||||||
| Stats | wOBA | xwOBA | HC% | BB% | K% | GB% | Stats | wOBA | xwOBA | HC% | BB% | K% | GB% | ||
|---|---|---|---|---|---|---|---|---|---|---|---|---|---|---|---|
| SP vs. Left (2016-17) | 0.256 | 0.245 | 26.7% | 3.8% | 35.9% | 46.4% | SP vs. Left (2016-17) | ||||||||
| SP vs. Right (2016-17) | 0.265 | 0.268 | 25.6% | 6.6% | 33.6% | 41.4% | SP vs. Right (2016-17) | ||||||||
Pitcher Grind Down
| Chris Sale | |||||||||
 | FanDuel | DraftKings | FantasyDraft | ||||||
| Salary: | $11,300 | Salary: | $13,500 | Salary: | |||||
| Salary Rank: | 2 of 30 | Salary Rank: | 1 of 30 | Salary Rank: | |||||
| Stats | Starts | SIERA | ERA | K% | BB% | GB% | HC% | SC% | |
|---|---|---|---|---|---|---|---|---|---|
| 2017 | 32 | 2.58 | 2.90 | 36.2% | 5.1% | 38.7% | 29.7% | 18.5% | |
| 2018 | 14 | 2.66 | 2.83 | 33.9% | 6.2% | 42.1% | 25.7% | 29.1% | |
| L14 | 2 | 2.69 | 3.21 | 29.1% | 3.6% | 52.8% | 16.2% | 32.4% | |
Sale is clearly the top pitching option of the early slate. Jacob deGrom isn’t featured in this slate and there aren’t any other pitchers with as high of a floor or ceiling as Sale. In his 14 starts this season, he has a 2.66 SIERA with a strikeout rate of 34%. He has great control and for the first time in a long time, his soft contact rate is higher than his hard contact rate. The Orioles aren’t a matchup that we should be afraid of, as their projected lineup has a .317 xwOBA against southpaws this season.
Quick Breakdown: Sale is the ace of the early slate and an elite play in all formats.
| Yefry Ramirez | |||||||||
 | FanDuel | DraftKings | FantasyDraft | ||||||
| Salary: | $5,500 | Salary: | Salary: | ||||||
| Salary Rank: | 28 of 30 | Salary Rank: | of 30 | Salary Rank: | |||||
| Stats | Starts | SIERA | ERA | K% | BB% | GB% | HC% | SC% | |
|---|---|---|---|---|---|---|---|---|---|
Ramirez is making his major league debut today against the Red Sox. He’s not considered a top prospect, but he’s shown some upside in the minors this season, posting a 3.46 FIP with a strikeout rate of 25% in 12 Triple-A starts. I typically like to lean on the betting markets in these pitching debuts and Ramirez comes into the game as a massive underdog. Obviously, a lot of that has to do with Chris Sale pitching opposite him, but it doesn’t hurt to take a wait and see approach here. The Red Sox projected lineup has a .385 xwOBA against right-handed pitching this season.
Quick Breakdown: No need to rush with Ramirez. Let’s watch this one from the sidelines.
Batter Grind Down
Boston
The Red Sox draw a boom or bust matchup against Yefry Ramirez. While he has pitched well at the Triple-A level this season, that doesn’t mean that it’s going to transfer to the major league level. He’s not a top pitching prospect and the Red Sox get to face him in the hitter-friendly Camden Yards. Rather than avoiding both sides in this pitching debut, I will be loading up on the Red Sox offense, especially in tournaments. Mookie Betts, Andrew Benintendi, J.D. Martinez, and Mitch Moreland all have an xwOBA of at least .400 against right-handed pitching this season.
Projected Lineup (Splits vs. RH Pitching)
| # | Player | Bats | xwOBA | L15 | ISO | HC% | BB% | K% | GB% | FD Pos. | FD Sal. | DK Pos. | DK Sal. | FDRFT Pos. | FDRFT Sal. |
|---|---|---|---|---|---|---|---|---|---|---|---|---|---|---|---|
| 1 | Mookie Betts | RIGHT | 0.513 | 0.396 | 0.352 | 48.8% | 11.5% | 13.3% | 31.4% | OF | $5,000 | OF | $5,900 | N/A | N/A |
| 2 | Andrew Benintendi | LEFT | 0.400 | 0.486 | 0.254 | 27.9% | 13.1% | 12.6% | 34.5% | OF | $4,900 | OF | $5,600 | N/A | N/A |
| 3 | J.D. Martinez | RIGHT | 0.480 | 0.484 | 0.385 | 52.5% | 10.0% | 21.8% | 44.8% | OF | $4,800 | OF | $5,500 | N/A | N/A |
| 4 | Mitch Moreland | LEFT | 0.467 | 0.370 | 0.315 | 40.0% | 10.7% | 17.9% | 40.0% | 1B | $3,900 | 1B | $4,600 | N/A | N/A |
| 5 | Xander Bogaerts | RIGHT | 0.371 | 0.335 | 0.245 | 37.5% | 4.1% | 18.7% | 44.9% | SS | $4,300 | SS | $4,900 | N/A | N/A |
| 6 | Rafael Devers | LEFT | 0.333 | 0.227 | 0.175 | 38.9% | 8.4% | 26.7% | 43.8% | 3B | $3,400 | 3B | $3,600 | N/A | N/A |
| 7 | Eduardo Nunez | RIGHT | 0.267 | 0.253 | 0.139 | 27.2% | 1.7% | 18.5% | 50.0% | 2B | $2,900 | 2B/SS | $3,600 | N/A | N/A |
| 8 | Jackie Bradley | LEFT | 0.334 | 0.384 | 0.122 | 34.7% | 10.4% | 24.5% | 44.6% | OF | $2,800 | OF | $3,200 | N/A | N/A |
| 9 | Sandy Leon | SWITCH | 0.302 | 0.305 | 0.156 | 31.1% | 3.0% | 26.9% | 42.2% | C | $2,100 | C | $3,000 | N/A | N/A |
| Team Averages | 0.385 | 0.360 | 0.238 | 37.6% | 8.1% | 20.1% | 41.8% |
Elite Plays – Mookie Betts, Andrew Benintendi, J.D. Martinez, Mitch Moreland
Secondary Plays – Xander Bogaerts, Rafael Devers
Stackability – YELLOW / GREEN
Baltimore
The Orioles have the worst matchup of the slate and one of the worst matchups in all of baseball. Chris Sale has an elite strikeout rate, he induces more soft contact than hard contact, and he has held both left and right-handed hitters under a .270 xwOBA this season. Unless you are playing in the new lowball format on DraftKings, the Orioles should be avoided in both cash games and tournaments.
Projected Lineup (Splits vs. LH Pitching)
| # | Player | Bats | xwOBA | L15 | ISO | HC% | BB% | K% | GB% | FD Pos. | FD Sal. | DK Pos. | DK Sal. | FDRFT Pos. | FDRFT Sal. |
|---|---|---|---|---|---|---|---|---|---|---|---|---|---|---|---|
| 1 | Joey Rickard | RIGHT | 0.227 | 0.281 | 0.088 | 20.8% | 5.6% | 27.8% | 33.3% | OF | $2,200 | OF | $2,700 | N/A | N/A |
| 2 | Adam Jones | RIGHT | 0.342 | 0.329 | 0.068 | 31.3% | 2.6% | 10.4% | 38.8% | OF | $3,000 | OF | $3,400 | N/A | N/A |
| 3 | Manny Machado | RIGHT | 0.412 | 0.284 | 0.299 | 36.9% | 9.2% | 5.3% | 32.3% | SS | $4,400 | SS | $4,700 | N/A | N/A |
| 4 | Danny Valencia | RIGHT | 0.430 | 0.398 | 0.194 | 31.5% | 12.5% | 12.5% | 44.4% | 3B | $2,900 | 3B | $3,300 | N/A | N/A |
| 5 | Trey Mancini | RIGHT | 0.321 | 0.298 | 0.163 | 30.0% | 8.0% | 22.7% | 66.7% | OF | $2,700 | 1B/OF | $3,100 | N/A | N/A |
| 6 | Jonathan Schoop | RIGHT | 0.293 | 0.202 | 0.059 | 27.9% | 8.8% | 14.0% | 37.2% | 2B | $3,000 | 2B | $3,200 | N/A | N/A |
| 7 | Mark Trumbo | RIGHT | 0.280 | 0.266 | 0.108 | 36.0% | 5.1% | 30.8% | 56.0% | OF | $2,400 | OF | $3,400 | N/A | N/A |
| 8 | Craig Gentry | RIGHT | 0.249 | 0.265 | 0.059 | 24.3% | 7.3% | 25.5% | 51.4% | OF | $2,100 | OF | $2,500 | N/A | N/A |
| 9 | Austin Wynns | RIGHT | 0.297 | 0.240 | 0.000 | 0.0% | 0.0% | 16.7% | 40.0% | C | $2,200 | C | $2,400 | N/A | N/A |
| Team Averages | 0.317 | 0.285 | 0.115 | 26.5% | 6.6% | 18.4% | 44.5% |
Elite Plays – None
Secondary Plays – None
Stackability – RED
Pittsburgh at Arizona – 3:40 PM ET
| Pittsburgh | Arizona | ||||||||||||||
 | Jameson Taillon |  | Zack Greinke | ||||||||||||
| RIGHT | RIGHT | ||||||||||||||
| Vegas Moneyline | Vegas Over/Under | ||||||||||||||
| ARI-142 | 7.5 | ||||||||||||||
| Stats | wOBA | xwOBA | HC% | BB% | K% | GB% | Stats | wOBA | xwOBA | HC% | BB% | K% | GB% | ||
|---|---|---|---|---|---|---|---|---|---|---|---|---|---|---|---|
| SP vs. Left (2016-17) | 0.363 | 0.328 | 33.0% | 11.8% | 18.1% | 46.3% | SP vs. Left (2016-17) | 0.311 | 0.339 | 43.2% | 4.4% | 23.7% | 44.2% | ||
| SP vs. Right (2016-17) | 0.231 | 0.236 | 23.6% | 1.3% | 27.2% | 55.7% | SP vs. Right (2016-17) | 0.299 | 0.322 | 46.1% | 3.8% | 27.4% | 39.8% | ||
Pitcher Grind Down
| Jameson Taillon | |||||||||
 | FanDuel | DraftKings | FantasyDraft | ||||||
| Salary: | $7,500 | Salary: | $7,600 | Salary: | |||||
| Salary Rank: | 15 of 30 | Salary Rank: | 13 of 30 | Salary Rank: | |||||
| Stats | Starts | SIERA | ERA | K% | BB% | GB% | HC% | SC% | |
|---|---|---|---|---|---|---|---|---|---|
| 2017 | 25 | 4.24 | 4.44 | 21.3% | 7.8% | 47.3% | 29.6% | 22.1% | |
| 2018 | 13 | 3.67 | 4.08 | 22.7% | 6.4% | 51.2% | 28.2% | 24.3% | |
| L14 | 2 | 2.95 | 2.08 | 25.5% | 3.9% | 58.8% | 33.3% | 27.8% | |
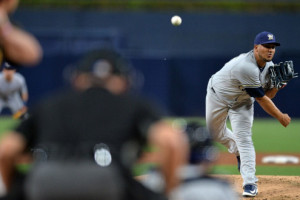
Taillon has had some bad luck to start the season, but that seems to be turning around. His ERA is still higher than his SIERA, but they are a lot closer than they were three weeks ago. Overall, he owns a 3.67 SIERA with a strikeout rate of 23% and a ground ball rate of 51%. That’s a great combination for any pitcher and it allows him to pitch well in any ballpark. The only knock on Taillon is his matchup against the Diamondbacks in Arizona. The roof will be closed once again, but this offense has been on a tear over the last two weeks.
Quick Breakdown: I like the price point for Taillon, but he’s not an auto-play against a red-hot D-Backs offense.
| Zack Greinke | |||||||||
 | FanDuel | DraftKings | FantasyDraft | ||||||
| Salary: | $9,200 | Salary: | $9,300 | Salary: | |||||
| Salary Rank: | 7 of 30 | Salary Rank: | 8 of 30 | Salary Rank: | |||||
| Stats | Starts | SIERA | ERA | K% | BB% | GB% | HC% | SC% | |
|---|---|---|---|---|---|---|---|---|---|
| 2017 | 32 | 3.48 | 3.20 | 26.8% | 5.6% | 46.8% | 35.1% | 19.2% | |
| 2018 | 13 | 3.24 | 3.53 | 25.9% | 4.1% | 41.7% | 44.8% | 15.7% | |
| L14 | 2 | 3.99 | 2.92 | 20.0% | 5.5% | 41.5% | 48.8% | 7.3% | |
Greinke gives up a lot of hard contact each season, but he never lets that stop him from being a great pitcher. In 13 starts, he has a 3.24 SIERA with a strikeout rate of 26% and a walk rate of 4%. The Pirates are missing a couple of their best hitters, which gives Greinke a significant boost. Pittsburgh’s projected lineup has a .301 xwOBA with a strikeout rate of 20% against right-handed pitching this season. At this price point, Greinke deserves consideration as an SP2 in all formats.
Quick Breakdown: Even though the Pirates have been tough offensively, I’ll take my chances with Greinke at this price point.
Batter Grind Down
Pittsburgh
The Pirates see a small ballpark bump playing in Arizona, but this park is at its best for hitters when the roof is open (it will be closed today). They are missing a couple of key pieces in their lineup and they draw a difficult matchup against Zack Greinke. In addition to having an above-average strikeout rate, Greinke has held right-handed hitters to a .322 xwOBA. His struggle has been against lefties, allowing a .339 xwOBA and a 43% hard contact rate.
Projected Lineup (Splits vs. RH Pitching)
| # | Player | Bats | xwOBA | L15 | ISO | HC% | BB% | K% | GB% | FD Pos. | FD Sal. | DK Pos. | DK Sal. | FDRFT Pos. | FDRFT Sal. |
|---|---|---|---|---|---|---|---|---|---|---|---|---|---|---|---|
| 1 | Josh Harrison | RIGHT | 0.307 | 0.344 | 0.115 | 35.2% | 6.0% | 15.5% | 35.6% | 2B | $3,100 | 2B | $3,900 | N/A | N/A |
| 2 | Austin Meadows | LEFT | 0.336 | 0.332 | 0.192 | 40.0% | 1.9% | 14.8% | 35.6% | OF | $3,200 | OF | $4,400 | N/A | N/A |
| 3 | Corey Dickerson | LEFT | 0.338 | 0.257 | 0.173 | 31.5% | 4.7% | 9.9% | 30.4% | OF | $2,900 | OF | $3,900 | N/A | N/A |
| 4 | Colin Moran | LEFT | 0.365 | 0.338 | 0.153 | 32.1% | 8.5% | 15.8% | 39.7% | 3B | $2,300 | 3B | $3,200 | N/A | N/A |
| 5 | Elias Diaz | RIGHT | 0.322 | 0.436 | 0.140 | 24.0% | 6.5% | 12.9% | 50.0% | C | $2,400 | C | $3,300 | N/A | N/A |
| 6 | Josh Bell | SWITCH | 0.326 | 0.287 | 0.131 | 31.9% | 11.0% | 18.5% | 51.4% | 1B | $2,800 | 1B | $3,300 | N/A | N/A |
| 7 | Gregory Polanco | LEFT | 0.359 | 0.312 | 0.218 | 37.0% | 12.3% | 21.5% | 33.1% | OF | $3,100 | OF | $3,600 | N/A | N/A |
| 8 | Sean Rodriguez | RIGHT | 0.217 | 0.186 | 0.085 | 23.3% | 12.2% | 34.1% | 34.9% | 2B | $2,000 | OF/SS | $2,600 | N/A | N/A |
| 9 | Jameson Taillon | RIGHT | 0.143 | 0.063 | 0.056 | 25.0% | 0.0% | 36.8% | 72.7% | P | $7,500 | P | $7,600 | N/A | N/A |
| Team Averages | 0.301 | 0.284 | 0.140 | 31.1% | 7.0% | 20.0% | 42.6% |
Elite Plays – None
Secondary Plays – Austin Meadows, Colin Moran
Stackability – ORANGE
Arizona
The Diamondbacks have channeled their inner “NBA Jam Mode” over the last two weeks. They have been on fire. The lineup below has an average xwOBA of .392 over the last 15 days. While that’s a positive, their matchup against Jameson Taillon is far from perfect. He has above-average ground ball and strikeout rates and has held right-handed hitters to a .236 xwOBA with a 24% hard contact rate. The lefties in this lineup are viable but are secondary plays at their respective positions.
Projected Lineup (Splits vs. RH Pitching)
| # | Player | Bats | xwOBA | L15 | ISO | HC% | BB% | K% | GB% | FD Pos. | FD Sal. | DK Pos. | DK Sal. | FDRFT Pos. | FDRFT Sal. |
|---|---|---|---|---|---|---|---|---|---|---|---|---|---|---|---|
| 1 | Jon Jay | LEFT | 0.334 | 0.322 | 0.088 | 37.7% | 5.9% | 13.8% | 53.9% | OF | $3,000 | OF | $3,400 | N/A | N/A |
| 2 | Paul Goldschmidt | RIGHT | 0.342 | 0.547 | 0.182 | 43.5% | 12.6% | 31.2% | 41.7% | 1B | $4,500 | 1B | $5,400 | N/A | N/A |
| 3 | Jake Lamb | LEFT | 0.399 | 0.394 | 0.224 | 47.1% | 11.4% | 22.8% | 47.1% | 3B | $3,400 | 3B | $4,400 | N/A | N/A |
| 4 | Daniel Descalso | LEFT | 0.378 | 0.461 | 0.252 | 42.1% | 16.0% | 22.4% | 30.5% | 2B | $3,100 | 2B/3B | $3,800 | N/A | N/A |
| 5 | David Peralta | LEFT | 0.376 | 0.378 | 0.237 | 53.2% | 8.8% | 18.7% | 48.0% | OF | $3,000 | OF | $4,400 | N/A | N/A |
| 6 | Jarrod Dyson | LEFT | 0.296 | 0.357 | 0.079 | 20.6% | 11.5% | 10.0% | 41.1% | OF | $2,400 | OF | $3,000 | N/A | N/A |
| 7 | Nick Ahmed | RIGHT | 0.304 | 0.359 | 0.161 | 32.7% | 7.3% | 23.3% | 34.3% | SS | $2,900 | SS | $3,400 | N/A | N/A |
| 8 | Jeff Mathis | RIGHT | 0.233 | 0.301 | 0.000 | 24.1% | 12.0% | 30.0% | 39.3% | C | $2,000 | C | $2,600 | N/A | N/A |
| 9 | Zack Greinke | RIGHT | 0.325 | 0.405 | 0.111 | 33.3% | 9.1% | 22.7% | 30.8% | P | $9,200 | P | $9,300 | N/A | N/A |
| Team Averages | 0.332 | 0.392 | 0.148 | 37.1% | 10.5% | 21.7% | 40.7% |
Elite Plays – None
Secondary Plays – Jon Jay, Jake Lamb, Daniel Descalso, David Peralta
Stackability – ORANGE / YELLOW
Note: Unless noted, all statistics in the Grind Down are from the 2018 season.