MLB Grind Down: Tuesday, June 26th

Jump to Page 1 2 3
The RotoGrinders MLB Grind Down will give you an in-depth analysis into the upcoming MLB schedule. This article will break down the numbers for every single game and give you analysis on which trends you can exploit. While matchups are a major factor in daily fantasy baseball, there are plenty of other factors to consider such as injuries, weather, and salaries.
The analysis should point you in the right direction, but it is still up to you to decipher the information and make your own selections. No sport has more variance than baseball. The best choice is not always the right choice but following the trends will win you money over time.
Note: As always, if you want to try a new DFS site, be sure to click through a RotoGrinders link and use our DraftKings promo code, FanDuel promo code, and FantasyDraft promo code to receive the best perks in the industry.

Stackability Rating System:
GREEN – A viable full stack in cash games and GPPs.
YELLOW – A viable mini-stack in cash games and full stack in GPPs.
ORANGE – A viable stack in large field GPPs.
RED – Not a recommended stack for cash games or GPPs.
Implied Run Totals
Ballpark Ratings
NY Yankees at Philadelphia – 7:05 PM ET
| NY Yankees | Philadelphia | ||||||||||||||
 | Luis Severino |  | Jake Arrieta | ||||||||||||
| RIGHT | RIGHT | ||||||||||||||
| Vegas Moneyline | Vegas Over/Under | ||||||||||||||
| NYY-205 | 7.5 | ||||||||||||||
| Stats | wOBA | xwOBA | HC% | BB% | K% | GB% | Stats | wOBA | xwOBA | HC% | BB% | K% | GB% | ||
|---|---|---|---|---|---|---|---|---|---|---|---|---|---|---|---|
| SP vs. Left (2016-17) | 0.252 | 0.297 | 35.2% | 9.6% | 33.8% | 43.7% | SP vs. Left (2016-17) | 0.297 | 0.320 | 26.3% | 10.8% | 17.3% | 54.1% | ||
| SP vs. Right (2016-17) | 0.240 | 0.285 | 30.4% | 4.4% | 27.9% | 45.5% | SP vs. Right (2016-17) | 0.295 | 0.295 | 28.2% | 5.9% | 16.0% | 56.7% | ||
Pitcher Grind Down
| Luis Severino | |||||||||
 | FanDuel | DraftKings | FantasyDraft | ||||||
| Salary: | $10,600 | Salary: | $13,100 | Salary: | $24,100 | ||||
| Salary Rank: | 3 of 30 | Salary Rank: | 1 of 30 | Salary Rank: | 3 of 30 | ||||
| Stats | Starts | SIERA | ERA | K% | BB% | GB% | HC% | SC% | |
|---|---|---|---|---|---|---|---|---|---|
| 2017 | 31 | 3.25 | 2.98 | 29.4% | 6.5% | 50.6% | 28.5% | 19.4% | |
| 2018 | 16 | 3.01 | 2.24 | 30.2% | 6.4% | 44.9% | 32.0% | 22.7% | |
| L14 | 3 | 3.29 | 2.41 | 28.4% | 6.8% | 39.1% | 27.7% | 25.5% | |
There are 14 games on the schedule tonight. We kick off the slate with the Yankees and Phillies. While the game is being played under National League rules, this is one of the most home run-friendly ballparks in all of baseball. That’s a concern for most pitchers, but not for Severino. He is quickly becoming part of the elite of the elites. In 16 starts this season, he has a 3.01 SIERA with a strikeout rate of 30% and a walk rate of 6%. He keeps the ball on the ground and induces a lot of soft contact. His matchup against the Phillies is the icing on the cake — their projected lineup has a 27% strikeout rate against right-handed pitching this season.
Quick Breakdown: Severino is not only an elite play, but he’s right there with Corey Kluber as the number one pitching option of the slate.
| Jake Arrieta | |||||||||
 | FanDuel | DraftKings | FantasyDraft | ||||||
| Salary: | $7,300 | Salary: | $6,800 | Salary: | $14,000 | ||||
| Salary Rank: | 16 of 30 | Salary Rank: | 19 of 30 | Salary Rank: | 12 of 30 | ||||
| Stats | Starts | SIERA | ERA | K% | BB% | GB% | HC% | SC% | |
|---|---|---|---|---|---|---|---|---|---|
| 2017 | 30 | 4.15 | 3.53 | 23.1% | 7.8% | 45.1% | 29.4% | 20.0% | |
| 2018 | 14 | 4.36 | 3.42 | 16.6% | 8.0% | 55.6% | 27.4% | 19.5% | |
| L14 | 2 | 5.04 | 6.75 | 13.3% | 8.9% | 50.0% | 47.1% | 8.8% | |
Arrieta is not the type of pitcher that I like to target in DFS. He has a low strikeout rate and relies on run prevention for most of his fantasy production. I would much rather target a pitcher that can afford to make a few mistakes thanks to a higher k-rate. In his 14 starts this season, Arrieta has a 4.36 SIERA with a strikeout rate of 17%. His ground ball and hard contact rates are encouraging, but not enough to warrant consideration in a matchup against the Yankees. New York is currently ranked second in wOBA and first in ISO against right-handed pitching on the season.
Quick Breakdown: Avoid Arrieta in both cash games and tournaments.
Batter Grind Down
NY Yankees
The Yankees don’t get to use the DH in this series, but they are playing in a hitter-friendly ballpark and facing a low-strikeout pitcher. As I often mention, the best way to beak this team is with a high-strikeout pitcher. When they put the ball in play, good things tend to happen. As far as splits are concerned, Jake Arrieta has allowed a .320 xwOBA to lefties and a .295 xwOBA to righties. The Yankees aren’t my favorite stack of the slate, but Aaron Judge, Didi Gregorius, Miguel Andujar all boast a .355+ xwOBA against right-handed pitching.
Projected Lineup (Splits vs. RH Pitching)
| # | Player | Bats | xwOBA | L15 | ISO | HC% | BB% | K% | GB% | FD Pos. | FD Sal. | DK Pos. | DK Sal. | FDRFT Pos. | FDRFT Sal. |
|---|---|---|---|---|---|---|---|---|---|---|---|---|---|---|---|
| 1 | Brett Gardner | LEFT | 0.310 | 0.286 | 0.157 | 31.8% | 11.9% | 16.4% | 49.3% | OF | $3,100 | OF | $3,900 | LF | $7,200 |
| 2 | Aaron Judge | RIGHT | 0.409 | 0.408 | 0.301 | 48.8% | 14.9% | 29.8% | 46.5% | OF | $4,600 | OF | $5,400 | RF | $10,000 |
| 3 | Didi Gregorius | LEFT | 0.356 | 0.339 | 0.258 | 41.2% | 9.7% | 13.4% | 32.9% | SS | $3,900 | SS | $4,700 | SS | $8,100 |
| 4 | Giancarlo Stanton | RIGHT | 0.298 | 0.336 | 0.171 | 34.1% | 8.4% | 33.6% | 53.8% | OF | $4,500 | OF | $5,100 | RF | $10,000 |
| 5 | Greg Bird | LEFT | 0.281 | 0.292 | 0.246 | 37.5% | 5.4% | 28.4% | 43.8% | 1B | $2,300 | 1B | $3,800 | 1B | $7,400 |
| 6 | Miguel Andujar | RIGHT | 0.364 | 0.225 | 0.208 | 36.3% | 3.2% | 17.8% | 50.7% | 3B | $3,800 | 3B | $4,000 | 3B | $7,300 |
| 7 | Austin Romine | RIGHT | 0.389 | 0.300 | 0.214 | 35.6% | 13.6% | 18.2% | 42.2% | C | $2,400 | C | $3,600 | C | $7,700 |
| 8 | Luis Severino | RIGHT | 0.000 | 0.000 | 0.000 | 0.0% | 0.0% | 100.0% | 0.0% | P | $10,600 | P | $13,100 | P | $24,100 |
| 9 | Gleyber Torres | RIGHT | 0.398 | 0.334 | 0.258 | 39.0% | 6.2% | 26.7% | 29.8% | 2B | $3,900 | 2B | $4,100 | 2B | $8,500 |
| Team Averages | 0.312 | 0.280 | 0.201 | 33.8% | 8.1% | 31.6% | 38.8% |
Elite Plays – Didi Gregorius, Aaron Judge (GPP), Greg Bird (GPP), Miguel Andujar (GPP)
Secondary Plays – Aaron Judge (Cash), Greg Bird (Cash), Miguel Andujar (Cash), Brett Gardner
Stackability – YELLOW
Philadelphia
The Phillies have the worst matchup of the slate, which makes them an auto-fade with 13 other games on the schedule. Luis Severino has an elite strikeout rate and has held both left and right-handed hitters under a .300 xwOBA this season. Rhys Hoskins, Carlos Santana, and Nick Williams have hit right-handed pitching well this season, but why take the risk in a slate this size?
Projected Lineup (Splits vs. RH Pitching)
| # | Player | Bats | xwOBA | L15 | ISO | HC% | BB% | K% | GB% | FD Pos. | FD Sal. | DK Pos. | DK Sal. | FDRFT Pos. | FDRFT Sal. |
|---|---|---|---|---|---|---|---|---|---|---|---|---|---|---|---|
| 1 | Cesar Hernandez | SWITCH | 0.334 | 0.305 | 0.150 | 26.3% | 14.1% | 22.8% | 44.2% | 2B | $3,800 | 2B | $4,200 | 2B | $9,400 |
| 2 | Rhys Hoskins | RIGHT | 0.395 | 0.411 | 0.231 | 34.8% | 13.7% | 27.8% | 28.0% | OF | $3,900 | OF | $4,700 | IF/OF | $10,100 |
| 3 | Odubel Herrera | LEFT | 0.333 | 0.378 | 0.206 | 27.9% | 7.8% | 19.6% | 43.9% | OF | $4,000 | OF | $4,800 | IF/OF | $10,100 |
| 4 | Carlos Santana | SWITCH | 0.387 | 0.353 | 0.237 | 36.4% | 19.8% | 13.7% | 36.7% | 1B | $3,500 | 1B | $4,100 | 1B | $9,400 |
| 5 | Nick Williams | LEFT | 0.387 | 0.366 | 0.237 | 33.0% | 8.6% | 23.2% | 47.0% | OF | $2,500 | OF | $3,300 | RF | $6,700 |
| 6 | Scott Kingery | RIGHT | 0.307 | 0.297 | 0.114 | 28.1% | 6.6% | 22.4% | 38.9% | SS | $2,300 | SS | $2,900 | SS | $5,600 |
| 7 | Maikel Franco | RIGHT | 0.313 | 0.303 | 0.162 | 22.8% | 4.5% | 16.7% | 55.3% | 3B | $2,700 | 3B | $3,200 | 3B | $6,400 |
| 8 | Jorge Alfaro | RIGHT | 0.261 | 0.234 | 0.131 | 29.0% | 3.6% | 39.1% | 55.3% | C | $2,300 | C | $2,800 | C | $5,600 |
| 9 | Jake Arrieta | RIGHT | 0.179 | 0.323 | 0.158 | 42.9% | 5.0% | 60.0% | 28.6% | P | $7,300 | P | $6,800 | P | $14,000 |
| Team Averages | 0.322 | 0.330 | 0.181 | 31.2% | 9.3% | 27.3% | 42.0% |
Elite Plays – None
Secondary Plays – None
Stackability – RED
Seattle at Baltimore – 7:05 PM ET
| Seattle | Baltimore | ||||||||||||||
 | James Paxton |  | Kevin Gausman | ||||||||||||
| LEFT | RIGHT | ||||||||||||||
| Vegas Moneyline | Vegas Over/Under | ||||||||||||||
| SEA-125 | 8.5 | ||||||||||||||
| Stats | wOBA | xwOBA | HC% | BB% | K% | GB% | Stats | wOBA | xwOBA | HC% | BB% | K% | GB% | ||
|---|---|---|---|---|---|---|---|---|---|---|---|---|---|---|---|
| SP vs. Left (2016-17) | 0.421 | 0.320 | 32.6% | 8.9% | 31.7% | 45.7% | SP vs. Left (2016-17) | 0.318 | 0.323 | 26.6% | 9.6% | 22.8% | 43.2% | ||
| SP vs. Right (2016-17) | 0.249 | 0.304 | 37.6% | 7.0% | 31.4% | 35.9% | SP vs. Right (2016-17) | 0.370 | 0.365 | 37.3% | 3.7% | 21.3% | 50.3% | ||
Pitcher Grind Down
| James Paxton | |||||||||
 | FanDuel | DraftKings | FantasyDraft | ||||||
| Salary: | $9,600 | Salary: | $12,500 | Salary: | $20,700 | ||||
| Salary Rank: | 5 of 30 | Salary Rank: | 3 of 30 | Salary Rank: | 5 of 30 | ||||
| Stats | Starts | SIERA | ERA | K% | BB% | GB% | HC% | SC% | |
|---|---|---|---|---|---|---|---|---|---|
| 2017 | 24 | 3.45 | 2.98 | 28.3% | 6.7% | 44.9% | 30.3% | 18.0% | |
| 2018 | 16 | 3.04 | 3.72 | 31.5% | 7.4% | 37.8% | 36.7% | 18.3% | |
| L14 | 3 | 2.54 | 8.16 | 34.3% | 6.0% | 45.0% | 55.0% | 17.5% | |
Paxton has an ERA over eight in his last three starts, but has been incredibly unlucky during that stretch. In those outings, he has a 2.54 SIERA with a strikeout rate of 34%. His numbers as a whole are elite and his price across the industry will keep his ownership down. I see this as a great opportunity to play Paxton in tournaments. Outside of Manny Machado and Danny Valencia, the Orioles have struggled against left-handed pitching this season. While they have a right-handed heavy lineup, Paxton has held righties to a .304 xwOBA with a 31% k-rate this season.
Quick Breakdown: Paxton is an elite tournament play on both FanDuel and DraftKings.
| Kevin Gausman | |||||||||
 | FanDuel | DraftKings | FantasyDraft | ||||||
| Salary: | $7,200 | Salary: | $7,500 | Salary: | $16,300 | ||||
| Salary Rank: | 17 of 30 | Salary Rank: | 15 of 30 | Salary Rank: | 8 of 30 | ||||
| Stats | Starts | SIERA | ERA | K% | BB% | GB% | HC% | SC% | |
|---|---|---|---|---|---|---|---|---|---|
| 2017 | 34 | 4.41 | 4.68 | 21.9% | 8.7% | 42.7% | 32.3% | 18.2% | |
| 2018 | 15 | 3.79 | 4.38 | 21.9% | 6.3% | 47.4% | 32.8% | 18.1% | |
| L14 | 2 | 5.00 | 3.09 | 20.0% | 14.0% | 46.9% | 34.4% | 21.9% | |
Gausman is one of those pitchers that is just as likely to score five fantasy points as he is to score 30 fantasy points. His range of outcomes is incredibly broad, especially in a matchup against the Mariners. On the season, Gausman owns a 3.79 SIERA with a strikeout rate of 22%. While I like the price point, the Mariners’ projected lineup has a .351 xwOBA and a 35% hard contact rate against right-handed pitching this season. There seems to be more risk than upside with Gausman in this matchup, especially in a slate this size.
Quick Breakdown: Gausman is a deep tournament flier at best.
Batter Grind Down
Seattle
The Mariners see a favorable ballpark shift playing in Baltimore and draw a boom or bust matchup against Kevin Gausman. When he’s on, he’s a tough pitcher to hit. When he’s off, he gives up runs in bunches. On the season, Gausman has allowed a .365 xwOBA with a 37% hard contact rate to right-handed hitters. Jean Segura (.330 xwOBA), Mitch Haniger (.412 xwOBA), Nelson Cruz (.411 xwOBA), and Ryon Healy (.372 xwOBA) all bat from the right side and all hit right-handed pitching well. I should also note that this is the second home run friendliest ballpark to righties in the slate (seen in the ballpark ratings table above).
Projected Lineup (Splits vs. RH Pitching)
| # | Player | Bats | xwOBA | L15 | ISO | HC% | BB% | K% | GB% | FD Pos. | FD Sal. | DK Pos. | DK Sal. | FDRFT Pos. | FDRFT Sal. |
|---|---|---|---|---|---|---|---|---|---|---|---|---|---|---|---|
| 1 | Dee Gordon | LEFT | 0.276 | 0.254 | 0.069 | 17.9% | 2.0% | 16.0% | 54.0% | 2B | $2,800 | 2B/OF | $3,900 | IF/OF | $8,200 |
| 2 | Jean Segura | RIGHT | 0.330 | 0.277 | 0.144 | 30.2% | 3.6% | 13.6% | 55.2% | SS | $3,700 | SS | $4,800 | SS | $9,300 |
| 3 | Mitch Haniger | RIGHT | 0.412 | 0.365 | 0.251 | 41.0% | 12.2% | 23.6% | 41.0% | OF | $3,200 | OF | $4,500 | RF | $9,000 |
| 4 | Nelson Cruz | RIGHT | 0.411 | 0.537 | 0.254 | 39.3% | 6.7% | 19.7% | 43.7% | OF | $3,900 | OF | $5,000 | RF | $9,800 |
| 5 | Kyle Seager | LEFT | 0.337 | 0.327 | 0.202 | 40.7% | 6.2% | 20.4% | 35.5% | 3B | $2,800 | 3B | $3,700 | 3B | $8,300 |
| 6 | Ryon Healy | RIGHT | 0.372 | 0.391 | 0.222 | 41.3% | 3.6% | 21.3% | 41.6% | 1B | $2,700 | 1B | $3,800 | 1B | $8,200 |
| 7 | Denard Span | LEFT | 0.353 | 0.299 | 0.163 | 34.8% | 13.4% | 13.9% | 39.7% | OF | $2,500 | OF | $3,800 | CF | $7,700 |
| 8 | Mike Zunino | RIGHT | 0.340 | 0.260 | 0.256 | 43.2% | 3.7% | 37.8% | 40.5% | C | $2,200 | C | $3,200 | C | $6,600 |
| 9 | Guillermo Heredia | SWITCH | 0.330 | 0.239 | 0.112 | 27.4% | 12.8% | 18.3% | 44.9% | OF | $2,000 | OF | $2,600 | CF | $5,800 |
| Team Averages | 0.351 | 0.328 | 0.186 | 35.1% | 7.1% | 20.5% | 44.0% |
Elite Plays – Mitch Haniger (GPP), Nelson Cruz (GPP)
Secondary Plays – Mitch Haniger (Cash), Nelson Cruz (Cash), Dee Gordon, Jean Segura, Kyle Seager, Ryon Healy
Stackability – YELLOW
Baltimore
The Orioles draw one of the worst matchups of the slate. While they are playing at home and while James Paxton recent form looks ugly in terms of his ERA, there are better matchups to exploit. On the season, Paxton has held right-handed hitters to a .304 xwOBA. Manny Machado (.390 xwOBA) and Danny Valencia (.418 xwOBA) both mash left-handed pitching, but are deep tournament darts at best tonight.
Projected Lineup (Splits vs. LH Pitching)
| # | Player | Bats | xwOBA | L15 | ISO | HC% | BB% | K% | GB% | FD Pos. | FD Sal. | DK Pos. | DK Sal. | FDRFT Pos. | FDRFT Sal. |
|---|---|---|---|---|---|---|---|---|---|---|---|---|---|---|---|
| 1 | Craig Gentry | RIGHT | 0.284 | 0.330 | 0.072 | 29.6% | 6.8% | 20.3% | 46.2% | OF | $2,200 | OF | $2,600 | LF | $5,400 |
| 2 | Adam Jones | RIGHT | 0.333 | 0.281 | 0.069 | 30.8% | 2.2% | 11.1% | 38.5% | OF | $2,900 | OF | $3,500 | CF | $7,500 |
| 3 | Manny Machado | RIGHT | 0.390 | 0.417 | 0.244 | 35.4% | 8.7% | 5.4% | 35.4% | SS | $4,200 | SS | $4,700 | 3B | $10,000 |
| 4 | Mark Trumbo | RIGHT | 0.340 | 0.462 | 0.160 | 38.9% | 7.3% | 25.5% | 44.4% | OF | $3,200 | 1B/OF | $3,800 | DH | $8,500 |
| 5 | Danny Valencia | RIGHT | 0.418 | 0.384 | 0.169 | 27.3% | 11.4% | 13.6% | 42.4% | 3B | $2,500 | 3B | $3,200 | 3B | $6,400 |
| 6 | Trey Mancini | RIGHT | 0.296 | 0.297 | 0.140 | 26.9% | 6.9% | 25.7% | 68.7% | OF | $2,600 | 1B/OF | $3,200 | IF/OF | $6,600 |
| 7 | Jonathan Schoop | RIGHT | 0.301 | 0.313 | 0.088 | 27.6% | 8.0% | 13.3% | 43.9% | 2B | $2,500 | 2B | $3,300 | 2B | $6,300 |
| 8 | Tim Beckham | RIGHT | 0.337 | 0.326 | 0.211 | 54.6% | 17.4% | 34.8% | 45.5% | 3B | $2,000 | 3B | $3,000 | SS | $6,600 |
| 9 | Caleb Joseph | RIGHT | 0.308 | 0.336 | 0.077 | 21.9% | 2.4% | 17.1% | 37.5% | C | $2,200 | C | $2,700 | C | $5,800 |
| Team Averages | 0.334 | 0.350 | 0.137 | 32.6% | 7.9% | 18.5% | 44.7% |
Elite Plays – None
Secondary Plays – Manny Machado (GPP), Danny Valencia (GPP)
Stackability – ORANGE
Arizona at Miami – 7:10 PM ET
| Arizona | Miami | ||||||||||||||
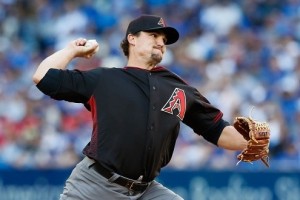
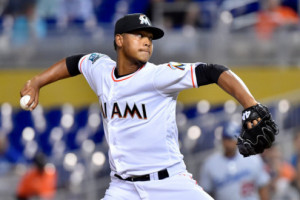
 | Zack Godley |  | Elieser Hernandez | ||||||||||||
| RIGHT | RIGHT | ||||||||||||||
| Vegas Moneyline | Vegas Over/Under | ||||||||||||||
| ARI-150 | 8.5 | ||||||||||||||
| Stats | wOBA | xwOBA | HC% | BB% | K% | GB% | Stats | wOBA | xwOBA | HC% | BB% | K% | GB% | ||
|---|---|---|---|---|---|---|---|---|---|---|---|---|---|---|---|
| SP vs. Left (2016-17) | 0.339 | 0.356 | 31.7% | 11.4% | 21.1% | 61.2% | SP vs. Left (2016-17) | 0.429 | 0.395 | 44.3% | 12.8% | 9.0% | 30.5% | ||
| SP vs. Right (2016-17) | 0.333 | 0.369 | 40.2% | 10.8% | 23.7% | 44.3% | SP vs. Right (2016-17) | 0.290 | 0.293 | 30.0% | 3.4% | 11.9% | 26.1% | ||
Pitcher Grind Down
| Zack Godley | |||||||||
 | FanDuel | DraftKings | FantasyDraft | ||||||
| Salary: | $8,200 | Salary: | $9,200 | Salary: | $14,500 | ||||
| Salary Rank: | 10 of 30 | Salary Rank: | 6 of 30 | Salary Rank: | 11 of 30 | ||||
| Stats | Starts | SIERA | ERA | K% | BB% | GB% | HC% | SC% | |
|---|---|---|---|---|---|---|---|---|---|
| 2017 | 25 | 3.67 | 3.37 | 26.3% | 8.5% | 55.3% | 32.2% | 18.6% | |
| 2018 | 15 | 4.26 | 4.64 | 22.4% | 11.1% | 52.5% | 36.0% | 23.1% | |
| L14 | 3 | 3.65 | 2.95 | 27.6% | 10.5% | 55.6% | 40.0% | 24.4% | |
Godley is finally starting to find his form. In his last three starts, he owns a 3.65 SIERA with a strikeout rate of 28% and a ground ball rate of 56%. While his high walk rate has been a concern all year, it’s a lot easier to overlook when he’s striking batters out at a high rate. He draws a favorable matchup against the Marlins and he gets to face them in a pitcher-friendly ballpark. Miami’s projected lineup has a .304 xwOBA with a strikeout rate of 29%. Perhaps the most important statistic is that their projected lineup only has a 6% walk rate, which is a big boost for Godley.
Quick Breakdown: Godley is an elite play in all formats.
| Elieser Hernandez | |||||||||
 | FanDuel | DraftKings | FantasyDraft | ||||||
| Salary: | $5,500 | Salary: | $4,200 | Salary: | $8,300 | ||||
| Salary Rank: | 29 of 30 | Salary Rank: | 28 of 30 | Salary Rank: | 19 of 30 | ||||
| Stats | Starts | SIERA | ERA | K% | BB% | GB% | HC% | SC% | |
|---|---|---|---|---|---|---|---|---|---|
| 2018 | 4 | 5.94 | 5.12 | 10.2% | 8.8% | 28.6% | 37.8% | 13.5% | |
| L14 | 0 | 7.73 | 7.45 | 8.5% | 19.2% | 20.0% | 32.4% | 20.6% | |
Hernandez has not pitched well in his first major league stint. In four starts and seven relief appearances, he owns a 5.94 SIERA with a strikeout rate of 10%. His hard contact rate is nearly 10% higher than his ground ball rate and he doesn’t have the best command. He’s an easy fade against the Diamondbacks, whose offense has been heating up over the last couple of weeks (.338 xwOBA).
Quick Breakdown: Avoid Hernandez in both cash games and tournaments.
Batter Grind Down
Arizona
The Diamondbacks are playing in one of the worst hitter’s parks in the National League, but it’s not all doom and gloom. They are sizable favorites tonight and draw a favorable matchup against Elieser Hernandez, who has allowed a .395 xwOBA and a 44% hard contact rate to left-handed hitters. While it’s a small sample size, his splits clearly favor lefties. Jon Jay (.347 xwOBA), Jake Lamb (.368 xwOBA), David Peralta (.368 xwOBA), and Daniel Descalso (.377 xwOBA) all bat from the left side and all hit right-handed pitching well. If you want to complete the stack, Paul Goldschmidt owns a .457 xwOBA over the last 15 days.
Projected Lineup (Splits vs. RH Pitching)
| # | Player | Bats | xwOBA | L15 | ISO | HC% | BB% | K% | GB% | FD Pos. | FD Sal. | DK Pos. | DK Sal. | FDRFT Pos. | FDRFT Sal. |
|---|---|---|---|---|---|---|---|---|---|---|---|---|---|---|---|
| 1 | Jon Jay | LEFT | 0.347 | 0.354 | 0.115 | 38.4% | 5.8% | 14.0% | 53.6% | OF | $3,200 | OF | $4,100 | CF | $9,000 |
| 2 | Paul Goldschmidt | RIGHT | 0.361 | 0.457 | 0.211 | 44.3% | 13.3% | 30.4% | 41.2% | 1B | $4,500 | 1B | $5,200 | 1B | $9,900 |
| 3 | Jake Lamb | LEFT | 0.368 | 0.325 | 0.175 | 48.0% | 9.4% | 25.6% | 45.3% | 3B | $3,400 | 3B | $4,000 | 3B | $8,400 |
| 4 | David Peralta | LEFT | 0.368 | 0.384 | 0.254 | 52.3% | 8.5% | 19.0% | 48.1% | OF | $3,800 | OF | $4,800 | RF | $9,000 |
| 5 | Daniel Descalso | LEFT | 0.377 | 0.337 | 0.243 | 43.2% | 16.8% | 22.7% | 30.6% | 2B | $2,900 | 2B/3B | $3,600 | 3B | $7,600 |
| 6 | Ketel Marte | SWITCH | 0.304 | 0.389 | 0.140 | 28.8% | 6.7% | 14.6% | 51.4% | 2B | $3,100 | 2B/SS | $3,600 | SS | $7,600 |
| 7 | Alex Avila | LEFT | 0.280 | 0.449 | 0.111 | 53.5% | 10.9% | 46.5% | 37.2% | C | $2,200 | C | $2,500 | C | $5,000 |
| 8 | Jarrod Dyson | LEFT | 0.284 | 0.210 | 0.071 | 20.7% | 11.3% | 13.1% | 40.7% | OF | $2,300 | OF | $3,100 | CF | $6,300 |
| 9 | Zack Godley | RIGHT | 0.062 | 0.133 | 0.000 | 0.0% | 0.0% | 73.3% | 0.0% | P | $8,200 | P | $9,200 | P | $14,500 |
| Team Averages | 0.306 | 0.338 | 0.147 | 36.6% | 9.2% | 28.8% | 38.7% |
Elite Plays – Jake Lamb, David Peralta
Secondary Plays – Jon Jay, Paul Goldschmidt, Daniel Descalso, Alex Avila (DK)
Stackability – YELLOW / GREEN
Miami
Zack Godley is a great example of why breaking down splits by timeframe matters. If you zoom out and look at the last two seasons, he’s been an above-average pitcher. If you zoom in over his last few starts, he’s been great. If you only trust the season long stats, you would think that he’s a hittable pitcher given the fact that he has allowed a .355+ xwOBA to both left and right-handed hitters. The Marlins are not an offense that I target often (even in favorable matchups), so I will not be making an exception tonight against Godley.
Projected Lineup (Splits vs. RH Pitching)
| # | Player | Bats | xwOBA | L15 | ISO | HC% | BB% | K% | GB% | FD Pos. | FD Sal. | DK Pos. | DK Sal. | FDRFT Pos. | FDRFT Sal. |
|---|---|---|---|---|---|---|---|---|---|---|---|---|---|---|---|
| 1 | Derek Dietrich | LEFT | 0.348 | 0.375 | 0.173 | 38.7% | 5.4% | 21.3% | 40.6% | OF | $3,400 | OF | $4,100 | IF/OF | $7,500 |
| 2 | Brian Anderson | RIGHT | 0.346 | 0.382 | 0.102 | 36.7% | 8.2% | 21.1% | 50.0% | OF | $3,000 | 3B/OF | $3,800 | IF/OF | $7,300 |
| 3 | J.T. Realmuto | RIGHT | 0.404 | 0.393 | 0.269 | 44.6% | 6.5% | 15.2% | 43.2% | C | $3,400 | C | $4,400 | C | $8,600 |
| 4 | Justin Bour | LEFT | 0.408 | 0.352 | 0.261 | 43.4% | 17.3% | 23.6% | 36.6% | 1B | $3,000 | 1B | $3,400 | 1B | $6,500 |
| 5 | Starlin Castro | RIGHT | 0.287 | 0.201 | 0.107 | 34.6% | 5.0% | 20.4% | 49.7% | 2B | $2,700 | 2B | $3,400 | 2B | $6,800 |
| 6 | JT Riddle | LEFT | 0.337 | 0.320 | 0.172 | 37.2% | 4.8% | 27.0% | 46.3% | SS | $2,100 | SS | $3,200 | SS | $6,500 |
| 7 | Miguel Rojas | RIGHT | 0.301 | 0.363 | 0.114 | 31.3% | 4.9% | 13.7% | 55.4% | 3B | $2,300 | 3B/SS | $2,800 | SS | $5,800 |
| 8 | Lewis Brinson | RIGHT | 0.278 | 0.348 | 0.144 | 40.0% | 3.8% | 34.9% | 50.5% | OF | $2,300 | OF | $3,000 | CF | $5,600 |
| 9 | Elieser Hernandez | RIGHT | 0.026 | 0.038 | 0.000 | 0.0% | 0.0% | 80.0% | 100.0% | P | $5,500 | P | $4,200 | P | $8,300 |
| Team Averages | 0.304 | 0.308 | 0.149 | 34.1% | 6.2% | 28.6% | 52.5% |
Elite Plays – None
Secondary Plays – None
Stackability – ORANGE
LA Angels at Boston – 7:10 PM ET
| LA Angels | Boston | ||||||||||||||
 | John Lamb |  | David Price | ||||||||||||
| LEFT | LEFT | ||||||||||||||
| Vegas Moneyline | Vegas Over/Under | ||||||||||||||
| BOS-165 | 10.0 | ||||||||||||||
| Stats | wOBA | xwOBA | HC% | BB% | K% | GB% | Stats | wOBA | xwOBA | HC% | BB% | K% | GB% | ||
|---|---|---|---|---|---|---|---|---|---|---|---|---|---|---|---|
| SP vs. Left (2016-17) | 0.000 | 0.006 | 0.0% | 0.0% | 50.0% | 0.0% | SP vs. Left (2016-17) | 0.298 | 0.321 | 27.5% | 6.9% | 20.7% | 41.0% | ||
| SP vs. Right (2016-17) | 0.409 | 0.393 | 45.8% | 5.9% | 23.5% | 41.7% | SP vs. Right (2016-17) | 0.301 | 0.328 | 31.2% | 9.0% | 23.4% | 39.6% | ||
Pitcher Grind Down
| John Lamb | |||||||||
 | FanDuel | DraftKings | FantasyDraft | ||||||
| Salary: | $6,200 | Salary: | $4,800 | Salary: | |||||
| Salary Rank: | 24 of 30 | Salary Rank: | 24 of 30 | Salary Rank: | |||||
| Stats | Starts | SIERA | ERA | K% | BB% | GB% | HC% | SC% | |
|---|---|---|---|---|---|---|---|---|---|
| 2018 | 2 | 3.54 | 5.40 | 25.0% | 5.6% | 40.0% | 44.0% | 16.0% | |
| L14 | 2 | 3.55 | 5.40 | 25.0% | 5.6% | 40.0% | 44.0% | 16.0% | |
Lamb is only making his third major league start of the season. While he has shown some strikeout upside in the minors, his track record in the big leagues is spotty. He owns a career 5.01 FIP with a strikeout rate of 22%. To make matters worse, he draws one of the worst matchups of the slate. He has to face the Red Sox on the road in the hitter-friendly Fenway Park. Even though there are some strikeouts in this Red Sox lineup, there are better options for both cash games and tournaments.
Quick Breakdown: Avoid Lamb in all formats.
| David Price | |||||||||
 | FanDuel | DraftKings | FantasyDraft | ||||||
| Salary: | $8,400 | Salary: | $8,300 | Salary: | |||||
| Salary Rank: | 9 of 30 | Salary Rank: | 9 of 30 | Salary Rank: | |||||
| Stats | Starts | SIERA | ERA | K% | BB% | GB% | HC% | SC% | |
|---|---|---|---|---|---|---|---|---|---|
| 2017 | 11 | 4.05 | 3.38 | 24.0% | 7.6% | 39.9% | 32.9% | 20.7% | |
| 2018 | 15 | 4.12 | 3.81 | 23.0% | 8.7% | 39.8% | 30.6% | 21.9% | |
| L14 | 2 | 3.97 | 2.77 | 20.0% | 2.0% | 29.7% | 23.7% | 18.4% | |
Price is a pitcher that I’ve been on the wrong side of more times than not this season. Overall, he has slightly above-average numbers — 4.12 SIERA with a strikeout rate of 23%. He’s a fly-ball pitcher, but he induces a lot of soft and medium contact, which is needed when your home park is Fenway. He draws a mediocre matchup against the Angels, whose projected lineup has a .330 xwOBA with a strikeout rate of 23% against southpaws. While he’s far from a core play, his $8,300 price point on DraftKings is appealing in tournaments.
Quick Breakdown: Price is viable as an SP2 on DraftKings.
Batter Grind Down
LA Angels
The Angels should be better against left-handed hitters than their numbers suggest. Ian Kinsler and Justin Upton have had outlier seasons in terms of their numbers against southpaws. I’m willing to trust their long term form, but it’s not like they are priced at a discount. The main reason to target the Angels tonight is the ballpark. They go from one of the best pitcher’s parks to one of the best hitter’s parks in Fenway. The best idea might be to use Mike Trout as a one-off in both cash games and tournaments. He currently owns a .472 xwOBA with a .396 ISO against left-handed pitching.
Projected Lineup (Splits vs. LH Pitching)
| # | Player | Bats | xwOBA | L15 | ISO | HC% | BB% | K% | GB% | FD Pos. | FD Sal. | DK Pos. | DK Sal. | FDRFT Pos. | FDRFT Sal. |
|---|---|---|---|---|---|---|---|---|---|---|---|---|---|---|---|
| 1 | Ian Kinsler | RIGHT | 0.248 | 0.319 | 0.097 | 28.6% | 4.6% | 9.2% | 32.1% | 2B | $2,900 | 2B | $3,800 | N/A | N/A |
| 2 | Mike Trout | RIGHT | 0.472 | 0.401 | 0.396 | 38.5% | 18.5% | 21.5% | 25.6% | OF | $5,000 | OF | $6,000 | N/A | N/A |
| 3 | Justin Upton | RIGHT | 0.300 | 0.397 | 0.115 | 45.5% | 10.3% | 32.8% | 42.4% | OF | $4,000 | OF | $4,700 | N/A | N/A |
| 4 | Albert Pujols | RIGHT | 0.330 | 0.415 | 0.111 | 43.2% | 5.2% | 19.0% | 31.8% | 1B | $3,000 | 1B | $3,700 | N/A | N/A |
| 5 | Luis Valbuena | LEFT | 0.302 | 0.330 | 0.156 | 33.3% | 5.7% | 31.4% | 23.8% | 3B | $2,700 | 1B/3B | $3,300 | N/A | N/A |
| 6 | Andrelton Simmons | RIGHT | 0.343 | 0.229 | 0.078 | 34.4% | 16.5% | 5.1% | 52.5% | SS | $3,000 | SS | $3,700 | N/A | N/A |
| 7 | Kole Calhoun | LEFT | 0.343 | 0.381 | 0.000 | 43.8% | 7.5% | 12.5% | 53.1% | OF | $2,700 | OF | $3,000 | N/A | N/A |
| 8 | Martin Maldonado | RIGHT | 0.296 | 0.267 | 0.104 | 44.1% | 5.6% | 29.6% | 33.3% | C | $2,400 | C | $2,800 | N/A | N/A |
| 9 | Michael Hermosillo | RIGHT | 0.336 | 0.093 | 0.250 | 66.7% | 9.1% | 45.5% | 33.3% | OF | $2,000 | OF | $3,100 | N/A | N/A |
| Team Averages | 0.330 | 0.315 | 0.145 | 42.0% | 9.2% | 23.0% | 36.4% |
Elite Plays – Mike Trout
Secondary Plays – Ian Kinsler (GPP), Justin Upton (GPP)
Stackability – ORANGE / YELLOW
Boston
The Red Sox lineup looks interesting tonight. As you can see below, most of their projected starters have been awful against southpaws this season. The three exceptions are Mookie Betts (.474 xwOBA), J.D. Martinez (.384 xwOBA), and Xander Bogaerts (.409 xwOBA). All three are elite plays tonight against John Lamb, who has allowed a .393 xwOBA and a 46% hard contact rate to right-handed hitters this season. If you want to complete the Red Sox stack (which is certainly viable given the Reds’ mediocre bullpen), Andrew Benintendi, Mitch Moreland, and Eduardo Nunez are viable.
Projected Lineup (Splits vs. LH Pitching)
| # | Player | Bats | xwOBA | L15 | ISO | HC% | BB% | K% | GB% | FD Pos. | FD Sal. | DK Pos. | DK Sal. | FDRFT Pos. | FDRFT Sal. |
|---|---|---|---|---|---|---|---|---|---|---|---|---|---|---|---|
| 1 | Mookie Betts | RIGHT | 0.474 | 0.376 | 0.393 | 37.3% | 10.9% | 9.4% | 37.3% | OF | $4,900 | OF | $6,100 | N/A | N/A |
| 2 | Andrew Benintendi | LEFT | 0.285 | 0.439 | 0.203 | 14.9% | 9.6% | 24.7% | 48.9% | OF | $3,900 | OF | $5,000 | N/A | N/A |
| 3 | J.D. Martinez | RIGHT | 0.384 | 0.374 | 0.156 | 51.2% | 5.9% | 33.8% | 46.3% | OF | $4,800 | OF | $5,700 | N/A | N/A |
| 4 | Mitch Moreland | LEFT | 0.287 | 0.439 | 0.160 | 38.2% | 7.4% | 29.6% | 47.1% | 1B | $3,600 | 1B | $4,500 | N/A | N/A |
| 5 | Xander Bogaerts | RIGHT | 0.409 | 0.362 | 0.160 | 31.4% | 13.8% | 25.9% | 31.4% | SS | $3,800 | SS | $5,000 | N/A | N/A |
| 6 | Eduardo Nunez | RIGHT | 0.294 | 0.319 | 0.031 | 26.4% | 7.0% | 18.3% | 55.8% | 2B | $2,600 | 2B/SS | $3,400 | N/A | N/A |
| 7 | Rafael Devers | LEFT | 0.250 | 0.320 | 0.132 | 26.3% | 2.6% | 24.4% | 45.6% | 3B | $3,200 | 3B | $4,100 | N/A | N/A |
| 8 | Sandy Leon | SWITCH | 0.256 | 0.328 | 0.000 | 33.3% | 7.4% | 25.9% | 33.3% | C | $2,300 | C | $2,800 | N/A | N/A |
| 9 | Jackie Bradley | LEFT | 0.269 | 0.380 | 0.059 | 25.8% | 3.6% | 35.7% | 61.3% | OF | $2,400 | OF | $3,000 | N/A | N/A |
| Team Averages | 0.323 | 0.371 | 0.144 | 31.6% | 7.6% | 25.3% | 45.2% |
Elite Plays – Mookie Betts, J.D. Martinez, Xander Bogaerts
Secondary Plays – Andrew Benintendi (GPP), Mitch Moreland (GPP), Eduardo Nunez
Stackability – YELLOW / GREEN
Oakland at Detroit – 7:10 PM ET
| Oakland | Detroit | ||||||||||||||
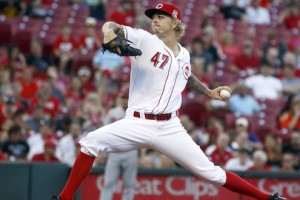
 | Frankie Montas |  | Blaine Hardy | ||||||||||||
| RIGHT | LEFT | ||||||||||||||
| Vegas Moneyline | Vegas Over/Under | ||||||||||||||
| OAK-105 | 9.0 | ||||||||||||||
| Stats | wOBA | xwOBA | HC% | BB% | K% | GB% | Stats | wOBA | xwOBA | HC% | BB% | K% | GB% | ||
|---|---|---|---|---|---|---|---|---|---|---|---|---|---|---|---|
| SP vs. Left (2016-17) | 0.300 | 0.295 | 37.7% | 6.0% | 14.9% | 34.6% | SP vs. Left (2016-17) | 0.271 | 0.348 | 32.5% | 3.9% | 13.7% | 40.0% | ||
| SP vs. Right (2016-17) | 0.300 | 0.320 | 50.9% | 8.3% | 15.3% | 54.7% | SP vs. Right (2016-17) | 0.311 | 0.297 | 33.0% | 6.4% | 18.4% | 41.8% | ||
Pitcher Grind Down
| Frankie Montas | |||||||||
 | FanDuel | DraftKings | FantasyDraft | ||||||
| Salary: | $8,600 | Salary: | $7,600 | Salary: | |||||
| Salary Rank: | 8 of 30 | Salary Rank: | 14 of 30 | Salary Rank: | |||||
| Stats | Starts | SIERA | ERA | K% | BB% | GB% | HC% | SC% | |
|---|---|---|---|---|---|---|---|---|---|
| 2017 | 0 | 4.51 | 7.03 | 23.7% | 13.2% | 35.5% | 33.3% | 17.2% | |
| 2018 | 5 | 4.66 | 2.41 | 15.1% | 7.2% | 44.8% | 44.3% | 12.3% | |
| L14 | 2 | 5.43 | 4.50 | 12.5% | 12.5% | 50.0% | 50.0% | 14.3% | |
Montas has a low ERA, but is due for some serious regression. In his five starts this season, he has a 4.66 SIERA with a strikeout rate of 15% and a hard contact rate of 44%. Eventually those numbers are going to catch up with him, regardless of how favorable the matchup looks on paper. The Tigers have a high strikeout rate against right-handed pitching this season, but have some good hitters at the top of their lineup. Montas doesn’t have enough strikeout upside to make up for the mistakes that he will eventually make.
Quick Breakdown: Avoid Montas in both cash games and tournaments.
| Blaine Hardy | |||||||||
 | FanDuel | DraftKings | FantasyDraft | ||||||
| Salary: | $5,900 | Salary: | $6,600 | Salary: | |||||
| Salary Rank: | 26 of 30 | Salary Rank: | 20 of 30 | Salary Rank: | |||||
| Stats | Starts | SIERA | ERA | K% | BB% | GB% | HC% | SC% | |
|---|---|---|---|---|---|---|---|---|---|
| 2017 | 0 | 4.66 | 5.94 | 18.0% | 8.3% | 33.0% | 36.5% | 20.0% | |
| 2018 | 7 | 4.45 | 3.30 | 17.1% | 5.7% | 41.2% | 32.8% | 20.2% | |
| L14 | 2 | 3.99 | 2.31 | 17.4% | 4.4% | 54.3% | 30.6% | 22.2% | |
Hardy has the same issue as Frankie Montas — he is due for regression. Fortunately, his advanced statistics aren’t as ugly as those of Montas. In seven starts, Hardy has a 4.45 SIERA with a strikeout rate of 17%. Those numbers are far from ideal. While the A’s have struggled against high-strikeout lefties this season, they have been very good against low-strikeout lefties. Their projected lineup has a .343 xwOBA with a massive 43% hard contact rate against southpaws.
Quick Breakdown: Avoid both starters in what could end up being a sneaky shootout.
Batter Grind Down
Oakland
The A’s are playing on the road (guaranteed ninth-inning at-bats), they are playing in a decent hitter’s park, they draw an exploitable matchup, and their ownership should be low in tournaments. That is quite the combination and one that I will not overlook. Oakland is one of my favorite stacks of the slate. Chad Pinder (.386 xwOBA), Jed Lowrie (.361 xwOBA), Matt Olson (.360 xwOBA), and Stephen Piscotty (.351 xwOBA) have all mashed right-handed pitching well this season. Marcus Semien and Khris Davis have struggled against southpaws this year, but have hit them well throughout their respective careers.
Projected Lineup (Splits vs. LH Pitching)
| # | Player | Bats | xwOBA | L15 | ISO | HC% | BB% | K% | GB% | FD Pos. | FD Sal. | DK Pos. | DK Sal. | FDRFT Pos. | FDRFT Sal. |
|---|---|---|---|---|---|---|---|---|---|---|---|---|---|---|---|
| 1 | Marcus Semien | RIGHT | 0.316 | 0.278 | 0.192 | 35.1% | 7.3% | 22.7% | 39.0% | SS | $3,300 | SS | $4,100 | N/A | N/A |
| 2 | Chad Pinder | RIGHT | 0.386 | 0.438 | 0.178 | 64.6% | 9.8% | 30.5% | 48.9% | OF | $2,300 | OF | $3,300 | N/A | N/A |
| 3 | Jed Lowrie | SWITCH | 0.361 | 0.249 | 0.117 | 45.8% | 4.6% | 18.5% | 33.7% | 3B | $3,500 | 2B | $4,400 | N/A | N/A |
| 4 | Khris Davis | RIGHT | 0.303 | 0.398 | 0.221 | 40.9% | 11.3% | 31.3% | 47.7% | OF | $4,000 | OF | $5,000 | N/A | N/A |
| 5 | Matt Olson | LEFT | 0.360 | 0.409 | 0.141 | 53.0% | 4.9% | 26.5% | 37.9% | 1B | $3,500 | 1B | $4,300 | N/A | N/A |
| 6 | Stephen Piscotty | RIGHT | 0.351 | 0.393 | 0.118 | 29.3% | 9.3% | 20.9% | 51.7% | OF | $2,800 | OF | $3,700 | N/A | N/A |
| 7 | Mark Canha | RIGHT | 0.344 | 0.406 | 0.329 | 37.5% | 5.0% | 25.0% | 32.1% | OF | $3,100 | OF | $3,700 | N/A | N/A |
| 8 | Jonathan Lucroy | RIGHT | 0.274 | 0.440 | 0.048 | 31.4% | 10.1% | 15.9% | 43.1% | C | $2,300 | C | $2,900 | N/A | N/A |
| 9 | Franklin Barreto | RIGHT | 0.390 | 0.295 | 0.353 | 50.0% | 5.6% | 38.9% | 40.0% | 2B | $2,500 | 2B | $3,700 | N/A | N/A |
| Team Averages | 0.343 | 0.367 | 0.189 | 43.1% | 7.5% | 25.6% | 41.6% |
Elite Plays – Chad Pinder (GPP), Jed Lowrie (GPP), Khris Davis (GPP)
Secondary Plays – Chad Pinder (Cash), Jed Lowrie (Cash), Khris Davis (Cash), Marcus Semien, Matt Olson, Stephen Piscotty
Stackability – YELLOW / GREEN
Detroit
The Tigers are cheap and have plenty of upside in a matchup against Frankie Montas. Throw out the sub-three ERA and look at his advanced numbers. He is a low-strikeout pitcher that has allowed a ton of hard contact this season, especially to right-handed hitters (50%). The Tigers aren’t thought of as a potent offense, but they are actually ranked 12th in the majors in wOBA at home this season. Leonys Martin (.424 xwOBA), Nick Castellanos (.368 xwOBA), and Victor Martinez (.350 xwOBA) have all hit right-handed pitching well this season.
Projected Lineup (Splits vs. RH Pitching)
| # | Player | Bats | xwOBA | L15 | ISO | HC% | BB% | K% | GB% | FD Pos. | FD Sal. | DK Pos. | DK Sal. | FDRFT Pos. | FDRFT Sal. |
|---|---|---|---|---|---|---|---|---|---|---|---|---|---|---|---|
| 1 | Leonys Martin | LEFT | 0.424 | 0.382 | 0.191 | 42.4% | 10.8% | 21.1% | 35.5% | OF | $3,000 | OF | $4,300 | N/A | N/A |
| 2 | Jeimer Candelario | SWITCH | 0.318 | 0.252 | 0.203 | 35.7% | 12.4% | 24.9% | 38.1% | 3B | $2,900 | 3B | $4,000 | N/A | N/A |
| 3 | Nick Castellanos | RIGHT | 0.368 | 0.366 | 0.187 | 48.3% | 4.9% | 23.7% | 33.7% | OF | $3,000 | OF | $4,400 | N/A | N/A |
| 4 | Victor Martinez | SWITCH | 0.350 | 0.343 | 0.086 | 42.0% | 7.8% | 10.4% | 39.5% | C | $2,200 | 1B | $2,900 | N/A | N/A |
| 5 | Niko Goodrum | SWITCH | 0.338 | 0.275 | 0.234 | 34.5% | 10.2% | 31.3% | 41.7% | OF | $2,700 | 2B/OF | $3,600 | N/A | N/A |
| 6 | John Hicks | RIGHT | 0.291 | 0.310 | 0.153 | 43.5% | 3.5% | 31.7% | 38.9% | C | $2,100 | 1B/C | $3,200 | N/A | N/A |
| 7 | James McCann | RIGHT | 0.273 | 0.199 | 0.063 | 35.5% | 5.8% | 21.5% | 39.5% | C | $2,200 | C | $2,900 | N/A | N/A |
| 8 | Jose Iglesias | RIGHT | 0.279 | 0.311 | 0.100 | 24.9% | 4.0% | 12.0% | 45.1% | SS | $2,400 | SS | $3,400 | N/A | N/A |
| 9 | JaCoby Jones | RIGHT | 0.301 | 0.255 | 0.168 | 31.7% | 3.8% | 28.0% | 42.1% | OF | $2,400 | OF | $3,300 | N/A | N/A |
| Team Averages | 0.327 | 0.299 | 0.154 | 37.6% | 7.0% | 22.7% | 39.3% |
Elite Plays – Leonys Martin, Nick Castellanos
Secondary Plays – Jeimer Candelario, Victor Martinez, Niko Goodrum, John Hicks (DK)
Stackability – YELLOW
Note: Unless noted, all statistics in the Grind Down are from the 2018 season.