MLB Grind Down: Wednesday, April 25th

Jump to Page 1 2 3
The RotoGrinders MLB Grind Down will give you an in-depth analysis into the upcoming MLB schedule. This article will break down the numbers for every single game and give you analysis on which trends you can exploit. While matchups are a major factor in daily fantasy baseball, there are plenty of other factors to consider such as injuries, weather, and salaries.
The analysis should point you in the right direction, but it is still up to you to decipher the information and make your own selections. No sport has more variance than baseball. The best choice is not always the right choice but following the trends will win you money over time.
Note: As always, if you want to try a new DFS site, be sure to click through a RotoGrinders link and use our DraftKings promo code, FanDuel promo code, and FantasyDraft promo code to receive the best perks in the industry.

Stackability Rating System:
GREEN – A viable full stack in cash games and GPPs.
YELLOW – A viable mini-stack in cash games and full stack in GPPs.
ORANGE – A viable stack in large field GPPs.
RED – Not a recommended stack for cash games or GPPs.
Implied Run Totals
Ballpark Ratings
LA Angels at Houston – 2:10 PM ET
| LA Angels | Houston | ||||||||||||||
 | Nick Tropeano |  | Justin Verlander | ||||||||||||
| RIGHT | RIGHT | ||||||||||||||
| Vegas Moneyline | Vegas Over/Under | ||||||||||||||
| HOU-220 | 8.0 | ||||||||||||||
| Stats | wOBA | xwOBA | HC% | BB% | K% | GB% | Stats | wOBA | xwOBA | HC% | BB% | K% | GB% | ||
|---|---|---|---|---|---|---|---|---|---|---|---|---|---|---|---|
| SP vs. Left (2016-17) | 0.438 | 0.401 | 42.9% | 0.0% | 12.5% | 52.4% | SP vs. Left (2016-17) | 0.285 | 0.303 | 33.5% | 10.1% | 29.8% | 31.6% | ||
| SP vs. Right (2016-17) | 0.293 | 0.402 | 42.9% | 16.7% | 25.0% | 21.4% | SP vs. Right (2016-17) | 0.270 | 0.320 | 33.1% | 6.5% | 23.6% | 34.1% | ||
Pitcher Grind Down
| Nick Tropeano | |||||||||
 | FanDuel | DraftKings | FantasyDraft | ||||||
| Salary: | $5,900 | Salary: | $4,900 | Salary: | $9,900 | ||||
| Salary Rank: | 23 of 30 | Salary Rank: | 19 of 30 | Salary Rank: | 16 of 30 | ||||
| Stats | Starts | SIERA | ERA | K% | BB% | GB% | HC% | SC% | |
|---|---|---|---|---|---|---|---|---|---|
| 2018 | 2 | 4.46 | 3.75 | 18.8% | 8.3% | 40.0% | 42.9% | 8.6% | |
We have a mixed schedule on tap today. There are four early games, two late afternoon games, and nine evening games. Tropeano will be making his third start of the season and he draws his toughest test to date. He is facing an Astros’ offense that has power, draws walks, and strikes out at a low rate. Tropeano is a massive underdog on the road and an easy fade in both cash games and tournaments.
Quick Breakdown: This is a tough spot for Tropeano.
| Justin Verlander | |||||||||
 | FanDuel | DraftKings | FantasyDraft | ||||||
| Salary: | $11,000 | Salary: | $12,000 | Salary: | $23,400 | ||||
| Salary Rank: | 3 of 30 | Salary Rank: | 3 of 30 | Salary Rank: | 2 of 30 | ||||
| Stats | Starts | SIERA | ERA | K% | BB% | GB% | HC% | SC% | |
|---|---|---|---|---|---|---|---|---|---|
| 2017 | 33 | 4.05 | 3.36 | 25.8% | 8.5% | 33.5% | 34.5% | 17.5% | |
| 2018 | 5 | 3.01 | 1.10 | 31.7% | 6.5% | 29.7% | 24.3% | 18.9% | |
Verlander is one of the top pitching options of the early slate. Since being acquired by the Astros last season, he’s been one of the best pitchers in baseball. In his five starts this season, he has a 3.01 SIERA with a strikeout rate of 32%. He has great command and he constantly pounds the strike zone, which gives him strikeout upside even in the most difficult matchups. The Angels have a talented offense, but I’m not overly concerned.
Quick Breakdown: Verlander and Max Scherzer are clearly the top pitching options available in the early slate.
Batter Grind Down
LA Angels
The Angels draw one of the worst matchups on the board and consequently, have one of the lowest implied run totals. Since the beginning of last season, Justin Verlander has held both left and right-handed hitters under a .305 xwOBA. He also has an elite strikeout rate and is pitching at home. For the third consecutive day, Mike Trout is viable as a one-off target in tournaments, but the rest of the Angels can be avoided.
Projected Lineup (Splits vs. RH Pitching)
| # | Player | Bats | wOBA | xwOBA | ISO | HC% | BB% | K% | GB% | FD Pos. | FD Sal. | DK Pos. | DK Sal. | FDRFT Pos. | FDRFT Sal. |
|---|---|---|---|---|---|---|---|---|---|---|---|---|---|---|---|
| 1 | Ian Kinsler | RIGHT | 0.303 | 0.324 | 0.155 | 34.8% | 8.7% | 14.3% | 34.6% | 2B | $3,100 | 2B | $3,900 | 2B | $7,300 |
| 2 | Mike Trout | RIGHT | 0.447 | 0.435 | 0.349 | 40.7% | 17.0% | 18.2% | 35.1% | OF | $5,400 | OF | $5,600 | CF | $11,200 |
| 3 | Justin Upton | RIGHT | 0.350 | 0.348 | 0.233 | 39.6% | 11.1% | 29.7% | 36.0% | OF | $3,600 | OF | $4,300 | LF | $8,200 |
| 4 | Albert Pujols | RIGHT | 0.299 | 0.332 | 0.168 | 35.8% | 4.8% | 14.2% | 42.7% | 1B | $3,000 | 1B | $3,500 | 1B | $7,700 |
| 5 | Luis Valbuena | LEFT | 0.316 | 0.322 | 0.231 | 35.8% | 10.7% | 27.1% | 32.9% | 3B | $2,400 | 1B/3B | $3,200 | 3B | $6,300 |
| 6 | Zack Cozart | RIGHT | 0.375 | 0.336 | 0.233 | 30.7% | 10.9% | 15.3% | 39.1% | SS | $2,600 | 2B/3B | $3,800 | SS | $7,700 |
| 7 | Andrelton Simmons | RIGHT | 0.321 | 0.307 | 0.140 | 31.5% | 5.1% | 9.4% | 48.8% | SS | $2,600 | SS | $3,300 | SS | $6,700 |
| 8 | Kole Calhoun | LEFT | 0.311 | 0.327 | 0.142 | 33.6% | 10.4% | 22.2% | 44.2% | OF | $2,400 | OF | $3,100 | RF | $6,500 |
| 9 | Martin Maldonado | RIGHT | 0.274 | 0.293 | 0.151 | 26.2% | 2.1% | 23.2% | 47.9% | C | $2,100 | C | $2,500 | C | $4,700 |
Elite Plays – None
Secondary Plays – Mike Trout (GPP)
Stackability – RED
Houston
The Astros are off to a slow start this season when you look at their numbers against right-handed pitching, but we don’t need to worry about this team. Take a glance at their projected lineup below — they have eight batters with an xwOBA of at least .320 against righties. If we look at his career splits, Nick Tropeano has allowed a .349 wOBA to lefties and a .314 wOBA to righties. I won’t get carried away with Astros’ exposure here, but there plenty of viable options in this lineup.
Projected Lineup (Splits vs. RH Pitching)
| # | Player | Bats | wOBA | xwOBA | ISO | HC% | BB% | K% | GB% | FD Pos. | FD Sal. | DK Pos. | DK Sal. | FDRFT Pos. | FDRFT Sal. |
|---|---|---|---|---|---|---|---|---|---|---|---|---|---|---|---|
| 1 | George Springer | RIGHT | 0.353 | 0.365 | 0.220 | 36.2% | 8.8% | 19.4% | 50.0% | OF | $4,600 | OF | $5,000 | RF | $8,700 |
| 2 | Jose Altuve | RIGHT | 0.399 | 0.365 | 0.178 | 28.4% | 8.7% | 12.6% | 46.8% | 2B | $4,400 | 2B | $5,100 | 2B | $9,800 |
| 3 | Carlos Correa | RIGHT | 0.382 | 0.387 | 0.243 | 37.5% | 10.5% | 22.0% | 45.4% | SS | $4,700 | SS | $5,200 | SS | $8,700 |
| 4 | Josh Reddick | LEFT | 0.374 | 0.351 | 0.203 | 33.3% | 9.4% | 12.5% | 34.1% | OF | $3,600 | OF | $4,000 | RF | $7,200 |
| 5 | Yuli Gurriel | RIGHT | 0.359 | 0.333 | 0.203 | 33.1% | 2.8% | 10.1% | 45.3% | 1B | $3,000 | 1B | $4,100 | 1B | $8,100 |
| 6 | Alex Bregman | RIGHT | 0.331 | 0.341 | 0.166 | 33.1% | 9.0% | 15.8% | 40.5% | 3B | $3,800 | 3B | $4,300 | 3B | $8,000 |
| 7 | Brian McCann | LEFT | 0.329 | 0.335 | 0.194 | 32.2% | 9.6% | 16.0% | 36.8% | C | $2,500 | C | $3,400 | C | $6,500 |
| 8 | Evan Gattis | RIGHT | 0.327 | 0.321 | 0.171 | 32.4% | 6.9% | 18.1% | 34.8% | C | $2,800 | C | $3,300 | C | $6,400 |
| 9 | Derek Fisher | LEFT | 0.268 | 0.304 | 0.148 | 43.8% | 9.0% | 35.9% | 50.6% | OF | $2,000 | OF | $2,900 | RF | $5,900 |
Elite Plays – George Springer, Jose Altuve, Carlos Correa, Josh Reddick
Secondary Plays – Brian McCann
Stackability – YELLOW / GREEN
Seattle at Chicago White Sox – 2:10 PM ET
| Seattle | Chicago White Sox | ||||||||||||||
 | Felix Hernandez |  | James Shields | ||||||||||||
| RIGHT | RIGHT | ||||||||||||||
| Vegas Moneyline | Vegas Over/Under | ||||||||||||||
| SEA-140 | 9.5 | ||||||||||||||
| Stats | wOBA | xwOBA | HC% | BB% | K% | GB% | Stats | wOBA | xwOBA | HC% | BB% | K% | GB% | ||
|---|---|---|---|---|---|---|---|---|---|---|---|---|---|---|---|
| SP vs. Left (2016-17) | 0.355 | 0.409 | 31.1% | 9.0% | 18.5% | 46.6% | SP vs. Left (2016-17) | 0.388 | 0.390 | 32.4% | 13.1% | 15.4% | 42.3% | ||
| SP vs. Right (2016-17) | 0.318 | 0.333 | 32.4% | 6.2% | 21.9% | 44.8% | SP vs. Right (2016-17) | 0.311 | 0.344 | 34.2% | 8.2% | 21.0% | 35.4% | ||
Pitcher Grind Down
| Felix Hernandez | |||||||||
 | FanDuel | DraftKings | FantasyDraft | ||||||
| Salary: | $6,000 | Salary: | $6,500 | Salary: | |||||
| Salary Rank: | 22 of 30 | Salary Rank: | 12 of 30 | Salary Rank: | |||||
| Stats | Starts | SIERA | ERA | K% | BB% | GB% | HC% | SC% | |
|---|---|---|---|---|---|---|---|---|---|
| 2017 | 16 | 4.19 | 4.36 | 21.2% | 7.1% | 46.9% | 30.7% | 19.1% | |
| 2018 | 5 | 4.64 | 5.06 | 17.5% | 8.8% | 41.8% | 35.0% | 18.8% | |
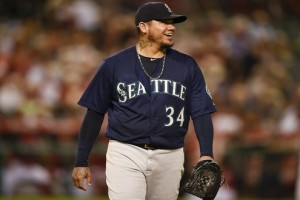
Hernandez is on the tail end of his career and it’s evident in his numbers. In five starts this season, he owns a 4.64 SIERA with a strikeout rate of only 18%. His ground ball rate is down and he is allowing significantly more hard contact. While a matchup against the White Sox looks appealing on paper, this game features a close spread and an over/under of 9.5 runs.
Quick Breakdown: The search for an SP2 is difficult, but I’d rather target Jeff Samardzija at home against the Nationals.
| James Shields | |||||||||
 | FanDuel | DraftKings | FantasyDraft | ||||||
| Salary: | $5,500 | Salary: | $4,600 | Salary: | |||||
| Salary Rank: | 27 of 30 | Salary Rank: | 22 of 30 | Salary Rank: | |||||
| Stats | Starts | SIERA | ERA | K% | BB% | GB% | HC% | SC% | |
|---|---|---|---|---|---|---|---|---|---|
| 2017 | 21 | 4.94 | 5.23 | 20.0% | 10.3% | 38.2% | 33.3% | 19.3% | |
| 2018 | 4 | 6.02 | 6.17 | 10.1% | 11.9% | 41.5% | 33.3% | 17.9% | |
Shields doesn’t have a single blue or green box in his pitching table above, which is not a good sign. He has a low strikeout rate, a high walk rate, and he’s a fly-ball pitcher that gives up a lot of home runs to both left and right-handed hitters. As an underdog at home in a hitter-friendly ballpark, he’s an easy fade in all formats.
Quick Breakdown: Shields is the least appealing option of the slate.
Batter Grind Down
Seattle
The Mariners draw the top matchup of the slate and are playing in a good ballpark for run production. Over the last two seasons, James Shields has allowed a .390 xwOBA to left-handed hitters and a .344 xwOBA to right-handed hitters. A Mariners’ stack is certainly viable here, but keep in mind that there is a game in Coors Field that we are going to want some exposure to. If you like BvP, Robinson Cano is 38-for-92 with six home runs, two triples, and nine doubles against Shields in his career.
Projected Lineup (Splits vs. RH Pitching)
| # | Player | Bats | wOBA | xwOBA | ISO | HC% | BB% | K% | GB% | FD Pos. | FD Sal. | DK Pos. | DK Sal. | FDRFT Pos. | FDRFT Sal. |
|---|---|---|---|---|---|---|---|---|---|---|---|---|---|---|---|
| 1 | Dee Gordon | LEFT | 0.325 | 0.270 | 0.077 | 17.1% | 4.5% | 14.7% | 53.5% | OF | $3,400 | OF | $4,100 | N/A | N/A |
| 2 | Jean Segura | RIGHT | 0.326 | 0.294 | 0.133 | 24.9% | 4.5% | 15.2% | 56.0% | SS | $4,000 | SS | $4,000 | N/A | N/A |
| 3 | Robinson Cano | LEFT | 0.372 | 0.396 | 0.196 | 40.1% | 8.5% | 12.5% | 47.6% | 2B | $4,100 | 2B | $4,000 | N/A | N/A |
| 4 | Nelson Cruz | RIGHT | 0.392 | 0.394 | 0.282 | 40.1% | 7.0% | 22.1% | 40.7% | OF | $3,800 | OF | $4,300 | N/A | N/A |
| 5 | Kyle Seager | LEFT | 0.322 | 0.366 | 0.204 | 37.6% | 9.3% | 16.2% | 30.9% | 3B | $3,400 | 3B | $3,600 | N/A | N/A |
| 6 | Mitch Haniger | RIGHT | 0.378 | 0.348 | 0.225 | 38.0% | 8.8% | 23.6% | 40.4% | OF | $4,100 | OF | $4,000 | N/A | N/A |
| 7 | Daniel Vogelbach | LEFT | 0.341 | 0.390 | 0.148 | 48.6% | 11.3% | 30.6% | 34.3% | 1B | $2,700 | 1B | $3,100 | N/A | N/A |
| 8 | Mike Zunino | RIGHT | 0.346 | 0.323 | 0.243 | 39.7% | 8.3% | 37.8% | 33.9% | C | $2,800 | C | $3,200 | N/A | N/A |
| 9 | Ben Gamel | LEFT | 0.317 | 0.305 | 0.139 | 28.2% | 7.7% | 19.8% | 43.7% | OF | $2,500 | OF | $3,100 | N/A | N/A |
Elite Plays – Dee Gordon, Jean Segura, Robinson Cano, Nelson Cruz, Kyle Seager
Secondary Plays – Mitch Haniger, Daniel Vogelbach
Stackability – GREEN
Chicago White Sox
The White Sox are going to fly under the radar in the early slate. Everyone will be looking to target four offenses — the two in Coors Field, the Astros, and the Mariners. Even though Felix Hernandez is a very hittable pitcher at this stage of his career, we’ll be able to target the White Sox at low ownership. Hernandez has allowed a .409 xwOBA to left-handed hitters in the last two seasons. Yoan Moncada has a 44% hard contact rate against right-handed pitching and brings plenty of stolen base upside to the table.
Projected Lineup (Splits vs. RH Pitching)
| # | Player | Bats | wOBA | xwOBA | ISO | HC% | BB% | K% | GB% | FD Pos. | FD Sal. | DK Pos. | DK Sal. | FDRFT Pos. | FDRFT Sal. |
|---|---|---|---|---|---|---|---|---|---|---|---|---|---|---|---|
| 1 | Yoan Moncada | SWITCH | 0.354 | 0.368 | 0.221 | 43.6% | 14.4% | 33.5% | 39.4% | 2B | $3,800 | 2B | $4,200 | N/A | N/A |
| 2 | Yolmer Sanchez | SWITCH | 0.322 | 0.294 | 0.157 | 25.8% | 6.2% | 19.9% | 47.7% | 3B | $3,100 | 3B | $3,000 | N/A | N/A |
| 3 | Jose Abreu | RIGHT | 0.362 | 0.370 | 0.239 | 40.6% | 4.7% | 16.9% | 45.6% | 1B | $3,900 | 1B | $4,200 | N/A | N/A |
| 4 | Nick Delmonico | LEFT | 0.357 | 0.314 | 0.185 | 28.3% | 11.6% | 17.9% | 37.6% | OF | $2,400 | OF | $3,100 | N/A | N/A |
| 5 | Welington Castillo | RIGHT | 0.330 | 0.345 | 0.204 | 37.6% | 6.8% | 26.7% | 42.6% | C | $2,400 | C | $3,100 | N/A | N/A |
| 6 | Matt Davidson | RIGHT | 0.298 | 0.314 | 0.244 | 42.2% | 5.4% | 39.4% | 40.2% | 3B | $3,600 | 3B | $3,700 | N/A | N/A |
| 7 | Tim Anderson | RIGHT | 0.269 | 0.265 | 0.135 | 27.2% | 3.4% | 27.2% | 53.4% | SS | $3,200 | SS | $3,600 | N/A | N/A |
| 8 | Daniel Palka | LEFT | OF | $2,000 | OF | $2,700 | N/A | N/A | |||||||
| 9 | Adam Engel | RIGHT | 0.209 | 0.222 | 0.092 | 25.0% | 5.7% | 37.7% | 40.0% | OF | $2,200 | OF | $2,800 | N/A | N/A |
Elite Plays – Yoan Moncada
Secondary Plays – Yolmer Sanchez, Jose Abreu, Nick Delmonico, Welington Castillo
Stackability – YELLOW
San Diego at Colorado – 3:10 PM ET
| San Diego | Colorado | ||||||||||||||
 | Tyson Ross |  | Jon Gray | ||||||||||||
| RIGHT | RIGHT | ||||||||||||||
| Vegas Moneyline | Vegas Over/Under | ||||||||||||||
| COL-150 | 10.0 | ||||||||||||||
| Stats | wOBA | xwOBA | HC% | BB% | K% | GB% | Stats | wOBA | xwOBA | HC% | BB% | K% | GB% | ||
|---|---|---|---|---|---|---|---|---|---|---|---|---|---|---|---|
| SP vs. Left (2016-17) | 0.332 | 0.356 | 33.6% | 12.5% | 16.1% | 53.1% | SP vs. Left (2016-17) | 0.320 | 0.318 | 30.2% | 6.9% | 20.7% | 49.6% | ||
| SP vs. Right (2016-17) | 0.345 | 0.339 | 30.4% | 13.4% | 19.2% | 42.9% | SP vs. Right (2016-17) | 0.331 | 0.306 | 26.7% | 6.0% | 26.8% | 44.2% | ||
Pitcher Grind Down
| Tyson Ross | |||||||||
 | FanDuel | DraftKings | FantasyDraft | ||||||
| Salary: | $7,200 | Salary: | $6,100 | Salary: | $8,000 | ||||
| Salary Rank: | 11 of 30 | Salary Rank: | 16 of 30 | Salary Rank: | 20 of 30 | ||||
| Stats | Starts | SIERA | ERA | K% | BB% | GB% | HC% | SC% | |
|---|---|---|---|---|---|---|---|---|---|
| 2017 | 10 | 6.17 | 7.71 | 15.1% | 15.6% | 46.8% | 32.3% | 14.6% | |
| 2018 | 4 | 3.44 | 2.81 | 23.5% | 6.9% | 50.7% | 31.4% | 21.4% | |
Ross has turned back the clock to 2015. It’s good to see him pitching again, as he’s gone through a rough stretch over the last couple of years. In four starts this season, he has a 3.44 SIERA with a strikeout rate of 24%. The ground ball rate is up and he is inducing a lot of soft and medium contact. Unfortunately, we can throw all of that out the window today, as he is facing the Rockies in Coors Field.
Quick Breakdown: Avoid Ross in all formats.
| Jon Gray | |||||||||
 | FanDuel | DraftKings | FantasyDraft | ||||||
| Salary: | $7,500 | Salary: | $6,600 | Salary: | $9,100 | ||||
| Salary Rank: | 9 of 30 | Salary Rank: | 11 of 30 | Salary Rank: | 18 of 30 | ||||
| Stats | Starts | SIERA | ERA | K% | BB% | GB% | HC% | SC% | |
|---|---|---|---|---|---|---|---|---|---|
| 2017 | 20 | 3.74 | 3.67 | 24.3% | 6.5% | 48.9% | 28.4% | 22.7% | |
| 2018 | 5 | 4.05 | 6.75 | 19.5% | 6.5% | 42.0% | 30.0% | 20.0% | |
Gray has not been sharp so far this season, posting a 4.05 SIERA with a strikeout rate of only 20%. He had a rough outing against the Padres at home a couple of weeks ago, but will get another crack at them today. While he would typically be an intriguing option in a slate this size, we have two elite arms on the mound in Max Scherzer and Justin Verlander. Once again, there aren’t many SP2 options available, but I’d rather play Jeff Samardzija in a pitcher’s park.
Quick Breakdown: Avoid Gray in all formats.
Batter Grind Down
San Diego
Baseball is funny. The Padres scored 13 runs in Coors Field on Monday night and were then shutout in a similarly favorable matchup the next night. Jon Gray is the Rockies’ best pitcher, but the Padres have had some success against him in this ballpark. There are better stacks in the early slate, but Franchy Cordero, Wil Myers, and Carlos Asuaje are all viable targets at their respective positions.
Projected Lineup (Splits vs. RH Pitching)
| # | Player | Bats | wOBA | xwOBA | ISO | HC% | BB% | K% | GB% | FD Pos. | FD Sal. | DK Pos. | DK Sal. | FDRFT Pos. | FDRFT Sal. |
|---|---|---|---|---|---|---|---|---|---|---|---|---|---|---|---|
| 1 | Manuel Margot | RIGHT | 0.287 | 0.296 | 0.125 | 24.8% | 5.8% | 20.1% | 41.3% | OF | $3,400 | OF | $4,400 | CF | $8,100 |
| 2 | Franchy Cordero | LEFT | 0.330 | 0.355 | 0.258 | 45.6% | 6.7% | 39.0% | 42.9% | OF | $3,700 | OF | $4,000 | CF | $7,200 |
| 3 | Wil Myers | RIGHT | 0.335 | 0.325 | 0.224 | 38.6% | 8.9% | 27.0% | 37.2% | OF | $3,800 | 1B/OF | $4,800 | IF/OF | $9,400 |
| 4 | Jose Pirela | RIGHT | 0.325 | 0.300 | 0.159 | 32.3% | 6.8% | 20.4% | 51.5% | OF | $3,300 | OF | $4,300 | IF/OF | $8,400 |
| 5 | Carlos Asuaje | LEFT | 0.322 | 0.287 | 0.106 | 30.8% | 8.6% | 22.9% | 39.7% | 2B | $3,500 | 2B | $3,300 | 2B | $5,600 |
| 6 | Freddy Galvis | SWITCH | 0.310 | 0.296 | 0.132 | 29.0% | 9.3% | 19.5% | 36.1% | SS | $3,500 | SS | $3,400 | SS | $6,700 |
| 7 | Cory Spangenberg | LEFT | 0.341 | 0.305 | 0.166 | 31.9% | 7.8% | 22.8% | 45.2% | 3B | $3,200 | 3B/OF | $3,400 | 2B | $6,400 |
| 8 | Austin Hedges | RIGHT | 0.274 | 0.254 | 0.194 | 31.2% | 5.8% | 30.4% | 36.9% | C | $3,000 | C | $3,200 | C | $6,700 |
| 9 | Tyson Ross | RIGHT | 0.000 | 0.022 | 0.000 | 0.0% | 0.0% | 75.0% | 100.0% | P | $7,200 | P | $6,100 | P | $8,000 |
Elite Plays – Franchy Cordero, Wil Myers
Secondary Plays – Manuel Margot, Jose Pirela, Carlos Asuaje
Stackability – YELLOW
Colorado
Tyson Ross has pitched well this season and he does have the tools needed for Coors Field. He has an above-average strikeout rate and a high ground ball rate. With that said, the Rockies should still be considered the top offense to target in the early slate. Since the beginning of last season, Ross has allowed a .356 xwOBA to left-handed hitters and a .339 xwOBA to right-handed hitters.
Projected Lineup (Splits vs. RH Pitching)
| # | Player | Bats | wOBA | xwOBA | ISO | HC% | BB% | K% | GB% | FD Pos. | FD Sal. | DK Pos. | DK Sal. | FDRFT Pos. | FDRFT Sal. |
|---|---|---|---|---|---|---|---|---|---|---|---|---|---|---|---|
| 1 | DJ LeMahieu | RIGHT | 0.324 | 0.333 | 0.082 | 28.7% | 8.6% | 14.2% | 55.7% | 2B | $4,300 | 2B | $4,700 | 2B | $9,300 |
| 2 | Charlie Blackmon | LEFT | 0.425 | 0.382 | 0.306 | 40.8% | 10.2% | 20.1% | 34.9% | OF | $5,200 | OF | $5,700 | CF | $11,000 |
| 3 | Nolan Arenado | RIGHT | 0.348 | 0.343 | 0.224 | 35.6% | 9.2% | 17.5% | 36.4% | 3B | $5,200 | 3B | $5,500 | 3B | $10,700 |
| 4 | David Dahl | LEFT | OF | $3,600 | OF | $3,500 | LF | $6,900 | |||||||
| 5 | Trevor Story | RIGHT | 0.286 | 0.279 | 0.169 | 36.3% | 7.8% | 34.3% | 34.2% | SS | $4,400 | SS | $4,600 | SS | $8,100 |
| 6 | Chris Iannetta | RIGHT | 0.340 | 0.337 | 0.238 | 38.2% | 10.0% | 29.3% | 33.6% | C | $3,200 | C | $3,500 | C | $6,300 |
| 7 | Ian Desmond | RIGHT | 0.281 | 0.249 | 0.096 | 27.2% | 6.0% | 25.2% | 63.6% | 1B | $3,500 | 1B/OF | $4,200 | LF | $8,100 |
| 8 | Ryan McMahon | LEFT | 0.199 | 0.238 | 0.021 | 15.6% | 11.1% | 29.6% | 71.9% | 3B | $3,000 | 1B/3B | $3,300 | 1B | $6,800 |
| 9 | Jon Gray | RIGHT | 0.190 | 0.170 | 0.138 | 23.1% | 3.1% | 56.3% | 63.6% | P | $7,500 | P | $6,600 | P | $9,100 |
Elite Plays – Charlie Blackmon, Nolan Arenado, David Dahl, Chris Iannetta
Secondary Plays – DJ LeMahieu, Trevor Story
Stackability – GREEN
Washington at San Francisco – 3:45 PM ET
| Washington | San Francisco | ||||||||||||||
 | Max Scherzer |  | Jeff Samardzija | ||||||||||||
| RIGHT | RIGHT | ||||||||||||||
| Vegas Moneyline | Vegas Over/Under | ||||||||||||||
| WAS-140 | 7.0 | ||||||||||||||
| Stats | wOBA | xwOBA | HC% | BB% | K% | GB% | Stats | wOBA | xwOBA | HC% | BB% | K% | GB% | ||
|---|---|---|---|---|---|---|---|---|---|---|---|---|---|---|---|
| SP vs. Left (2016-17) | 0.285 | 0.283 | 26.1% | 8.7% | 28.1% | 32.6% | SP vs. Left (2016-17) | 0.323 | 0.335 | 32.2% | 5.0% | 25.2% | 35.7% | ||
| SP vs. Right (2016-17) | 0.191 | 0.201 | 27.5% | 4.5% | 43.4% | 43.6% | SP vs. Right (2016-17) | 0.289 | 0.274 | 28.3% | 3.2% | 22.8% | 46.5% | ||
Pitcher Grind Down
| Max Scherzer | |||||||||
 | FanDuel | DraftKings | FantasyDraft | ||||||
| Salary: | $11,500 | Salary: | $13,100 | Salary: | $24,600 | ||||
| Salary Rank: | 1 of 30 | Salary Rank: | 2 of 30 | Salary Rank: | 1 of 30 | ||||
| Stats | Starts | SIERA | ERA | K% | BB% | GB% | HC% | SC% | |
|---|---|---|---|---|---|---|---|---|---|
| 2017 | 31 | 2.98 | 2.51 | 34.4% | 7.1% | 36.5% | 26.5% | 19.5% | |
| 2018 | 5 | 2.21 | 1.36 | 37.6% | 5.6% | 39.7% | 27.5% | 26.1% | |
It’s a tough choice for SP1 in the early slate. The way I see it, it’s hard to go wrong with either option. Justin Verlander is pitching at home, but has the tougher matchup. Scherzer is pitching on the road, but in a better ballpark. In five starts this season, Scherzer has a 2.21 SIERA with a strikeout rate of 38%. The Giants aren’t known as a high-strikeout offense, but they do have five batters in their projected lineup with a strikeout rate of at least 22% against right-handed pitching.
Quick Breakdown: It’s really close between Verlander and Scherzer, but I’m giving the slight edge to Mad Max.
| Jeff Samardzija | |||||||||
 | FanDuel | DraftKings | FantasyDraft | ||||||
| Salary: | $8,000 | Salary: | $7,500 | Salary: | $15,800 | ||||
| Salary Rank: | 8 of 30 | Salary Rank: | 9 of 30 | Salary Rank: | 6 of 30 | ||||
| Stats | Starts | SIERA | ERA | K% | BB% | GB% | HC% | SC% | |
|---|---|---|---|---|---|---|---|---|---|
| 2017 | 32 | 3.63 | 4.42 | 24.2% | 3.8% | 41.5% | 30.1% | 20.7% | |
| 2018 | 1 | 6.42 | 0.00 | 19.1% | 19.1% | 15.4% | 38.5% | 7.7% | |
Samardzija is an underdog today, but that doesn’t mean that he doesn’t offer fantasy appeal. He only threw 80 pitches in his season debut, but that number should increase in his second start. He finished the 2017 season with a strikeout rate of 24% and he’s facing a Nationals’ lineup that is missing some key pieces. This game could set up as a pitcher’s duel and I don’t mind pairing the two pitchers in the same lineup.
Quick Breakdown: Samardzija is a viable SP2 in both cash games and tournaments.
Batter Grind Down
Washington
The Nationals are the preferred offense to target in this game, but have very little fantasy appeal in the four-game early slate. We have a game in Coors Field and we have the opportunity to target hitters against James Shields. We don’t need to waste our roster spots on the Nationals, who are facing Jeff Samardzija in the pitcher-friendly AT&T Park. Bryce Harper is worth a look as a one-off target, but he’s the only hitter on my radar in this game.
Projected Lineup (Splits vs. RH Pitching)
| # | Player | Bats | wOBA | xwOBA | ISO | HC% | BB% | K% | GB% | FD Pos. | FD Sal. | DK Pos. | DK Sal. | FDRFT Pos. | FDRFT Sal. |
|---|---|---|---|---|---|---|---|---|---|---|---|---|---|---|---|
| 1 | Trea Turner | RIGHT | 0.346 | 0.330 | 0.178 | 28.5% | 8.0% | 18.2% | 50.8% | SS | $4,100 | SS | $4,500 | IF/OF | $9,200 |
| 2 | Howie Kendrick | RIGHT | 0.353 | 0.314 | 0.162 | 30.3% | 4.9% | 20.8% | 61.7% | 2B | $2,900 | 2B/OF | $3,200 | IF/OF | $6,500 |
| 3 | Bryce Harper | LEFT | 0.449 | 0.436 | 0.345 | 35.8% | 17.8% | 16.6% | 37.3% | OF | $4,900 | OF | $5,400 | RF | $9,700 |
| 4 | Ryan Zimmerman | RIGHT | 0.360 | 0.380 | 0.246 | 40.7% | 7.0% | 24.0% | 45.5% | 1B | $2,900 | 1B | $4,000 | 1B | $7,500 |
| 5 | Matt Adams | LEFT | 0.370 | 0.359 | 0.261 | 38.5% | 8.2% | 24.7% | 36.3% | 1B | $2,200 | 1B/OF | $2,900 | 1B | $5,700 |
| 6 | Matt Wieters | SWITCH | 0.273 | 0.308 | 0.124 | 29.5% | 8.5% | 18.2% | 41.1% | C | $2,300 | C | $2,900 | C | $5,400 |
| 7 | Michael Taylor | RIGHT | 0.321 | 0.292 | 0.196 | 33.5% | 7.1% | 32.0% | 42.2% | OF | $2,700 | OF | $3,600 | CF | $6,600 |
| 8 | Wilmer Difo | SWITCH | 0.281 | 0.269 | 0.068 | 19.1% | 7.7% | 21.2% | 52.6% | 2B | $2,200 | 2B/3B | $2,700 | 2B | $5,400 |
| 9 | Max Scherzer | RIGHT | 0.205 | 0.223 | 0.000 | 16.7% | 5.7% | 17.1% | 62.5% | P | $11,500 | P | $13,100 | P | $24,600 |
Elite Plays – Bryce Harper (GPP)
Secondary Plays – Bryce Harper (Cash)
Stackability – RED
San Francisco
The Giants are an easy fade here. They are playing in a pitcher-friendly ballpark and they are facing one of the best pitchers in baseball. Since the beginning of last season, Max Scherzer has held both left and right-handed hitters under a .285 xwOBA and under a 28% hard contact rate.
Projected Lineup (Splits vs. RH Pitching)
| # | Player | Bats | wOBA | xwOBA | ISO | HC% | BB% | K% | GB% | FD Pos. | FD Sal. | DK Pos. | DK Sal. | FDRFT Pos. | FDRFT Sal. |
|---|---|---|---|---|---|---|---|---|---|---|---|---|---|---|---|
| 1 | Joe Panik | LEFT | 0.343 | 0.333 | 0.164 | 27.0% | 8.4% | 8.4% | 41.3% | 2B | $2,800 | 2B | $3,000 | 2B | $5,600 |
| 2 | Brandon Belt | LEFT | 0.379 | 0.409 | 0.270 | 41.7% | 16.3% | 23.1% | 25.3% | 1B | $3,200 | 1B | $3,600 | IF/OF | $7,600 |
| 3 | Andrew McCutchen | RIGHT | 0.326 | 0.338 | 0.159 | 34.0% | 10.1% | 18.5% | 43.1% | OF | $3,400 | OF | $3,300 | RF | $7,500 |
| 4 | Buster Posey | RIGHT | 0.340 | 0.350 | 0.111 | 30.5% | 9.0% | 12.0% | 46.9% | C | $2,900 | 1B/C | $3,700 | C | $7,700 |
| 5 | Evan Longoria | RIGHT | 0.315 | 0.315 | 0.159 | 35.0% | 4.6% | 15.8% | 43.3% | 3B | $3,300 | 3B | $3,400 | 3B | $6,700 |
| 6 | Brandon Crawford | LEFT | 0.303 | 0.319 | 0.151 | 34.6% | 7.2% | 22.0% | 47.6% | SS | $2,100 | SS | $2,700 | SS | $5,900 |
| 7 | Mac Williamson | RIGHT | 0.252 | 0.212 | 0.140 | 34.2% | 8.1% | 30.6% | 52.6% | OF | $2,500 | OF | $2,600 | RF | $4,600 |
| 8 | Gregor Blanco | LEFT | 0.336 | 0.303 | 0.118 | 28.1% | 14.2% | 22.0% | 44.1% | OF | $2,200 | OF | $2,600 | LF | $5,700 |
| 9 | Jeff Samardzija | RIGHT | 0.118 | 0.159 | 0.095 | 17.2% | 0.0% | 34.1% | 55.6% | P | $8,000 | P | $7,500 | P | $15,800 |
Elite Plays – None
Secondary Plays – None
Stackability – RED
Minnesota at NY Yankees – 6:35 PM ET
| Minnesota | NY Yankees | ||||||||||||||
 | Lance Lynn |  | Sonny Gray | ||||||||||||
| RIGHT | RIGHT | ||||||||||||||
| Vegas Moneyline | Vegas Over/Under | ||||||||||||||
| NYY-170 | 9.0 | ||||||||||||||
| Stats | wOBA | xwOBA | HC% | BB% | K% | GB% | Stats | wOBA | xwOBA | HC% | BB% | K% | GB% | ||
|---|---|---|---|---|---|---|---|---|---|---|---|---|---|---|---|
| SP vs. Left (2016-17) | 0.354 | 0.361 | 31.0% | 14.4% | 15.3% | 45.9% | SP vs. Left (2016-17) | 0.292 | 0.314 | 25.6% | 10.3% | 21.7% | 52.8% | ||
| SP vs. Right (2016-17) | 0.265 | 0.281 | 29.0% | 7.8% | 25.1% | 43.3% | SP vs. Right (2016-17) | 0.306 | 0.325 | 30.1% | 7.8% | 22.3% | 52.6% | ||
Pitcher Grind Down
| Lance Lynn | |||||||||
 | FanDuel | DraftKings | FantasyDraft | ||||||
| Salary: | $6,800 | Salary: | Salary: | ||||||
| Salary Rank: | 15 of 30 | Salary Rank: | of 30 | Salary Rank: | |||||
| Stats | Starts | SIERA | ERA | K% | BB% | GB% | HC% | SC% | |
|---|---|---|---|---|---|---|---|---|---|
| 2017 | 33 | 4.85 | 3.43 | 19.7% | 10.1% | 44.0% | 29.2% | 21.1% | |
| 2018 | 3 | 5.40 | 6.00 | 27.5% | 21.7% | 54.3% | 42.9% | 22.9% | |
Lynn is not a pitcher that should be on our radar in daily fantasy baseball. While he boasts a 28% strikeout rate in his first three starts, I’m not buying it. Throughout his career, his k-rate has been right around the league average. It doesn’t help that he currently has a 22% walk rate and a 43% hard contact rate. He’s an easy fade tonight against the Yankees, who have one of the most potent offenses in baseball.
Quick Breakdown: Avoid Lynn in all formats.
| Sonny Gray | |||||||||
 | FanDuel | DraftKings | FantasyDraft | ||||||
| Salary: | $7,300 | Salary: | Salary: | ||||||
| Salary Rank: | 11 of 30 | Salary Rank: | of 30 | Salary Rank: | |||||
| Stats | Starts | SIERA | ERA | K% | BB% | GB% | HC% | SC% | |
|---|---|---|---|---|---|---|---|---|---|
| 2017 | 27 | 4.08 | 3.55 | 22.6% | 8.4% | 52.8% | 28.0% | 16.8% | |
| 2018 | 4 | 5.02 | 8.27 | 17.4% | 12.8% | 51.7% | 28.8% | 20.3% | |
Gray has not been at his best so far this season, posting a 5.02 SIERA with a strikeout rate of 17% and a walk rate of 13%. While that’s not ideal, I still have more faith in him than I do in Lance Lynn. Gray induces a lot of ground balls and soft contact, he just needs to fix his command. A matchup against the Twins is far from ideal, as they have plenty of power against right-handed pitching and actually draw quite a few walks.
Quick Breakdown: Both offenses are viable here, which means we can avoid both starting pitchers.
Batter Grind Down
Minnesota
The Twins see a favorable ballpark bump playing in Yankee Stadium, but their matchup against Sonny Gray is less than appealing. Even though he is off to a shaky start this season, he still has a high ground ball rate and a low hard contact rate. Over the last two seasons, he has held both left and right-handed hitters under a .325 xwOBA. Brian Dozier, Miguel Sano, and Logan Morrison all stand out as viable tournaments plays, but there are better cash game targets.
Projected Lineup (Splits vs. RH Pitching)
| # | Player | Bats | wOBA | xwOBA | ISO | HC% | BB% | K% | GB% | FD Pos. | FD Sal. | DK Pos. | DK Sal. | FDRFT Pos. | FDRFT Sal. |
|---|---|---|---|---|---|---|---|---|---|---|---|---|---|---|---|
| 1 | Brian Dozier | RIGHT | 0.343 | 0.330 | 0.208 | 32.9% | 10.4% | 20.1% | 38.1% | 2B | $4,300 | N/A | N/A | ||
| 2 | Joe Mauer | LEFT | 0.357 | 0.399 | 0.126 | 40.2% | 12.5% | 13.3% | 49.2% | 1B | $3,000 | N/A | N/A | ||
| 3 | Miguel Sano | RIGHT | 0.343 | 0.346 | 0.229 | 45.1% | 10.3% | 37.9% | 39.4% | 3B | $3,500 | N/A | N/A | ||
| 4 | Eddie Rosario | LEFT | 0.372 | 0.349 | 0.261 | 33.2% | 7.2% | 17.5% | 38.9% | OF | $2,900 | N/A | N/A | ||
| 5 | Logan Morrison | LEFT | 0.355 | 0.374 | 0.279 | 39.1% | 13.2% | 24.9% | 33.4% | 1B | $2,300 | N/A | N/A | ||
| 6 | Eduardo Escobar | SWITCH | 0.331 | 0.333 | 0.218 | 35.3% | 6.3% | 21.4% | 32.3% | SS | $3,100 | N/A | N/A | ||
| 7 | Max Kepler | LEFT | 0.358 | 0.333 | 0.218 | 36.3% | 9.8% | 16.3% | 41.4% | OF | $2,700 | N/A | N/A | ||
| 8 | Ryan LaMarre | RIGHT | 0.469 | 0.306 | 0.000 | 50.0% | 9.1% | 36.4% | 50.0% | OF | $2,200 | N/A | N/A | ||
| 9 | Jason Castro | LEFT | 0.304 | 0.317 | 0.141 | 34.3% | 12.0% | 29.5% | 40.1% | C | $2,200 | N/A | N/A |
Elite Plays – Brian Dozier (GPP)
Secondary Plays – Brian Dozier (Cash), Miguel Sano, Eddie Rosario, Logan Morrison
Stackability – YELLOW
NY Yankees
The Yankees draw an exploitable matchup against Lance Lynn, but it doesn’t set up well for their big power hitters. Gary Sanchez, Aaron Judge, and Giancarlo Stanton are all right-handed and Lynn has held righties to a .281 xwOBA and a 29% hard contact rate over the last two seasons. His biggest weakness has always been left-handed hitters, allowing a .361 xwOBA during that same time frame. Brett Gardner and Didi Gregorius are viable in all formats, while the righties are best suited as part of a full Yankees’ stack.
Projected Lineup (Splits vs. RH Pitching)
| # | Player | Bats | wOBA | xwOBA | ISO | HC% | BB% | K% | GB% | FD Pos. | FD Sal. | DK Pos. | DK Sal. | FDRFT Pos. | FDRFT Sal. |
|---|---|---|---|---|---|---|---|---|---|---|---|---|---|---|---|
| 1 | Brett Gardner | LEFT | 0.353 | 0.330 | 0.180 | 30.9% | 11.3% | 18.6% | 43.6% | OF | $3,600 | N/A | N/A | ||
| 2 | Aaron Judge | RIGHT | 0.438 | 0.443 | 0.349 | 43.9% | 16.4% | 30.2% | 35.6% | OF | $5,300 | N/A | N/A | ||
| 3 | Didi Gregorius | LEFT | 0.371 | 0.317 | 0.251 | 28.1% | 6.5% | 10.9% | 35.3% | SS | $5,000 | N/A | N/A | ||
| 4 | Giancarlo Stanton | RIGHT | 0.377 | 0.372 | 0.304 | 38.2% | 10.7% | 27.3% | 45.5% | OF | $4,900 | N/A | N/A | ||
| 5 | Gary Sanchez | RIGHT | 0.347 | 0.377 | 0.233 | 35.7% | 5.9% | 22.5% | 43.3% | C | $3,900 | N/A | N/A | ||
| 6 | Aaron Hicks | SWITCH | 0.361 | 0.350 | 0.221 | 30.1% | 16.4% | 19.5% | 42.9% | OF | $3,900 | N/A | N/A | ||
| 7 | Tyler Austin | RIGHT | 0.315 | 0.298 | 0.232 | 40.0% | 6.6% | 42.6% | 33.3% | 1B | $3,600 | N/A | N/A | ||
| 8 | Miguel Andujar | RIGHT | 0.418 | 0.395 | 0.368 | 48.5% | 2.5% | 15.0% | 45.5% | 3B | $3,800 | N/A | N/A | ||
| 9 | Gleyber Torres | RIGHT | 2B | $2,700 | N/A | N/A |