MLB Grind Down: Friday, May 20th
The RotoGrinders MLB Grind Down will give you an in-depth analysis into the upcoming MLB schedule. This article will break down the numbers for every single game and give you analysis on which trends you can exploit. While matchups are a major factor in daily fantasy baseball, there are plenty of other factors to consider such as injuries, weather, and salaries.
The analysis should point you in the right direction, but it is still up to you to decipher the information and make your own selections. No sport has more variance than baseball. The best choice is not always the right choice but following the trends will win you money over time.
Note: As always, if you want to try a new DFS site, be sure to click through a RotoGrinders link and use our DraftKings promo code and FanDuel promo code to receive the best perks in the industry.
Atlanta at Philadelphia – 7:05 PM ET
| Atlanta | Philadelphia |
 | |  | |
| RIGHT | RIGHT |
| Vegas Moneyline | Vegas Over/Under |
| PHI -165 | 7.0 |
| Stats | wOBA | HR All. | K% | BB% | Stats | wOBA | HR All. | K% | BB% |
| SP vs. Left | 0.373 | 13 | 11.0% | 10.7% | SP vs. Left | 0.296 | 5 | 18.2% | 7.0% |
| SP vs. Right | 0.277 | 8 | 19.9% | 4.5% | SP vs. Right | 0.255 | 9 | 28.3% | 4.2% |
Pitcher Grind Down
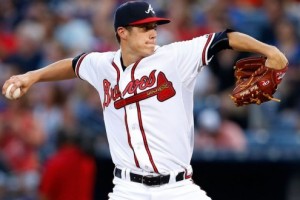
| Matt Wisler |
 | FanDuel | DraftKings |
| Salary: | $6,200 | Salary: | $8,100 |
| FPPG: | 25.4 | FPPG: | 14.1 |
| Pitcher Rating: | 59.5 | Pitcher Rank: | 15 |
| Statistics | Starts | SIERA | ERA | K% | BB% | SS% | GB% | FB% | HH% |
| L14 Days | 2 | 4.84 | 2.93 | 14.5% | 3.2% | 9.1% | 28.0% | 50.0% | 35.3% |
| 2016 | 7 | 4.57 | 3.14 | 16.5% | 5.7% | 7.4% | 35.6% | 47.3% | 36.5% |
| 2015 | 19 | 4.98 | 4.71 | 15.1% | 8.4% | 8.1% | 33.6% | 43.2% | 28.2% |
It’s been a while since we have had a full 15-game evening slate, but we have one tonight. Two of the worst offenses in baseball square off in the first game of the night. Wisler hasn’t pitched nearly as well as his 3.14 ERA on the season would suggest. If you dive a bit deeper, you will see that he has a 4.57 SIERA with a strikeout rate of only 16.5%. While he doesn’t bring a ton of upside to the table, the matchup is certainly in his favor. The Phillies’ offense is currently ranked 28th in team wOBA and 18th in team strikeout rate against right-handed pitching. I prefer his pitching counterpart in this game, but I don’t mind taking a shot or two on Wisler in tournaments.
| Aaron Nola |
 | FanDuel | DraftKings |
| Salary: | $9,000 | Salary: | $11,000 |
| FPPG: | 39.8 | FPPG: | 23.3 |
| Pitcher Rating: | 86.6 | Pitcher Rank: | 3 |
| Statistics | Starts | SIERA | ERA | K% | BB% | SS% | GB% | FB% | HH% |
| L14 Days | 2 | 1.83 | 2.77 | 26.9% | 3.9% | 10.4% | 72.2% | 11.1% | 19.4% |
| 2016 | 8 | 2.57 | 2.89 | 28.6% | 4.4% | 10.1% | 56.0% | 24.6% | 20.6% |
| 2015 | 13 | 3.66 | 3.59 | 21.4% | 6.0% | 8.6% | 47.6% | 32.4% | 28.8% |
Nola is one of my favorite pitching options in the entire slate. He has been tremendous in his first eight starts of the year, posting a 2.57 SIERA with a strikeout rate of 28.6% and a walk rate of 4.4%. If you haven’t been paying attention, Nola is the real deal. He draws arguably the best matchup on the board tonight, as he gets to face the Braves at home. On the season, Atlanta is ranked 29th in team wOBA and 30th in team ISO against right-handed pitching. I wish Nola was a little cheaper on DraftKings, but he is an elite play in all league formats.
Batter Grind Down
Atlanta
The Braves’ organization is a hot mess right now. They fired their manager, they are 10-30 on the season, and they can’t even seem to eat chicken wings without issues. They have the fifth lowest team total on the board, as they square off against in Citizens Bank Park. Outside of in GPPs, the Braves’ offense can be avoided once again.
- Braves Offense (2016)
Team wOBA vs. RHP — 0.286 (29 of 30)
Team ISO vs. RHP — 0.089 (30 of 30)
Team K% vs. RHP — 19.5% (12 of 30)
Runs Per Game — 3.20 (30 of 30)
Projected Run Total — 3.12 (26 of 30)
Projected Lineup
| # | Player | Bats | wOBA vs. RHP | ISO vs. RHP | wOBA L14 | FD Position | FD Salary | DK Position | DK Salary |
| 1 | Chase d’Arnaud | RIGHT | 0.428 | 0.077 | 0.447 | 2B | $2,300 | 3B/SS | $3,300 |
| 2 | | LEFT | 0.344 | 0.092 | 0.256 | OF | $3,100 | OF | $3,300 |
| 3 | | LEFT | 0.381 | 0.225 | 0.358 | 1B | $3,300 | 1B | $3,700 |
| 4 | | LEFT | 0.328 | 0.132 | 0.156 | C | $2,300 | C | $2,700 |
| 5 | | RIGHT | 0.302 | 0.184 | 0.313 | OF | $2,200 | OF | $2,200 |
| 6 | | RIGHT | 0.297 | 0.141 | 0.434 | 2B | $2,500 | 2B/3B | $2,200 |
| 7 | | RIGHT | 0.213 | 0.018 | 0.156 | 2B | $2,200 | 2B/SS | $2,000 |
| 8 | | RIGHT | 0.175 | 0.000 | 0.000 | P | $6,200 | P | $8,100 |
| 9 | | LEFT | 0.370 | 0.232 | 0.334 | OF | $3,000 | OF | $3,300 |
| | Team Averages | — | 0.315 | 0.122 | 0.273 | — | — | — | — |
Elite Plays – NONE
Secondary Plays –
Stackability – NONE
Philadelphia
The Phillies have not fared well against right-handed pitching, ranking in the bottom five of the majors in both team wOBA and team ISO. While they are only projected to score 3.88 runs tonight, that is considerably higher than their season average. has been tough on right-handed hitters, but he has allowed a .373 wOBA and 13 home runs to left-handed hitters over the last two seasons.
- Phillies Offense (2016)
Team wOBA vs. RHP — 0.289 (28 of 30)
Team ISO vs. RHP — 0.129 (27 of 30)
Team K% vs. RHP — 21.2% (18 of 30)
Runs Per Game — 3.32 (29 of 30)
Projected Run Total — 3.88 (21 of 30)
Projected Lineup
| # | Player | Bats | wOBA vs. RHP | ISO vs. RHP | wOBA L14 | FD Position | FD Salary | DK Position | DK Salary |
| 1 | | LEFT | 0.357 | 0.137 | 0.406 | OF | $3,800 | OF | $4,000 |
| 2 | | RIGHT | 0.293 | 0.073 | 0.287 | 2B | $2,700 | 2B | $2,800 |
| 3 | | RIGHT | 0.339 | 0.190 | 0.283 | 3B | $2,800 | 3B | $3,500 |
| 4 | | LEFT | 0.327 | 0.240 | 0.185 | 1B | $2,300 | 1B | $3,500 |
| 5 | | SWITCH | 0.290 | 0.114 | 0.281 | SS | $2,500 | SS | $3,000 |
| 6 | | RIGHT | 0.266 | 0.117 | 0.228 | C | $2,400 | C | $2,500 |
| 7 | | RIGHT | 0.318 | 0.114 | 0.405 | OF | $2,000 | OF | $3,400 |
| 8 | | RIGHT | 0.129 | 0.031 | 0.276 | P | $9,000 | P | $11,000 |
| 9 | | RIGHT | 0.250 | 0.113 | 0.319 | OF | $2,100 | OF | $2,600 |
| | Team Averages | — | 0.285 | 0.125 | 0.297 | — | — | — | — |
Elite Plays – NONE
Secondary Plays – , ,
Stackability – NONE
Colorado at Pittsburgh – 7:05 PM ET
| Colorado | Pittsburgh |
 | |  | |
| RIGHT | RIGHT |
| Vegas Moneyline | Vegas Over/Under |
| PIT -230 | 7.0 |
| Stats | wOBA | HR All. | K% | BB% | Stats | wOBA | HR All. | K% | BB% |
| SP vs. Left | 0.437 | 10 | 10.6% | 13.7% | SP vs. Left | 0.271 | 6 | 24.8% | 6.1% |
| SP vs. Right | 0.346 | 6 | 16.4% | 6.4% | SP vs. Right | 0.278 | 7 | 23.4% | 5.1% |
Pitcher Grind Down
| Eddie Butler |
 | FanDuel | DraftKings |
| Salary: | $5,100 | Salary: | $5,200 |
| FPPG: | 24.8 | FPPG: | 12.2 |
| Pitcher Rating: | 25.2 | Pitcher Rank: | 29 |
| Statistics | Starts | SIERA | ERA | K% | BB% | SS% | GB% | FB% | HH% |
| L14 Days | 2 | 3.69 | 3.27 | 20.0% | 4.4% | 7.3% | 41.2% | 26.5% | 47.1% |
| 2016 | 3 | 3.48 | 4.74 | 20.8% | 3.9% | 8.3% | 45.6% | 29.8% | 42.1% |
| 2015 | 16 | 5.38 | 5.90 | 11.9% | 11.4% | 6.9% | 50.0% | 27.9% | 26.8% |
Butler has pitched better than his ERA leads us to believe, but it’s tough to trust any starter from the Rockies. We saw what happened to last night against the Cardinals. Butler does have a strikeout rate above 20% this season, but I’m not sure that is sustainable with such a low swinging strike rate. As one of the largest underdogs on the schedule tonight, Butler should be avoided in both cash games and GPPs.
| Gerrit Cole |
 | FanDuel | DraftKings |
| Salary: | $10,200 | Salary: | $8,700 |
| FPPG: | 35.3 | FPPG: | 18.5 |
| Pitcher Rating: | 81.9 | Pitcher Rank: | 4 |
| Statistics | Starts | SIERA | ERA | K% | BB% | SS% | GB% | FB% | HH% |
| L14 Days | 2 | 3.07 | 1.29 | 26.4% | 3.8% | 8.5% | 44.4% | 44.4% | 24.3% |
| 2016 | 7 | 3.75 | 3.05 | 23.1% | 7.1% | 8.7% | 42.9% | 36.6% | 31.6% |
| 2015 | 32 | 3.23 | 2.60 | 24.3% | 5.3% | 10.2% | 48.0% | 29.6% | 29.5% |
Cole has been the forgotten ace of the season, at least in DFS. He typically takes the mound on the same days as the best pitchers in baseball, which has led to him getting overlooked. He comes into tonight’s game as the fourth highest rated pitcher and he is arguably the best play (dollar for dollar) on DraftKings. In his first seven starts of the season, he has a 3.75 SIERA with a strikeout rate of 23.1%. The Rockies’ lineup looks scary on paper, but they aren’t nearly as effective on the road as they are in Coors Field.
Batter Grind Down
Colorado
The Rockies spoiled a lot of lineups last night by knocking out after only four innings. While their offense is filled with talented, young players, they aren’t nearly as good on the road as they are at home. They currently have the lowest team total of all 30 teams in action tonight. Colorado should be avoided against , who has held both left and right-handed hitters under a .280 wOBA over the last two seasons.
- Rockies Offense (2016)
Team wOBA vs. RHP — 0.331 (7 of 30)
Team ISO vs. RHP — 0.177 (7 of 30)
Team K% vs. RHP — 18.3% (4 of 30)
Runs Per Game — 5.05 (4 of 30)
Projected Run Total — 2.75 (30 of 30)
Projected Lineup
| # | Player | Bats | wOBA vs. RHP | ISO vs. RHP | wOBA L14 | FD Position | FD Salary | DK Position | DK Salary |
| 1 | | LEFT | 0.354 | 0.174 | 0.379 | OF | $4,100 | OF | $3,600 |
| 2 | | RIGHT | 0.362 | 0.303 | 0.387 | SS | $4,000 | SS | $3,800 |
| 3 | | RIGHT | 0.385 | 0.303 | 0.364 | 3B | $4,200 | 3B | $3,800 |
| 4 | | LEFT | 0.406 | 0.302 | 0.165 | OF | $2,900 | OF | $3,200 |
| 5 | | RIGHT | 0.323 | 0.166 | 0.320 | 1B | $3,200 | 1B | $2,800 |
| 6 | | LEFT | 0.335 | 0.166 | 0.303 | OF | $3,000 | OF | $3,100 |
| 7 | | RIGHT | 0.331 | 0.108 | 0.348 | 2B | $3,200 | 2B | $2,900 |
| 8 | | LEFT | 0.268 | 0.071 | 0.275 | C | $2,400 | C | $2,300 |
| 9 | | RIGHT | 0.038 | 0.000 | 0.000 | P | $5,100 | P | $5,200 |
| | Team Averages | — | 0.311 | 0.177 | 0.282 | — | — | — | — |
Elite Plays – NONE
Secondary Plays – NONE
Stackability – NONE
Pittsburgh
The Pirates don’t hit a ton of home runs, but they have the fifth highest team wOBA against right-handed pitching this season. They draw a favorable matchup tonight against , who has allowed a .437 wOBA to left-handed hitters and a .346 wOBA to right-handed hitters. With the eighth highest team total tonight, there are a number of viable fantasy options in this Pirates’ lineup.
- Pirates Offense (2016)
Team wOBA vs. RHP — 0.339 (5 of 30)
Team ISO vs. RHP — 0.143 (23 of 30)
Team K% vs. RHP — 18.6% (6 of 30)
Runs Per Game — 5.00 (5 of 30)
Projected Run Total — 4.25 (8 of 30)
Projected Lineup
| # | Player | Bats | wOBA vs. RHP | ISO vs. RHP | wOBA L14 | FD Position | FD Salary | DK Position | DK Salary |
| 1 | | LEFT | 0.352 | 0.168 | 0.413 | 1B | $2,900 | 1B | $3,500 |
| 2 | | RIGHT | 0.368 | 0.200 | 0.360 | OF | $4,100 | OF | $4,800 |
| 3 | | LEFT | 0.339 | 0.149 | 0.431 | OF | $3,900 | OF | $5,000 |
| 4 | Jung Ho Kang | RIGHT | 0.366 | 0.194 | 0.431 | 3B | $3,500 | 3B | $3,900 |
| 5 | | RIGHT | 0.355 | 0.157 | 0.350 | OF | $4,000 | OF | $4,800 |
| 6 | | RIGHT | 0.327 | 0.084 | 0.243 | C | $2,900 | C | $3,300 |
| 7 | | RIGHT | 0.306 | 0.106 | 0.308 | 2B | $3,300 | 2B | $3,700 |
| 8 | | RIGHT | 0.264 | 0.064 | 0.279 | SS | $2,600 | SS | $3,000 |
| 9 | | RIGHT | 0.098 | 0.000 | 0.000 | P | $10,200 | P | $8,700 |
| | Team Averages | — | 0.308 | 0.125 | 0.313 | — | — | — | — |
Elite Plays – ,
Secondary Plays – , Jung Ho Kang,
Stackability – Cash & GPP
Tampa Bay at Detroit – 7:08 PM ET
| Tampa Bay | Detroit |
 | |  | |
| RIGHT | RIGHT |
| Vegas Moneyline | Vegas Over/Under |
| DET -110 | 8.5 |
| Stats | wOBA | HR All. | K% | BB% | Stats | wOBA | HR All. | K% | BB% |
| SP vs. Left | 0.306 | 5 | 15.7% | 7.6% | SP vs. Left | 0.313 | 15 | 22.6% | 10.4% |
| SP vs. Right | 0.273 | 3 | 18.1% | 5.1% | SP vs. Right | 0.367 | 22 | 18.8% | 6.6% |
Pitcher Grind Down
| Matt Andriese |
 | FanDuel | DraftKings |
| Salary: | $7,400 | Salary: | $8,500 |
| FPPG: | 46.5 | FPPG: | 28.5 |
| Pitcher Rating: | 47.5 | Pitcher Rank: | 21 |
| Statistics | Starts | SIERA | ERA | K% | BB% | SS% | GB% | FB% | HH% |
| L14 Days | 2 | 4.58 | 0.56 | 14.8% | 5.6% | 8.1% | 45.2% | 40.5% | 28.6% |
| 2016 | 2 | 4.58 | 0.56 | 14.8% | 5.6% | 8.1% | 45.2% | 40.5% | 28.6% |
| 2015 | 8 | 4.02 | 4.11 | 17.4% | 6.4% | 8.6% | 48.1% | 34.8% | 32.9% |
Andriese may have a 0.56 ERA in his first two starts of the season, but it’s hard to trust those numbers. In his last ten major league starts, he has a SIERA well over 4.00 with a strikeout rate under 17%. There will be times when we can give him a harder look in DFS, but tonight is not one of them. He draws a difficult matchup against the Tigers in Comerica Park and can be avoided in all league formats.
| Anibal Sanchez |
 | FanDuel | DraftKings |
| Salary: | $6,800 | Salary: | $7,800 |
| FPPG: | 24.6 | FPPG: | 11.0 |
| Pitcher Rating: | 59.0 | Pitcher Rank: | 18 |
| Statistics | Starts | SIERA | ERA | K% | BB% | SS% | GB% | FB% | HH% |
| L14 Days | 2 | 5.63 | 6.00 | 11.3% | 9.4% | 4.5% | 39.0% | 43.9% | 26.2% |
| 2016 | 8 | 4.82 | 5.91 | 20.2% | 12.4% | 8.4% | 40.0% | 42.4% | 29.7% |
| 2015 | 25 | 4.03 | 4.99 | 20.9% | 7.4% | 9.3% | 40.0% | 39.1% | 27.1% |
Sanchez is having a season to forget. In eight starts, he has a 4.82 SIERA with a strikeout rate of 20.2% and a walk rate of 12.4%. He is a fly ball pitcher that has allowed 37 home runs in his last 33 starts. The Rays may not be the best offense in baseball, but they do have the fourth highest team ISO against right-handed pitching this season. Until he can string together a few quality starts, Sanchez should be avoided in DFS.
Batter Grind Down
Tampa Bay
The Rays come into tonight’s game with the tenth highest team total on the board. They draw a favorable matchup against the struggling , who has allowed a .313 wOBA to left-handed hitters and a .367 wOBA to right-handed hitters over the last two seasons. Plus, as I mentioned above, Sanchez has given up 37 home runs in his last 33 starts.
- Rays Offense (2016)
Team wOBA vs. RHP — 0.309 (19 of 30)
Team ISO vs. RHP — 0.192 (4 of 30)
Team K% vs. RHP — 25.4% (28 of 30)
Runs Per Game — 4.18 (18 of 30)
Projected Run Total — 4.19 (10 of 30)
Projected Lineup
| # | Player | Bats | wOBA vs. RHP | ISO vs. RHP | wOBA L14 | FD Position | FD Salary | DK Position | DK Salary |
| 1 | | RIGHT | 0.317 | 0.126 | 0.365 | OF | $3,300 | OF | $3,300 |
| 2 | | RIGHT | 0.257 | 0.375 | 0.330 | SS | $2,100 | 3B/SS | $2,300 |
| 3 | | RIGHT | 0.307 | 0.159 | 0.371 | 3B | $3,900 | 3B | $3,800 |
| 4 | | RIGHT | 0.319 | 0.201 | 0.428 | 1B | $3,400 | 1B/2B | $3,700 |
| 5 | | RIGHT | 0.319 | 0.181 | 0.364 | OF | $3,200 | OF | $3,700 |
| 6 | | LEFT | 0.306 | 0.173 | 0.393 | 1B | $2,600 | 1B | $3,000 |
| 7 | | RIGHT | 0.287 | 0.120 | 0.396 | OF | $2,700 | OF | $3,100 |
| 8 | | LEFT | 0.328 | 0.186 | 0.299 | OF | $3,400 | OF | $3,500 |
| 9 | | SWITCH | 0.322 | 0.180 | 0.201 | C | $2,000 | C | $2,900 |
| | Team Averages | — | 0.307 | 0.189 | 0.350 | — | — | — | — |
Elite Plays –
Secondary Plays – , , , ,
Stackability – GPP
Detroit
The Tigers haven’t gotten off to the best start this season, but they are ranked inside the top ten in both team wOBA and team ISO against right-handed pitching. They are projected to score 4.31 runs tonight, which gives them the seventh highest total on the board. , , , and all come into the game red hot with at least a .380 wOBA over the last 14 days.
- Tigers Offense (2016)
Team wOBA vs. RHP — 0.333 (6 of 30)
Team ISO vs. RHP — 0.176 (8 of 30)
Team K% vs. RHP — 23.8% (25 of 30)
Runs Per Game — 4.48 (11 of 30)
Projected Run Total — 4.31 (7 of 30)
Projected Lineup
| # | Player | Bats | wOBA vs. RHP | ISO vs. RHP | wOBA L14 | FD Position | FD Salary | DK Position | DK Salary |
| 1 | | RIGHT | 0.340 | 0.147 | 0.493 | 2B | $4,400 | 2B | $5,200 |
| 2 | | RIGHT | 0.364 | 0.241 | 0.454 | OF | $4,000 | OF | $4,900 |
| 3 | | RIGHT | 0.402 | 0.194 | 0.418 | 1B | $4,200 | 1B | $4,600 |
| 4 | | SWITCH | 0.296 | 0.139 | 0.316 | C | $3,100 | 1B | $3,800 |
| 5 | | RIGHT | 0.315 | 0.167 | 0.383 | 3B | $3,600 | 3B | $4,000 |
| 6 | | RIGHT | 0.342 | 0.204 | 0.222 | OF | $3,000 | OF | $3,900 |
| 7 | | RIGHT | 0.309 | 0.092 | 0.527 | OF | $2,800 | OF | $3,700 |
| 8 | | SWITCH | 0.327 | 0.238 | 0.256 | C | $2,500 | C | $3,400 |
| 9 | | RIGHT | 0.283 | 0.056 | 0.190 | SS | $2,300 | SS | $2,900 |
| | Team Averages | — | 0.331 | 0.164 | 0.362 | — | — | — | — |
Elite Plays –
Secondary Plays – , , , ,
Stackability – GPP
Cleveland at Boston – 7:10 PM ET
| Cleveland | Boston |
 | |  | |
| RIGHT | RIGHT |
| Vegas Moneyline | Vegas Over/Under |
| CLE -115 | 9.0 |
| Stats | wOBA | HR All. | K% | BB% | Stats | wOBA | HR All. | K% | BB% |
| SP vs. Left | 0.325 | 13 | 24.3% | 6.4% | SP vs. Left | 0.303 | 6 | 22.5% | 6.0% |
| SP vs. Right | 0.237 | 13 | 30.1% | 4.0% | SP vs. Right | 0.315 | 8 | 18.9% | 6.9% |
Pitcher Grind Down
| Corey Kluber |
 | FanDuel | DraftKings |
| Salary: | $9,600 | Salary: | $9,000 |
| FPPG: | 32.8 | FPPG: | 18.5 |
| Pitcher Rating: | 64.8 | Pitcher Rank: | 9 |
| Statistics | Starts | SIERA | ERA | K% | BB% | SS% | GB% | FB% | HH% |
| L14 Days | 2 | 4.65 | 8.68 | 21.7% | 13.0% | 9.2% | 42.9% | 32.1% | 37.9% |
| 2016 | 8 | 3.37 | 4.30 | 24.5% | 6.1% | 12.6% | 50.0% | 33.1% | 29.7% |
| 2015 | 32 | 2.98 | 3.49 | 27.7% | 5.1% | 12.9% | 42.4% | 35.9% | 27.0% |
Kluber is coming off of two straight disappointing starts. A third could be on the horizon, as he draws one of the toughest matchups in all of baseball. The Red Sox lead the majors in runs scored per game and in team wOBA against right-handed pitching. If this game was being played in Cleveland, it would be a different story, but I want no part of a pitcher facing the Red Sox in Fenway Park right now.
| Clay Buchholz |
 | FanDuel | DraftKings |
| Salary: | $7,300 | Salary: | $6,300 |
| FPPG: | 20.5 | FPPG: | 8.9 |
| Pitcher Rating: | 55.0 | Pitcher Rank: | 19 |
| Statistics | Starts | SIERA | ERA | K% | BB% | SS% | GB% | FB% | HH% |
| L14 Days | 2 | 5.48 | 7.36 | 14.0% | 10.0% | 10.9% | 28.9% | 44.7% | 36.8% |
| 2016 | 8 | 5.04 | 6.11 | 16.1% | 10.1% | 9.0% | 37.8% | 41.3% | 31.0% |
| 2015 | 18 | 3.35 | 3.26 | 22.8% | 4.9% | 10.6% | 48.3% | 30.5% | 23.7% |
Buchholz looks like a completely different pitcher this season. His SIERA, walk rate, fly ball rate, and hard hit contact rate are all up, while his strikeout rate is way down. That’s an awful combination for a pitcher. The Indians are a mediocre offense against right-handed pitching, but they should be able to knock Buchholz around a bit tonight in the hitter-friendly Fenway Park.
Batter Grind Down
Cleveland
The Indians are coming off of a big offensive series against the Reds. They will look to keep their hot streak alive tonight against in Fenway Park. The Indians currently have the second highest team total on the board and their batters make strong plays in both cash games and GPPs. Over the last two seasons, Buchholz has allowed a .303+ wOBA to hitters from both sides of the plate.
- Indians Offense (2016)
Team wOBA vs. RHP — 0.323 (12 of 30)
Team ISO vs. RHP — 0.157 (16 of 30)
Team K% vs. RHP — 22.3% (22 of 30)
Runs Per Game — 4.89 (6 of 30)
Projected Run Total — 4.59 (2 of 30)
Projected Lineup
| # | Player | Bats | wOBA vs. RHP | ISO vs. RHP | wOBA L14 | FD Position | FD Salary | DK Position | DK Salary |
| 1 | | RIGHT | 0.315 | 0.155 | 0.340 | OF | $3,400 | OF | $3,500 |
| 2 | | LEFT | 0.389 | 0.170 | 0.374 | 2B | $3,700 | 2B | $4,400 |
| 3 | | SWITCH | 0.338 | 0.139 | 0.390 | SS | $3,700 | SS | $4,100 |
| 4 | | RIGHT | 0.289 | 0.161 | 0.359 | 1B | $3,200 | 1B | $3,200 |
| 5 | | SWITCH | 0.339 | 0.204 | 0.341 | 1B | $2,900 | 1B | $3,800 |
| 6 | | RIGHT | 0.286 | 0.190 | 0.271 | C | $2,700 | C | $3,500 |
| 7 | | SWITCH | 0.309 | 0.128 | 0.382 | P | $4,000 | 3B/OF | $3,300 |
| 8 | | LEFT | 0.294 | 0.128 | 0.332 | OF | $2,300 | OF | $2,900 |
| 9 | | RIGHT | 0.291 | 0.121 | 0.176 | 3B | $2,000 | 3B | $2,500 |
| | Team Averages | — | 0.317 | 0.155 | 0.329 | — | — | — | — |
Elite Plays – , , ,
Secondary Plays – , ,
Stackability – Cash & GPP
Boston
The Red Sox didn’t have the best offensive series in Kansas City, but not many teams do. Even though they draw a difficult matchup against tonight, they still have the sixth highest team total on the board. I won’t be targeting any Red Sox hitters in cash games, but , , and all have decent numbers against Kluber in the last couple of seasons.
- Red Sox Offense (2016)
Team wOBA vs. RHP — 0.363 (1 of 30)
Team ISO vs. RHP — 0.188 (5 of 30)
Team K% vs. RHP — 19.2% (10 of 30)
Runs Per Game — 5.85 (1 of 30)
Projected Run Total — 4.41 (6 of 30)
Projected Lineup
| # | Player | Bats | wOBA vs. RHP | ISO vs. RHP | wOBA L14 | FD Position | FD Salary | DK Position | DK Salary |
| 1 | | RIGHT | 0.346 | 0.185 | 0.375 | OF | $4,200 | OF | $4,600 |
| 2 | | RIGHT | 0.354 | 0.156 | 0.320 | 2B | $3,600 | 2B | $3,800 |
| 3 | | RIGHT | 0.332 | 0.108 | 0.453 | SS | $4,300 | SS | $4,100 |
| 4 | | LEFT | 0.422 | 0.333 | 0.418 | 1B | $4,200 | 1B | $4,600 |
| 5 | | LEFT | 0.375 | 0.210 | 0.454 | 3B | $3,600 | 1B/3B | $3,800 |
| 6 | | RIGHT | 0.312 | 0.092 | 0.390 | SS | $2,400 | 2B/3B | $2,200 |
| 7 | | RIGHT | 0.280 | 0.127 | 0.317 | C | $2,200 | C | $2,600 |
| 8 | | LEFT | 0.306 | 0.105 | 0.205 | OF | $2,700 | OF | $2,700 |
| 9 | | RIGHT | 0.271 | 0.076 | 0.195 | C | $2,400 | C | $2,200 |
| | Team Averages | — | 0.333 | 0.155 | 0.347 | — | — | — | — |
Elite Plays – NONE
Secondary Plays – , ,
Stackability – NONE
Milwaukee at NY Mets – 7:10 PM ET
| Milwaukee | NY Mets |
 | |  | |
| RIGHT | LEFT |
| Vegas Moneyline | Vegas Over/Under |
| NYM -220 | 7.5 |
| Stats | wOBA | HR All. | K% | BB% | Stats | wOBA | HR All. | K% | BB% |
| SP vs. Left | 0.380 | 11 | 10.6% | 7.3% | SP vs. Left | 0.340 | 0 | 21.8% | 12.8% |
| SP vs. Right | 0.389 | 10 | 14.6% | 9.0% | SP vs. Right | 0.264 | 6 | 24.3% | 3.7% |
Pitcher Grind Down
| Wily Peralta |
 | FanDuel | DraftKings |
| Salary: | $5,900 | Salary: | $4,400 |
| FPPG: | 15.3 | FPPG: | 4.2 |
| Pitcher Rating: | 30.1 | Pitcher Rank: | 28 |
| Statistics | Starts | SIERA | ERA | K% | BB% | SS% | GB% | FB% | HH% |
| L14 Days | 2 | 5.07 | 6.75 | 14.0% | 10.0% | 2.1% | 44.7% | 28.9% | 39.5% |
| 2016 | 8 | 5.06 | 7.30 | 12.8% | 9.2% | 6.3% | 50.0% | 30.6% | 36.9% |
| 2015 | 20 | 4.75 | 4.72 | 12.6% | 7.7% | 6.9% | 51.6% | 28.4% | 32.6% |
Peralta can’t seem to find the strike zone. I watched his entire start against the Padres and there were times when he wasn’t even close. Taking a pitcher with bad command is always a risky proposition in DFS, especially when it isn’t accompanied with a high strikeout rate. Peralta is one of the largest underdogs on the board and he can be avoided in all league formats.
| Steven Matz |
 | FanDuel | DraftKings |
| Salary: | $9,800 | Salary: | $10,500 |
| FPPG: | 39.3 | FPPG: | 20.0 |
| Pitcher Rating: | 88.5 | Pitcher Rank: | 2 |
| Statistics | Starts | SIERA | ERA | K% | BB% | SS% | GB% | FB% | HH% |
| L14 Days | 1 | 3.14 | 3.00 | 20.0% | 4.0% | 11.2% | 61.1% | 22.2% | 26.3% |
| 2016 | 6 | 3.04 | 2.86 | 24.5% | 5.6% | 8.1% | 56.5% | 21.7% | 23.5% |
| 2015 | 6 | 3.63 | 2.27 | 22.8% | 6.7% | 8.3% | 45.5% | 33.7% | 21.2% |
Matz has one of the highest K% to SS% ratios of any pitcher in baseball. He doesn’t generate a lot of swings and misses, but he throws a ton of strikes, which gets him into favorable counts. It’s hard to find anything wrong with his numbers from this season. In six starts, he has a 3.04 SIERA with a strikeout rate of 24.5%. He grades out as the second best pitching option overall and he is considerably cheaper than . The only concern with Matz is a potential pitch count. Manager Terry Collins said that he is going to be conservative with Matz, after he hurt his forearm. He should still pitch well tonight, but he may not have as much upside as Nola or Cole.
Batter Grind Down
Milwaukee
The Brewers are ranked at or below the league average in team wOBA, team ISO, and team strikeout rate against left-handed pitching this season. They come into tonight’s contest with the third lowest total of the 30 teams in action. I will be avoided the Brewers’ offense completely, as has held right-handed hitters to a .264 wOBA over the last two seasons.
- Brewers Offense (2016)
Team wOBA vs. LHP — 0.310 (15 of 30)
Team ISO vs. LHP — 0.127 (21 of 30)
Team K% vs. LHP — 22.4% (19 of 30)
Runs Per Game — 4.32 (14 of 30)
Projected Run Total — 3.06 (28 of 30)
Projected Lineup
| # | Player | Bats | wOBA vs. LHP | ISO vs. LHP | wOBA L14 | FD Position | FD Salary | DK Position | DK Salary |
| 1 | | LEFT | 0.190 | 0.102 | 0.206 | 2B | $2,800 | 2B | $2,200 |
| 2 | | SWITCH | 0.370 | 0.163 | 0.352 | SS | $3,700 | SS | $3,200 |
| 3 | | RIGHT | 0.261 | 0.082 | 0.431 | C | $3,700 | C | $3,300 |
| 4 | | LEFT | 0.282 | 0.133 | 0.428 | OF | $2,500 | OF | $2,900 |
| 5 | | RIGHT | 0.320 | 0.209 | 0.255 | 1B | $3,000 | 1B | $3,300 |
| 6 | | LEFT | 0.350 | 0.000 | 0.253 | OF | $2,500 | OF | $2,000 |
| 7 | | RIGHT | 0.276 | 0.168 | 0.291 | 3B | $2,000 | 2B/3B | $2,100 |
| 8 | | LEFT | 0.222 | 0.000 | 0.346 | OF | $2,000 | OF | $2,500 |
| 9 | | RIGHT | 0.098 | 0.000 | 0.000 | P | $5,900 | P | $4,400 |
| | Team Averages | — | 0.263 | 0.095 | 0.285 | — | — | — | — |
Elite Plays – NONE
Secondary Plays – NONE
Stackability – NONE
NY Mets
The Mets have the fourth highest team total on the board tonight. They draw a favorable matchup against , who has been downright awful so far this season. Over the last two years, Peralta has allowed a .380 wOBA to both left and right-handed hitters. He has also given up 21 home runs in his last 28 starts. The Mets’ offense has been ice cold lately, but they should turn things around in this series.
- Mets Offense (2016)
Team wOBA vs. RHP — 0.328 (8 of 30)
Team ISO vs. RHP — 0.202 (3 of 30)
Team K% vs. RHP — 22.1% (21 of 30)
Runs Per Game — 3.90 (24 of 30)
Projected Run Total — 4.44 (4 of 30)
Projected Lineup
| # | Player | Bats | wOBA vs. RHP | ISO vs. RHP | wOBA L14 | FD Position | FD Salary | DK Position | DK Salary |
| 1 | | LEFT | 0.373 | 0.223 | 0.240 | OF | $3,000 | OF | $4,200 |
| 2 | | RIGHT | 0.341 | 0.146 | 0.270 | 3B | $2,700 | 3B | $3,900 |
| 3 | | LEFT | 0.393 | 0.276 | 0.287 | OF | $3,400 | OF | $3,800 |
| 4 | | RIGHT | 0.384 | 0.276 | 0.409 | OF | $4,100 | OF | $4,900 |
| 5 | | LEFT | 0.355 | 0.235 | 0.244 | 1B | $3,000 | 1B | $4,100 |
| 6 | | SWITCH | 0.336 | 0.187 | 0.272 | 2B | $2,700 | 2B | $3,700 |
| 7 | | SWITCH | 0.322 | 0.162 | 0.281 | SS | $2,700 | SS | $3,200 |
| 8 | | RIGHT | 0.269 | 0.066 | 0.282 | C | $2,200 | C | $2,700 |
| 9 | | LEFT | 0.217 | 0.045 | 0.418 | P | $9,800 | P | $10,500 |
| | Team Averages | — | 0.332 | 0.180 | 0.300 | — | — | — | — |
Elite Plays – , ,
Secondary Plays – , ,
Stackability – Cash & GPP
Are you an incentives member? Come check out the MLB Expert Chat from 5:30 – 6:00 PM ET.
Jump to Page 1 2 3
