MLB Grind Down: Saturday, April 22nd

Jump to Page 1 2 3
The RotoGrinders MLB Grind Down will give you an in-depth analysis into the upcoming MLB schedule. This article will break down the numbers for every single game and give you analysis on which trends you can exploit. While matchups are a major factor in daily fantasy baseball, there are plenty of other factors to consider such as injuries, weather, and salaries.
The analysis should point you in the right direction, but it is still up to you to decipher the information and make your own selections. No sport has more variance than baseball. The best choice is not always the right choice but following the trends will win you money over time.
Note: As always, if you want to try a new DFS site, be sure to click through a RotoGrinders link and use our DraftKings promo code and FanDuel promo code to receive the best perks in the industry.
Stackability Rating System:
GREEN – A viable full stack in cash games and GPPs.
YELLOW – A viable mini-stack in cash games and full stack in GPPs.
ORANGE – A viable stack in large field GPPs.
RED – Not a recommended stack for cash games or GPPs.
Chicago Cubs at Cincinnati – 1:10 PM ET
| Chicago Cubs | Cincinnati | ||||||||||
 | Jake Arrieta |  | Cody Reed | ||||||||
| RIGHT | LEFT | ||||||||||
| Vegas Moneyline | Vegas Over/Under | ||||||||||
| CHC-155 | 8.0 | ||||||||||
| Stats | wOBA | HC% | BB% | K% | GB% | Stats | wOBA | HC% | BB% | K% | GB% |
|---|---|---|---|---|---|---|---|---|---|---|---|
| SP vs. Left (2016-17) | 0.278 | 30.3% | 13.7% | 25.3% | 48.5% | SP vs. Left (2016-17) | 0.321 | 31.7% | 7.1% | 17.9% | 58.5% |
| SP vs. Right (2016-17) | 0.248 | 21.9% | 5.6% | 23.4% | 54.3% | SP vs. Right (2016-17) | 0.395 | 39.3% | 9.6% | 20.6% | 52.3% |
Pitcher Grind Down
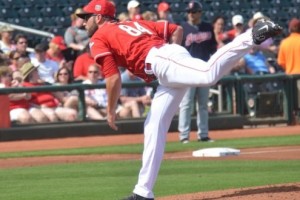
| Jake Arrieta | |||||||||
 | FanDuel | DraftKings | FantasyDraft | ||||||
| Salary: | $10,900 | Salary: | $10,600 | Salary: | $20,700 | ||||
| Salary Rank: | 1 of 29 | Salary Rank: | 2 of 29 | Salary Rank: | 2 of 29 | ||||
| Stats | Starts | SIERA | ERA | K% | BB% | GB% | HC% | SC% | |
|---|---|---|---|---|---|---|---|---|---|
| 2016 | 31 | 3.94 | 3.10 | 23.9% | 9.6% | 52.6% | 25.2% | 22.9% | |
| 2017 | 3 | 2.94 | 2.89 | 28.8% | 6.9% | 43.5% | 28.3% | 26.1% | |
Greetings Grinders, with 15 games on the schedule, every team in baseball is playing today. For the most part, the games are divided into a six-game early slate and a nine-game late slate. The early slate has better pitchers in general while the late slate has a game at Coors field. We’ll kick things off with Jake Arrieta against the Reds.
Arrieta has a 28.8% K rate this season and a 2.89 ERA, which nearly matches his 2.94 SIERA. He’s inducing fewer ground balls this season than last but soft contact is up to 26.1%. He’ll face a Reds team that he pitched a no-hitter against almost exactly one year ago today. The Reds had a 20.1% K rate against right-handers last season. Arrieta is one of the safest options on the board for the early slate.
Quick Breakdown: As a -155 favorite against a Reds lineup that is unlikely to do major damage, Arrieta is one of a few cash game options on the early slate.
| Cody Reed | |||||||||
 | FanDuel | DraftKings | FantasyDraft | ||||||
| Salary: | $5,600 | Salary: | $6,300 | Salary: | $12,400 | ||||
| Salary Rank: | 27 of 29 | Salary Rank: | 19 of 29 | Salary Rank: | 17 of 29 | ||||
| Stats | Starts | SIERA | ERA | K% | BB% | GB% | HC% | SC% | |
|---|---|---|---|---|---|---|---|---|---|
| 2016 | 10 | 4.32 | 7.36 | 18.7% | 8.3% | 51.9% | 39.9% | 16.0% | |
| 2017 | 0 | 2.98 | 0.00 | 32.0% | 16.0% | 76.9% | 7.7% | 30.8% | |
Cody Reed is making his first start this season after making 10 last year. He had a 7.36 ERA last year. Against a potent Cubs offense, we don’t need to consider Reed. The question here is whether we can stack the Cubs against Reed. He’s pitched well out of the bullpen this season having not allowed a run in eight innings of work. He’s induced ground balls at a 76.9% rate, which is bound to regress to around the 50% number we saw last season. This Cubs offense will eventually get to Reed and get at least a few innings against the Reds bullpen.
Quick Breakdown: Cody Reed is not an option but we can consider a couple of Cubs bats.
Batter Grind Down
Chicago Cubs
The Cubs have plenty of bats that can do damage against left-handed pitching. Kris Bryant and Kyle Schwarber are the two best options. Bryant has a .444 wOBA against left-handers while Schwarber checks in at .424. Both also do a good job of avoiding groundballs which matters against Reed. If building a Cubs stack, Addison Russell, Anthony Rizzo and just about anyone else in the lineup are good options. It’s going to be difficult to stack the Cubs and get good pitching on the early slate though.
Projected Lineup (Splits vs. LH Pitching)
| # | Player | Bats | wOBA | ISO | HC% | BB% | K% | GB% | FD Pos. | FD Sal. | DK Pos. | DK Sal. | FDRFT Pos. | FDRFT Sal. |
|---|---|---|---|---|---|---|---|---|---|---|---|---|---|---|
| 1 | Kyle Schwarber | LEFT | 0.424 | 0.308 | 22.2% | 27.8% | 22.2% | 33.3% | OF | $3,600 | OF | $5,000 | IF/OF | $9,900 |
| 2 | Kris Bryant | RIGHT | 0.444 | 0.335 | 40.5% | 13.3% | 19.7% | 29.8% | 3B | $4,100 | 3B | $5,100 | IF/OF | $10,000 |
| 3 | Anthony Rizzo | LEFT | 0.368 | 0.206 | 24.7% | 9.0% | 12.2% | 43.2% | 1B | $4,200 | 1B | $5,100 | 1B | $9,900 |
| 4 | Ben Zobrist | SWITCH | 0.357 | 0.145 | 30.0% | 12.7% | 19.3% | 56.3% | 2B | $2,800 | 2B/OF | $4,800 | IF/OF | $9,200 |
| 5 | Addison Russell | RIGHT | 0.351 | 0.252 | 31.3% | 12.0% | 22.3% | 35.1% | SS | $2,700 | SS | $4,100 | SS | $8,100 |
| 6 | Willson Contreras | RIGHT | 0.364 | 0.186 | 30.4% | 4.4% | 18.7% | 56.5% | C | $2,800 | C | $4,100 | IF/OF | $8,100 |
| 7 | Jason Heyward | LEFT | 0.265 | 0.074 | 22.9% | 10.7% | 18.9% | 48.7% | OF | $2,800 | OF | $3,800 | RF | $7,600 |
| 8 | Jake Arrieta | RIGHT | 0.379 | 0.130 | 16.7% | 7.7% | 46.2% | 36.4% | P | $10,900 | P | $10,600 | P | $20,700 |
| 9 | Javier Baez | RIGHT | 0.342 | 0.149 | 31.8% | 8.7% | 18.7% | 39.8% | 2B | $2,600 | 2B | $4,200 | 3B | $8,100 |
Elite Plays – Kris Bryant and Kyle Schwarber
Secondary Plays – Addison Russell and Anthony Rizzo
Stackability – GREEN – A viable full stack in cash games and GPPs.
Cincinnati
The Reds have one of the lowest implied team totals on the slate. We can pretty much skip right over this offense. The only player on this team that hits right-handers well is Joey Votto but we are talking about a matchup with Jake Arrieta. Let’s move on.
Projected Lineup (Splits vs. RH Pitching)
| # | Player | Bats | wOBA | ISO | HC% | BB% | K% | GB% | FD Pos. | FD Sal. | DK Pos. | DK Sal. | FDRFT Pos. | FDRFT Sal. |
|---|---|---|---|---|---|---|---|---|---|---|---|---|---|---|
| 1 | Billy Hamilton | SWITCH | 0.304 | 0.078 | 18.3% | 8.7% | 19.1% | 47.5% | OF | $3,100 | OF | $4,100 | CF | $8,100 |
| 2 | Arismendy Alcantara | SWITCH | 0.169 | 0.038 | 25.0% | 3.7% | 51.9% | 50.0% | OF | $2,000 | 2B/OF | $3,400 | 2B | $6,800 |
| 3 | Joey Votto | LEFT | 0.419 | 0.249 | 41.3% | 17.3% | 15.1% | 38.0% | 1B | $4,000 | 1B | $4,900 | 1B | $9,600 |
| 4 | Adam Duvall | RIGHT | 0.334 | 0.258 | 38.1% | 6.1% | 26.9% | 33.7% | OF | $3,100 | OF | $4,200 | IF/OF | $8,100 |
| 5 | Eugenio Suarez | RIGHT | 0.310 | 0.148 | 34.4% | 7.5% | 23.5% | 39.2% | 3B | $3,600 | 3B | $3,600 | 3B | $7,200 |
| 6 | Scott Schebler | LEFT | 0.326 | 0.169 | 32.6% | 7.8% | 21.6% | 52.9% | OF | $2,800 | OF | $3,700 | LF | $7,200 |
| 7 | Zack Cozart | RIGHT | 0.330 | 0.163 | 30.2% | 7.9% | 15.9% | 39.4% | SS | $3,100 | SS | $3,500 | SS | $6,900 |
| 8 | Tucker Barnhart | SWITCH | 0.322 | 0.125 | 32.0% | 9.5% | 13.8% | 44.0% | C | $2,200 | C | $2,800 | C | $5,400 |
| 9 | Cody Reed | LEFT | 0.058 | 0.000 | 0.0% | 7.1% | 42.9% | 100.0% | P | $5,600 | P | $6,300 | P | $12,400 |
Elite Plays – None
Secondary Plays – None
Stackability – RED – Not a recommended stack for cash games or GPPs.
Detroit at Minnesota – 2:10 PM ET
| Detroit | Minnesota | ||||||||||
 | Matt Boyd |  | Adalberto Mejia | ||||||||
| LEFT | LEFT | ||||||||||
| Vegas Moneyline | Vegas Over/Under | ||||||||||
| MIN-100 | 9.0 | ||||||||||
| Stats | wOBA | HC% | BB% | K% | GB% | Stats | wOBA | HC% | BB% | K% | GB% |
|---|---|---|---|---|---|---|---|---|---|---|---|
| SP vs. Left (2016-17) | 0.264 | 25.0% | 7.4% | 14.8% | 55.0% | SP vs. Left (2016-17) | 1.060 | 50.0% | 0.0% | 0.0% | 0.0% |
| SP vs. Right (2016-17) | 0.338 | 32.9% | 7.9% | 20.6% | 34.8% | SP vs. Right (2016-17) | 0.365 | 26.7% | 14.6% | 9.8% | 40.0% |
Pitcher Grind Down
| Matt Boyd | |||||||||
 | FanDuel | DraftKings | FantasyDraft | ||||||
| Salary: | $6,700 | Salary: | $6,100 | Salary: | $12,000 | ||||
| Salary Rank: | 21 of 29 | Salary Rank: | 21 of 29 | Salary Rank: | 19 of 29 | ||||
| Stats | Starts | SIERA | ERA | K% | BB% | GB% | HC% | SC% | |
|---|---|---|---|---|---|---|---|---|---|
| 2016 | 18 | 4.38 | 4.53 | 19.9% | 7.0% | 38.1% | 30.0% | 19.2% | |
| 2017 | 3 | 5.00 | 3.77 | 17.7% | 12.9% | 40.5% | 41.9% | 20.9% | |
Picking on the Twins with left-handed pitching is something that was enjoyable last season as they had a 24.3% K rate. That’s come down to 20.4% this season but they are hitting much better with a .307 wOBA. I want nothing to do with Boyd in this spot. He’s walking batters at a 12.9% rate this season and allowing 41.9% hard contact. That’s a recipe for disaster here.
Quick Breakdown: Boyd is a slight underdog in a game with an over/under of nine. He’s one of the worst options you could choose on the early slate.
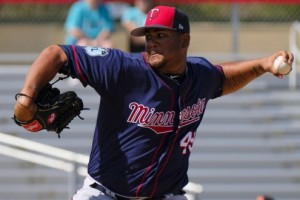
| Adalberto Mejia | |||||||||
 | FanDuel | DraftKings | FantasyDraft | ||||||
| Salary: | $6,400 | Salary: | $5,800 | Salary: | $11,600 | ||||
| Salary Rank: | 24 of 29 | Salary Rank: | 23 of 29 | Salary Rank: | 21 of 29 | ||||
| Stats | Starts | SIERA | ERA | K% | BB% | GB% | HC% | SC% | |
|---|---|---|---|---|---|---|---|---|---|
| 2016 | 0 | 7.02 | 7.71 | 0.0% | 7.7% | 33.3% | 41.7% | 8.3% | |
| 2017 | 2 | 6.18 | 4.05 | 13.3% | 16.7% | 40.0% | 20.0% | 30.0% | |
There isn’t anything to love on the other side of this game either with Adalberto Mejia. In two starts this season he has a 13.3% K rate and a 16.7% BB rate. Meija has a career fly ball rate of 43.8%. He’s outpitching his 6.18 SIERA by almost two runs. He’s definitely not in play against the Tigers.
Quick Breakdown: We can’t consider Meija but the Detroit bats are the top stack on the early slate.
Batter Grind Down
Detroit
Meija has made just two starts this season and both were against the weak-hitting White Sox. He made it just one inning in the first while the second effort was better lasting five innings. We can target batters from either side of the plate in this matchup. Ian Kinsler is the top play here. If Miguel Cabrera were fully healthy he would also be a strong option. He’s day-to-day with a groin strain. Make sure he’s in the lineup if you plan to use him. Nick Castellanos, Tyler Collins and Alex Avila are the other options I would use to fill out my Tigers stack.
Projected Lineup (Splits vs. LH Pitching)
| # | Player | Bats | wOBA | ISO | HC% | BB% | K% | GB% | FD Pos. | FD Sal. | DK Pos. | DK Sal. | FDRFT Pos. | FDRFT Sal. |
|---|---|---|---|---|---|---|---|---|---|---|---|---|---|---|
| 1 | Ian Kinsler | RIGHT | 0.389 | 0.237 | 35.0% | 9.3% | 17.6% | 24.3% | 2B | $3,500 | 2B | $4,800 | 2B | $9,200 |
| 2 | Nick Castellanos | RIGHT | 0.271 | 0.209 | 37.6% | 4.4% | 27.7% | 31.2% | 3B | $3,200 | 3B | $4,000 | 3B | $7,600 |
| 3 | Miguel Cabrera | RIGHT | 0.377 | 0.201 | 42.6% | 14.9% | 19.7% | 40.2% | 1B | $4,100 | 1B | $4,900 | 1B | $9,600 |
| 4 | Victor Martinez | SWITCH | 0.345 | 0.149 | 37.0% | 8.5% | 14.8% | 39.3% | C | $2,700 | 1B | $3,900 | 1B | $7,800 |
| 5 | Justin Upton | RIGHT | 0.317 | 0.194 | 36.8% | 8.5% | 29.6% | 37.7% | OF | $3,400 | OF | $4,600 | LF | $8,800 |
| 6 | Mikie Mahtook | RIGHT | 0.286 | 0.143 | 33.3% | 2.5% | 21.3% | 38.3% | OF | $2,100 | OF | $3,000 | CF | $6,000 |
| 7 | James McCann | RIGHT | 0.364 | 0.292 | 47.2% | 9.0% | 29.2% | 34.5% | C | $2,300 | C | $3,100 | C | $6,000 |
| 8 | JaCoby Jones | RIGHT | 0.210 | 0.192 | 54.6% | 0.0% | 57.7% | 9.1% | OF | $2,000 | OF | $3,100 | IF/OF | $6,000 |
| 9 | Dixon Machado | RIGHT | 0.251 | 0.000 | 40.0% | 22.2% | 22.2% | 20.0% | SS | $2,000 | 2B/SS | $3,000 | SS | $6,000 |
Elite Plays – Ian Kinsler and Nick Castellanos
Secondary Plays – Tyler Collins and Alex Avila
Stackability – GREEN – A viable full stack in cash games and GPPs.
Minnesota
Projected Lineup (Splits vs. LH Pitching)
The Twins, Tigers and Cubs have the three highest team totals on the early slate. Brian Dozier (.371 wOBA), Miguel Sano (.365 wOBA) and Robbie Grossman (.423 wOBA) all mash left-handed pitching. They are the top options here while Joe Mauer, Max Kepler or Jorge Polanco could be thrown into a Twins stack.
| # | Player | Bats | wOBA | ISO | HC% | BB% | K% | GB% | FD Pos. | FD Sal. | DK Pos. | DK Sal. | FDRFT Pos. | FDRFT Sal. |
|---|---|---|---|---|---|---|---|---|---|---|---|---|---|---|
| 1 | Brian Dozier | RIGHT | 0.371 | 0.301 | 39.7% | 9.7% | 20.6% | 32.5% | 2B | $3,500 | 2B | $5,000 | 2B | $9,900 |
| 2 | Robbie Grossman | SWITCH | 0.423 | 0.225 | 37.4% | 12.2% | 21.3% | 41.5% | OF | $3,100 | OF | $3,800 | LF | $7,600 |
| 3 | Joe Mauer | LEFT | 0.263 | 0.085 | 30.1% | 8.5% | 18.4% | 57.3% | 1B | $3,000 | 1B | $3,900 | 1B | $7,600 |
| 4 | Miguel Sano | RIGHT | 0.365 | 0.277 | 40.0% | 14.4% | 32.6% | 35.7% | 3B | $3,500 | 3B | $4,300 | IF/OF | $8,400 |
| 5 | Max Kepler | LEFT | 0.261 | 0.128 | 30.6% | 6.8% | 25.7% | 50.0% | OF | $3,500 | OF | $4,000 | RF | $7,800 |
| 6 | Jorge Polanco | SWITCH | 0.370 | 0.207 | 28.6% | 4.2% | 20.8% | 32.9% | SS | $2,600 | SS | $3,600 | SS | $7,200 |
| 7 | Chris Gimenez | RIGHT | 0.331 | 0.195 | 36.0% | 10.6% | 36.2% | 45.8% | C | $2,200 | C | $3,000 | C | $6,000 |
| 8 | Eddie Rosario | LEFT | 0.251 | 0.022 | 12.9% | 3.9% | 25.5% | 58.2% | OF | $2,600 | OF | $3,700 | LF | $7,200 |
| 9 | Byron Buxton | RIGHT | 0.283 | 0.193 | 33.3% | 8.9% | 37.4% | 30.6% | OF | $2,000 | OF | $3,700 | CF | $7,200 |
Elite Plays – Brian Dozier, and Miguel Sano
Secondary Plays – Robbie Grossman
Stackability – GREEN – A viable full stack in cash games and GPPs.
Seattle at Oakland – 4:05 PM ET
| Seattle | Oakland | ||||||||||
 | Ariel Miranda |  | Jharel Cotton | ||||||||
| LEFT | RIGHT | ||||||||||
| Vegas Moneyline | Vegas Over/Under | ||||||||||
| OAK-122 | 8.0 | ||||||||||
| Stats | wOBA | HC% | BB% | K% | GB% | Stats | wOBA | HC% | BB% | K% | GB% |
|---|---|---|---|---|---|---|---|---|---|---|---|
| SP vs. Left (2016-17) | 0.360 | 34.0% | 10.5% | 14.9% | 51.0% | SP vs. Left (2016-17) | 0.227 | 24.1% | 11.9% | 19.1% | 36.8% |
| SP vs. Right (2016-17) | 0.293 | 35.3% | 6.7% | 20.2% | 29.7% | SP vs. Right (2016-17) | 0.279 | 29.9% | 3.0% | 20.0% | 35.1% |
Pitcher Grind Down
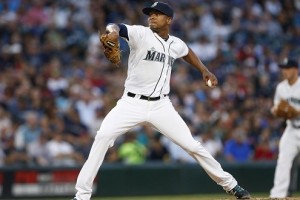
| Ariel Miranda | |||||||||
 | FanDuel | DraftKings | FantasyDraft | ||||||
| Salary: | $7,500 | Salary: | $7,200 | Salary: | $14,400 | ||||
| Salary Rank: | 16 of 29 | Salary Rank: | 16 of 29 | Salary Rank: | 14 of 29 | ||||
| Stats | Starts | SIERA | ERA | K% | BB% | GB% | HC% | SC% | |
|---|---|---|---|---|---|---|---|---|---|
| 2016 | 10 | 4.77 | 3.88 | 19.0% | 7.8% | 31.2% | 37.1% | 17.7% | |
| 2017 | 3 | 3.97 | 3.06 | 19.2% | 6.9% | 45.1% | 28.3% | 26.4% | |
The third game on the early slate features an over/under of eight. Ariel Miranda isn’t a high-upside option but he might be usable in this spot. He only has a 19.2% K rate on the season. Oakland did a great job of not striking out against left-handers last year at just 18.9% (27th in MLB). This season, Miranda is struggling with left-handers, striking them out just 4.5% of the time. He also had reverse splits last year with a .372 wOBA to LH versus to.297 to RH. The Athletics don’t really have many great lefties though.
Quick Breakdown: – Even as a slight underdog, Miranda is in play as an SP2.
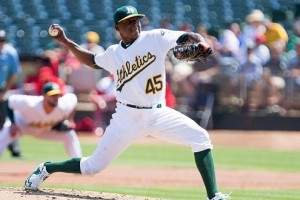
| Jharel Cotton | |||||||||
 | FanDuel | DraftKings | FantasyDraft | ||||||
| Salary: | $7,300 | Salary: | $7,800 | Salary: | $15,000 | ||||
| Salary Rank: | 18 of 29 | Salary Rank: | 12 of 29 | Salary Rank: | 12 of 29 | ||||
| Stats | Starts | SIERA | ERA | K% | BB% | GB% | HC% | SC% | |
|---|---|---|---|---|---|---|---|---|---|
| 2016 | 5 | 4.02 | 2.15 | 20.5% | 3.6% | 37.6% | 28.2% | 22.4% | |
| 2017 | 3 | 4.93 | 5.40 | 18.1% | 12.5% | 32.7% | 26.0% | 24.0% | |
On the other side of this game, we have Jharel Cotton. Using wOBA as a metric, the Mariners were a top 10 offense versus right-handed pitching last season. They did have a K rate of 20.1% though. Jharel Cotton is not an exciting option. He’s pitched one great game this season against the Royals and two really bad ones against the Angels and Rangers. He’s walking too many batters (12.7%) and allowing too much hard contact (26%) for me to have any interest here.
Quick Breakdown: I’m not going out my way to use Mariner bats but Cotton is low on my list of SP options. He’s a fringe SP2 at best.
Batter Grind Down
Jharel Cotton doesn’t have much of a major league sample size. He has shown reverse splits in 28 innings last season and 16 innings this season. My preferred option here would be Mitch Haniger who has been red-hot to start the season. He owns a .369 wOBA against RH pitching. None of the other Mariner bats stand out here when compared to options on the Twins, Tigers and Cubs.
Seattle
Projected Lineup (Splits vs. RH Pitching)
| # | Player | Bats | wOBA | ISO | HC% | BB% | K% | GB% | FD Pos. | FD Sal. | DK Pos. | DK Sal. | FDRFT Pos. | FDRFT Sal. |
|---|---|---|---|---|---|---|---|---|---|---|---|---|---|---|
| 1 | Jarrod Dyson | LEFT | 0.300 | 0.098 | 16.6% | 7.8% | 11.5% | 53.8% | OF | $3,100 | OF | $3,100 | CF | $6,000 |
| 2 | Mitch Haniger | RIGHT | 0.369 | 0.213 | 37.4% | 11.5% | 19.1% | 39.3% | OF | $2,800 | OF | $3,600 | LF | $7,200 |
| 3 | Robinson Cano | LEFT | 0.389 | 0.263 | 37.4% | 8.2% | 12.7% | 43.3% | 2B | $3,500 | 2B | $4,300 | 2B | $8,400 |
| 4 | Nelson Cruz | RIGHT | 0.359 | 0.217 | 34.0% | 8.6% | 24.8% | 44.6% | OF | $3,900 | OF | $4,500 | RF | $8,800 |
| 5 | Kyle Seager | LEFT | 0.379 | 0.215 | 39.0% | 12.3% | 15.0% | 34.9% | 3B | $3,700 | 3B | $4,000 | 3B | $7,600 |
| 6 | Taylor Motter | RIGHT | 0.301 | 0.236 | 34.9% | 10.0% | 24.0% | 40.9% | SS | $3,000 | SS | $3,300 | SS | $6,600 |
| 7 | Danny Valencia | RIGHT | 0.308 | 0.133 | 29.3% | 7.1% | 24.2% | 44.1% | 1B | $2,500 | 1B | $3,400 | 3B | $6,600 |
| 8 | Leonys Martin | LEFT | 0.278 | 0.121 | 29.7% | 8.7% | 25.5% | 43.0% | OF | $2,900 | OF | $3,300 | CF | $6,600 |
| 9 | Mike Zunino | RIGHT | 0.313 | 0.227 | 34.3% | 6.6% | 34.3% | 27.7% | C | $2,300 | C | $3,000 | C | $6,000 |
Elite Plays – Mitch Haniger
Secondary Plays – None
Stackability – ORANGE – A viable stack in large field GPPs.
Oakland
Ariel Miranda has a 45.1% ground ball rate this season to go with a 26.4% soft contact rate. The only Oakland bats I would look at are the cheaper ones. Adam Rosales could make sense as a punt play while Yonder Alonso is a tournament dart-throw given Miranda’s inability to strikeout lefties this season. Both are secondary options at best though.
Projected Lineup (Splits vs. LH Pitching)
| # | Player | Bats | wOBA | ISO | HC% | BB% | K% | GB% | FD Pos. | FD Sal. | DK Pos. | DK Sal. | FDRFT Pos. | FDRFT Sal. |
|---|---|---|---|---|---|---|---|---|---|---|---|---|---|---|
| 1 | Rajai Davis | RIGHT | 0.284 | 0.131 | 24.8% | 7.8% | 23.0% | 40.1% | OF | $3,000 | OF | $3,900 | CF | $7,600 |
| 2 | Adam Rosales | RIGHT | 0.361 | 0.234 | 41.5% | 13.6% | 37.1% | 39.1% | 2B | $2,500 | 2B/3B | $2,500 | 3B | $4,800 |
| 3 | Jed Lowrie | SWITCH | 0.301 | 0.040 | 25.3% | 8.2% | 16.4% | 41.0% | 2B | $2,300 | 2B | $3,000 | 2B | $6,000 |
| 4 | Khris Davis | RIGHT | 0.366 | 0.281 | 38.0% | 9.6% | 25.1% | 42.6% | OF | $3,600 | OF | $4,100 | LF | $8,100 |
| 5 | Ryon Healy | RIGHT | 0.392 | 0.244 | 35.6% | 2.2% | 18.5% | 38.4% | 1B | $3,400 | 1B/3B | $3,600 | 3B | $7,200 |
| 6 | Trevor Plouffe | RIGHT | 0.305 | 0.179 | 41.2% | 8.4% | 27.1% | 47.1% | 3B | $3,000 | 3B | $3,700 | 3B | $7,200 |
| 7 | Yonder Alonso | LEFT | 0.282 | 0.145 | 25.8% | 7.1% | 14.1% | 50.8% | 1B | $2,400 | 1B | $3,100 | 1B | $6,000 |
| 8 | Josh Phegley | RIGHT | 0.273 | 0.085 | 42.5% | 5.9% | 13.7% | 42.5% | C | $2,300 | C | $3,200 | C | $6,300 |
| 9 | Jaff Decker | LEFT | 0.196 | 0.000 | 27.3% | 5.9% | 29.4% | 27.3% | OF | $2,400 | OF | $2,200 | LF | $4,300 |
Elite Plays – None
Secondary Plays – Adam Rosales and Yonder Alonso
Stackability – ORANGE – A viable stack in large field GPPs.
Washington at NY Mets – 4:05 PM ET
| Washington | NY Mets | ||||||||||
 | Gio Gonzalez |  | Jacob deGrom | ||||||||
| LEFT | RIGHT | ||||||||||
| Vegas Moneyline | Vegas Over/Under | ||||||||||
| NYM-120 | 7.5 | ||||||||||
| Stats | wOBA | HC% | BB% | K% | GB% | Stats | wOBA | HC% | BB% | K% | GB% |
|---|---|---|---|---|---|---|---|---|---|---|---|
| SP vs. Left (2016-17) | 0.277 | 28.4% | 5.8% | 18.5% | 57.1% | SP vs. Left (2016-17) | 0.263 | 28.5% | 5.8% | 24.2% | 45.3% |
| SP vs. Right (2016-17) | 0.323 | 33.3% | 7.9% | 22.9% | 44.1% | SP vs. Right (2016-17) | 0.318 | 31.9% | 6.1% | 24.6% | 49.1% |
Pitcher Grind Down
| Gio Gonzalez | |||||||||
 | FanDuel | DraftKings | FantasyDraft | ||||||
| Salary: | $9,200 | Salary: | $9,500 | Salary: | $18,300 | ||||
| Salary Rank: | 4 of 29 | Salary Rank: | 5 of 29 | Salary Rank: | 5 of 29 | ||||
| Stats | Starts | SIERA | ERA | K% | BB% | GB% | HC% | SC% | |
|---|---|---|---|---|---|---|---|---|---|
| 2016 | 32 | 3.96 | 4.57 | 22.4% | 7.7% | 47.6% | 32.7% | 18.1% | |
| 2017 | 3 | 3.91 | 1.33 | 18.3% | 4.9% | 41.4% | 27.9% | 24.6% | |
I wish Gio Gonzalez were just a bit cheaper. I almost want to take a chance on him against a Mets lineup that is watered down by injury. Gonzalez has a 1.33 ERA through three starts this season. He’s doing a lot better at limiting walks this season (4.4%). The Mets have a .377 wOBA against left-handers this season but they will be without Lucas Duda and Yoenis Cespedes today while Asdrubal Cabrera missed yesterday’s game with a leg injury. If Cabrera misses today’s game and Gonzalez can navigate around Neil Walker and Jose Reyes he could have a decent outing.
Quick Breakdown: At his elevated price, Gio Gonzalez is best suited for tournaments. Keep an eye on the Mets lineup though.
| Jacob deGrom | |||||||||
 | FanDuel | DraftKings | FantasyDraft | ||||||
| Salary: | $10,500 | Salary: | $9,900 | Salary: | $19,200 | ||||
| Salary Rank: | 2 of 29 | Salary Rank: | 4 of 29 | Salary Rank: | 4 of 29 | ||||
| Stats | Starts | SIERA | ERA | K% | BB% | GB% | HC% | SC% | |
|---|---|---|---|---|---|---|---|---|---|
| 2016 | 24 | 3.66 | 3.04 | 23.7% | 6.0% | 45.6% | 31.3% | 19.0% | |
| 2017 | 3 | 2.32 | 1.89 | 30.6% | 5.6% | 60.9% | 19.6% | 30.4% | |
Jacob deGrom missed his start yesterday due to a stiff neck. deGrom is pitching great this season with a 30.6% K rate, 5.6% BB rate and 60.9% GB rate. By the numbers, deGrom is one of the best pitchers going today. He’s going up against a very tough Washington offense though. The Nationals have a .37 wOBA this season which is the best in baseball. They also strikeout just 18.3% of the time.
Quick Breakdown: Concerns about deGrom’s stiff neck plus a tough matchup have me looking elsewhere.
Batter Grind Down
Washington
While I don’t plan to use deGrom, he’s also not someone I’m interested in targeting. We aren’t getting any kind of discount on the Nationals’ batters here. About the only thing I would consider here is some sort of long-shot tournament stack. There’s still a very low probability of that working out given deGrom’s ground ball tendencies and strikeout rate.
Projected Lineup (Splits vs. RH Pitching)
| # | Player | Bats | wOBA | ISO | HC% | BB% | K% | GB% | FD Pos. | FD Sal. | DK Pos. | DK Sal. | FDRFT Pos. | FDRFT Sal. |
|---|---|---|---|---|---|---|---|---|---|---|---|---|---|---|
| 1 | Trea Turner | RIGHT | 0.397 | 0.244 | 34.0% | 4.3% | 18.8% | 43.5% | SS | $3,700 | OF/SS | $4,600 | IF/OF | $9,000 |
| 2 | Adam Eaton | LEFT | 0.352 | 0.164 | 31.9% | 9.1% | 17.4% | 50.2% | OF | $3,700 | OF | $4,000 | CF | $7,800 |
| 3 | Bryce Harper | LEFT | 0.368 | 0.221 | 35.2% | 18.7% | 15.6% | 38.7% | OF | $4,800 | OF | $5,200 | RF | $10,200 |
| 4 | Daniel Murphy | LEFT | 0.415 | 0.255 | 40.2% | 5.8% | 9.2% | 35.1% | 2B | $3,400 | 2B | $4,300 | 2B | $8,400 |
| 5 | Ryan Zimmerman | RIGHT | 0.298 | 0.164 | 33.3% | 5.0% | 23.8% | 44.9% | 1B | $3,400 | 1B | $3,300 | 1B | $6,600 |
| 6 | Anthony Rendon | RIGHT | 0.331 | 0.173 | 35.2% | 8.2% | 18.8% | 37.0% | 3B | $3,000 | 3B | $3,800 | 3B | $7,600 |
| 7 | Matt Wieters | SWITCH | 0.319 | 0.183 | 32.1% | 7.0% | 17.3% | 37.2% | C | $2,900 | C | $3,100 | C | $6,000 |
| 8 | Michael Taylor | RIGHT | 0.249 | 0.114 | 31.1% | 5.0% | 28.1% | 45.2% | OF | $2,100 | OF | $3,400 | CF | $6,800 |
| 9 | Gio Gonzalez | LEFT | 0.166 | 0.043 | 16.7% | 1.9% | 40.7% | 50.0% | P | $9,200 | P | $9,500 | P | $18,300 |
Elite Plays – None
Secondary Plays – None
Stackability – RED – Not a recommended stack for cash games or GPPs.
NY Mets
Not surprisingly, I don’t have much interest in the Mets either. Neil Walker and Jose Reyes are likely to be the best options here. Both are switch hitters that hit LH pitching at close to a .420 wOBA. With that said, Gio Gonzalez is pitching well and there’s no reason to target him in cash games.
Projected Lineup (Splits vs. LH Pitching)
| # | Player | Bats | wOBA | ISO | HC% | BB% | K% | GB% | FD Pos. | FD Sal. | DK Pos. | DK Sal. | FDRFT Pos. | FDRFT Sal. |
|---|---|---|---|---|---|---|---|---|---|---|---|---|---|---|
| 1 | Curtis Granderson | LEFT | 0.305 | 0.190 | 35.2% | 7.0% | 23.8% | 38.4% | OF | $2,700 | OF | $3,900 | CF | $7,600 |
| 2 | Asdrubal Cabrera | SWITCH | 0.346 | 0.144 | 38.2% | 6.3% | 16.7% | 44.5% | SS | $3,300 | SS | $3,700 | SS | $7,200 |
| 3 | Neil Walker | SWITCH | 0.419 | 0.261 | 38.2% | 9.2% | 13.0% | 33.7% | 2B | $3,000 | 2B | $3,600 | 2B | $7,200 |
| 4 | Jay Bruce | LEFT | 0.283 | 0.189 | 32.3% | 5.3% | 22.9% | 37.1% | OF | $3,800 | OF | $3,600 | RF | $7,200 |
| 5 | Jose Reyes | SWITCH | 0.417 | 0.290 | 35.9% | 13.9% | 12.5% | 38.5% | 3B | $2,200 | 3B | $3,400 | SS | $6,800 |
| 6 | Juan Lagares | RIGHT | 0.276 | 0.079 | 21.9% | 6.0% | 15.7% | 42.9% | OF | $2,000 | OF | $2,800 | CF | $5,400 |
| 7 | T.J. Rivera | RIGHT | 0.210 | 0.000 | 32.0% | 5.0% | 32.5% | 40.0% | 3B | $2,300 | 2B/3B | $3,000 | 3B | $6,000 |
| 8 | Rene Rivera | RIGHT | 0.396 | 0.186 | 41.4% | 14.0% | 28.0% | 41.4% | C | $2,100 | C | $2,300 | C | $4,400 |
| 9 | Jacob deGrom | RIGHT | 0.000 | 0.000 | 0.0% | 0.0% | 61.5% | 100.0% | P | $10,500 | P | $9,900 | P | $19,200 |
Elite Plays – None
Secondary Plays – None
Stackability – RED – Not a recommended stack for cash games or GPPs.
NY Yankees at Pittsburgh – 4:05 PM ET
| NY Yankees | Pittsburgh | ||||||||||
 | Michael Pineda |  | Jameson Taillon | ||||||||
| RIGHT | RIGHT | ||||||||||
| Vegas Moneyline | Vegas Over/Under | ||||||||||
| PIT-102 | 7.0 | ||||||||||
| Stats | wOBA | HC% | BB% | K% | GB% | Stats | wOBA | HC% | BB% | K% | GB% |
|---|---|---|---|---|---|---|---|---|---|---|---|
| SP vs. Left (2016-17) | 0.342 | 35.3% | 8.1% | 28.5% | 44.4% | SP vs. Left (2016-17) | 0.306 | 31.8% | 5.8% | 16.9% | 51.5% |
| SP vs. Right (2016-17) | 0.319 | 30.0% | 5.3% | 27.3% | 47.3% | SP vs. Right (2016-17) | 0.287 | 33.3% | 3.8% | 24.0% | 54.5% |
Pitcher Grind Down
| Michael Pineda | |||||||||
 | FanDuel | DraftKings | FantasyDraft | ||||||
| Salary: | $9,100 | Salary: | $10,100 | Salary: | $19,600 | ||||
| Salary Rank: | 5 of 29 | Salary Rank: | 3 of 29 | Salary Rank: | 3 of 29 | ||||
| Stats | Starts | SIERA | ERA | K% | BB% | GB% | HC% | SC% | |
|---|---|---|---|---|---|---|---|---|---|
| 2016 | 32 | 3.40 | 4.82 | 27.4% | 7.0% | 45.8% | 32.7% | 17.2% | |
| 2017 | 3 | 1.94 | 3.44 | 32.9% | 1.4% | 48.9% | 28.3% | 13.0% | |
The Yankees and Pirates have the lowest over/under on the early slate at just seven runs. Both pitchers in this game are in play. We’ll start with Pineda who’s numbers say he’s an ace. He has a 32.9% K rate to go with a 1.4% BB rate. The only knock on Pineda is that sometimes he seems to lose focus and give up a home run. Using wOBA as a metric, the Pirates are a bottom-five offense this season at .291. The only knock on Pineda today is that the Pirates strikeout just 16.2% of the time against right-handed pitching. That’s best in the league.
*Quick Breakdown:*Even though the Pirates don’t strikeout often, Pineda is right up there with Jake Arrieta as the best option on the early slate.
| Jameson Taillon | |||||||||
 | FanDuel | DraftKings | FantasyDraft | ||||||
| Salary: | $8,400 | Salary: | $9,200 | Salary: | $17,700 | ||||
| Salary Rank: | 7 of 29 | Salary Rank: | 6 of 29 | Salary Rank: | 6 of 29 | ||||
| Stats | Starts | SIERA | ERA | K% | BB% | GB% | HC% | SC% | |
|---|---|---|---|---|---|---|---|---|---|
| 2016 | 18 | 3.61 | 3.38 | 20.3% | 4.1% | 52.4% | 33.2% | 17.3% | |
| 2017 | 3 | 3.65 | 0.90 | 20.0% | 8.8% | 55.4% | 28.6% | 19.6% | |
Jameson Taillon comes into today’s game sporting a 0.9 ERA. He’s already shut down the Cubs and Red Sox offenses this season. He’s sporting a 55.4% groundball rate to go with a 20% K rate and an 8.8% BB rate. The Yankees have been a decent offense against right-handed pitching this season with a .350 wOBA. I still like Taillon as an SP2 here though given the other options.
Quick Breakdown: On one pitcher sites like FD, I’m paying up for the safety that Arrieta or Pineda offer. On two pitcher sites like DK, Taillion is an option, though I may spend the extra $300 to get Gio Gonzalez if the Mets lineup looks favorable.
Batter Grind Down
Given Taillion’s groundball tendencies, I’m not going out of my way to target Yankees today. Chase Headley has a .340 wOBA against right-handed pitching but he also hits ground balls at 42.5%. I don’t see anyone here that projects out better than the options on the top three offenses (Tigers, Twins, and Cubs).
NY Yankees
Projected Lineup (Splits vs. RH Pitching)
| # | Player | Bats | wOBA | ISO | HC% | BB% | K% | GB% | FD Pos. | FD Sal. | DK Pos. | DK Sal. | FDRFT Pos. | FDRFT Sal. |
|---|---|---|---|---|---|---|---|---|---|---|---|---|---|---|
| 1 | Brett Gardner | LEFT | 0.330 | 0.105 | 25.9% | 13.1% | 16.7% | 51.1% | OF | $3,100 | OF | $3,800 | LF | $7,600 |
| 2 | Chase Headley | SWITCH | 0.340 | 0.172 | 31.7% | 11.2% | 25.6% | 42.5% | 3B | $3,600 | 3B | $3,200 | 3B | $6,300 |
| 3 | Jacoby Ellsbury | LEFT | 0.326 | 0.125 | 27.5% | 9.5% | 12.6% | 47.2% | OF | $3,400 | OF | $3,700 | CF | $7,200 |
| 4 | Starlin Castro | RIGHT | 0.323 | 0.167 | 30.7% | 3.9% | 18.9% | 50.3% | 2B | $3,200 | 2B | $3,500 | 2B | $6,800 |
| 5 | Aaron Judge | RIGHT | 0.331 | 0.264 | 50.0% | 8.2% | 36.9% | 42.4% | OF | $3,500 | OF | $3,700 | RF | $7,200 |
| 6 | Greg Bird | LEFT | 0.237 | 0.167 | 50.0% | 10.0% | 35.0% | 28.6% | 1B | $2,700 | 1B | $3,400 | 1B | $6,800 |
| 7 | Austin Romine | RIGHT | 0.287 | 0.140 | 24.4% | 5.9% | 17.6% | 40.3% | C | $2,600 | C | $2,700 | C | $5,200 |
| 8 | Ronald Torreyes | RIGHT | 0.311 | 0.155 | 22.7% | 2.5% | 9.9% | 48.6% | 3B | $2,500 | SS | $2,500 | SS | $4,800 |
| 9 | Michael Pineda | RIGHT | 0.000 | 0.000 | 0.0% | 0.0% | 100.0% | 0.0% | P | $9,100 | P | $10,100 | P | $19,600 |
Elite Plays – None
Secondary Plays – Chase Headley
Stackability – ORANGE – A viable stack in large field GPPs.
Pittsburgh
Similar to above, I don’t see any reason to use Pirate bats against Pineda. They rank 25th in wOBA on the season. The best case scenario would be finding a low-owned home run. Even that isn’t very likely as the Pirates have just 13 home runs on the season.
Projected Lineup (Splits vs. RH Pitching)
| # | Player | Bats | wOBA | ISO | HC% | BB% | K% | GB% | FD Pos. | FD Sal. | DK Pos. | DK Sal. | FDRFT Pos. | FDRFT Sal. |
|---|---|---|---|---|---|---|---|---|---|---|---|---|---|---|
| 1 | Jordy Mercer | RIGHT | 0.288 | 0.096 | 24.4% | 7.5% | 14.8% | 50.7% | SS | $2,200 | SS | $3,100 | SS | $6,000 |
| 2 | Josh Harrison | RIGHT | 0.291 | 0.088 | 26.0% | 3.7% | 14.0% | 45.6% | 2B | $2,900 | 2B/3B | $3,600 | 2B | $7,200 |
| 3 | Andrew McCutchen | RIGHT | 0.327 | 0.165 | 35.5% | 9.2% | 21.7% | 36.2% | OF | $3,500 | OF | $4,300 | RF | $8,400 |
| 4 | Gregory Polanco | LEFT | 0.329 | 0.192 | 35.8% | 9.2% | 17.6% | 39.1% | OF | $3,200 | OF | $4,200 | LF | $8,100 |
| 5 | David Freese | RIGHT | 0.321 | 0.130 | 32.2% | 8.7% | 26.8% | 59.8% | 3B | $2,500 | 3B | $3,100 | 3B | $6,000 |
| 6 | Francisco Cervelli | RIGHT | 0.310 | 0.091 | 26.4% | 13.3% | 18.2% | 54.3% | C | $2,600 | C | $3,100 | C | $6,000 |
| 7 | Josh Bell | SWITCH | 0.356 | 0.159 | 33.3% | 13.6% | 12.3% | 49.2% | 1B | $2,400 | 1B | $3,200 | IF/OF | $6,300 |
| 8 | Adam Frazier | LEFT | 0.335 | 0.146 | 31.8% | 7.6% | 16.3% | 40.3% | SS | $2,500 | 2B/OF | $3,100 | IF/OF | $6,000 |
| 9 | Jameson Taillon | RIGHT | 0.059 | 0.000 | 11.1% | 0.0% | 47.1% | 61.5% | P | $8,400 | P | $9,200 | P | $17,700 |