MLB Grind Down: Sunday, May 14th

Jump to Page 1 2 3
The RotoGrinders MLB Grind Down will give you an in-depth analysis into the upcoming MLB schedule. This article will break down the numbers for every single game and give you analysis on which trends you can exploit. While matchups are a major factor in daily fantasy baseball, there are plenty of other factors to consider such as injuries, weather, and salaries.
The analysis should point you in the right direction, but it is still up to you to decipher the information and make your own selections. No sport has more variance than baseball. The best choice is not always the right choice but following the trends will win you money over time.
Note: As always, if you want to try a new DFS site, be sure to click through a RotoGrinders link and use our DraftKings promo code, FanDuel promo code, and FantasyDraft promo code to receive the best perks in the industry.
Stackability Rating System:
GREEN – A viable full stack in cash games and GPPs.
YELLOW – A viable mini-stack in cash games and full stack in GPPs.
ORANGE – A viable stack in large field GPPs.
RED – Not a recommended stack for cash games or GPPs.
Seattle at Toronto – 1:07 PM ET
| Seattle | Toronto | ||||||||||||||
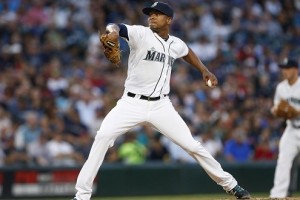
 | Ariel Miranda |  | Aaron Sanchez | ||||||||||||
| LEFT | RIGHT | ||||||||||||||
| Vegas Moneyline | Vegas Over/Under | ||||||||||||||
| TOR-130 | 9.0 | ||||||||||||||
| Stats | wOBA | xwOBA | HC% | BB% | K% | GB% | Stats | wOBA | xwOBA | HC% | BB% | K% | GB% | ||
|---|---|---|---|---|---|---|---|---|---|---|---|---|---|---|---|
| SP vs. Left (2016-17) | 0.352 | 0.337 | 33.9% | 8.4% | 16.9% | 51.7% | SP vs. Left (2016-17) | 0.297 | 0.344 | 32.9% | 11.2% | 21.5% | 47.4% | ||
| SP vs. Right (2016-17) | 0.311 | 0.319 | 35.3% | 7.2% | 19.5% | 31.1% | SP vs. Right (2016-17) | 0.261 | 0.289 | 27.8% | 4.7% | 18.9% | 58.8% | ||
Pitcher Grind Down
| Ariel Miranda | |||||||||
 | FanDuel | DraftKings | FantasyDraft | ||||||
| Salary: | $7,400 | Salary: | $6,800 | Salary: | $13,600 | ||||
| Salary Rank: | 18 of 30 | Salary Rank: | 23 of 30 | Salary Rank: | 22 of 30 | ||||
| Stats | Starts | SIERA | ERA | K% | BB% | GB% | HC% | SC% | |
|---|---|---|---|---|---|---|---|---|---|
| 2016 | 10 | 4.77 | 3.88 | 19.0% | 7.8% | 31.2% | 37.1% | 17.7% | |
| 2017 | 7 | 4.32 | 5.20 | 19.0% | 7.0% | 42.0% | 31.9% | 16.4% | |
I wanted to start by wishing all of the moms out there a happy Mother’s Day! With that said, let’s get into the games.
Miranda is a fly ball pitcher with a home run weakness, and he’s heading to the Rogers Centre…not an ideal situation for the young lefty. While targeting pitchers against the Blue Jays has been a profitable strategy this year, let’s be clear: this is a pitcher with little strikeout upside who has been able to take advantage of spacious SafeCo Field (5.98 xFIP away, 4.12 home), and now he’s getting a huge negative park shift. I’m much more interested in targeting the surging Blue Jays bats than I am in rostering Miranda.
Quick Breakdown: Miranda will likely give up a home run or two in this matchup. In DFS, we want the guys who aren’t going to give up home runs. Avoid in all formats.
| Aaron Sanchez | |||||||||
 | FanDuel | DraftKings | FantasyDraft | ||||||
| Salary: | $8,700 | Salary: | $8,400 | Salary: | $16,200 | ||||
| Salary Rank: | 5 of 30 | Salary Rank: | 11 of 30 | Salary Rank: | 11 of 30 | ||||
| Stats | Starts | SIERA | ERA | K% | BB% | GB% | HC% | SC% | |
|---|---|---|---|---|---|---|---|---|---|
| 2016 | 30 | 4.01 | 3.00 | 20.4% | 8.0% | 54.4% | 30.3% | 20.7% | |
| 2017 | 3 | 4.68 | 4.05 | 18.2% | 9.1% | 37.5% | 30.0% | 15.0% | |
Sanchez returns to the Jays rotation after missing some time with a split middle fingernail (which is right up there with Rich Hill and his perpetual blisters as a type of injury you only hear about in baseball). Toronto’s young right-hander has been elite throughout his career against right-handed hitters (.233 career wOBA, 23.8% hard hits vs. RHB), and last season, I loved targeting Sanchez against teams that lacked quality lefty bats. That’s not the Mariners, who feature a number of solid lefties. To compound matters, we just haven’t seen anything from Sanchez this year. He’s only really pitched in two games (discounting the last start in which he left after three batters), and in one of them, he gave up five earned runs and three long balls to the Orioles. I think it’s fair to take a wait-and-see approach with Sanchez, especially considering the Mariners’ 119 wRC+ against RHP is fourth-best in MLB.
Quick Breakdown: Sanchez is a pitcher in the Marcus Stroman mold in that he’s safe without particularly high upside. This isn’t the right matchup. I’m taking a wait-and-see approach.
Batter Grind Down
Seattle
Projected Lineup (Splits vs. RH Pitching)
| # | Player | Bats | wOBA | xwOBA | ISO | HC% | BB% | K% | GB% | FD Pos. | FD Sal. | DK Pos. | DK Sal. | FDRFT Pos. | FDRFT Sal. |
|---|---|---|---|---|---|---|---|---|---|---|---|---|---|---|---|
| 1 | Jean Segura | RIGHT | 0.388 | 0.342 | 0.185 | 29.1% | 5.0% | 12.7% | 52.4% | SS | $4,100 | SS | $4,400 | SS | $8,700 |
| 2 | Ben Gamel | LEFT | 0.346 | 0.333 | 0.134 | 31.7% | 14.0% | 26.0% | 33.9% | OF | $3,300 | OF | $3,800 | RF | $7,600 |
| 3 | Robinson Cano | LEFT | 0.403 | 0.400 | 0.276 | 38.6% | 8.4% | 12.4% | 43.8% | 2B | $4,200 | 2B | $4,600 | 2B | $8,800 |
| 4 | Nelson Cruz | RIGHT | 0.378 | 0.384 | 0.240 | 35.2% | 8.8% | 24.1% | 43.0% | OF | $4,400 | OF | $4,500 | RF | $8,700 |
| 5 | Kyle Seager | LEFT | 0.377 | 0.405 | 0.214 | 39.6% | 12.5% | 14.3% | 34.7% | 3B | $3,500 | 3B | $3,600 | 3B | $7,200 |
| 6 | Danny Valencia | RIGHT | 0.318 | 0.320 | 0.152 | 30.4% | 7.2% | 24.2% | 42.9% | 1B | $3,400 | 1B | $3,300 | 3B | $6,400 |
| 7 | Guillermo Heredia | SWITCH | 0.327 | 0.303 | 0.070 | 14.3% | 9.9% | 15.8% | 46.3% | OF | $3,000 | OF | $2,800 | LF | $5,400 |
| 8 | Carlos Ruiz | RIGHT | 0.290 | 0.327 | 0.071 | 27.9% | 10.1% | 16.2% | 45.3% | C | $2,200 | C | $2,400 | C | $4,800 |
| 9 | Jarrod Dyson | LEFT | 0.291 | 0.270 | 0.093 | 16.2% | 8.0% | 12.6% | 52.2% | OF | $3,000 | OF | $2,800 | CF | $5,400 |
As I mentioned, Sanchez has a long track record of high ground balls and low hard hits against righties, so we can rule out Nelson Cruz and Jean Segura. That leaves us with the lefties, all of whom get a nice ballpark boost, moving from SafeCo Field to the Rogers Centre. Given Sanchez’s ground ball profile, we should prioritize hitters with high fly ball rates against righties. Kyle Seager and Robinson Cano (if he plays) both fit the bill. Ben Gamel has been hitting well near the top of the lineup, but his price tag has risen to the point that he’s no longer a value.
Elite Plays – NONE
Secondary Plays – Robinson Cano, Kyle Seager
Stackability – ORANGE – A viable stack in large field GPPs.
Toronto
Projected Lineup (Splits vs. LH Pitching)
| # | Player | Bats | wOBA | xwOBA | ISO | HC% | BB% | K% | GB% | FD Pos. | FD Sal. | DK Pos. | DK Sal. | FDRFT Pos. | FDRFT Sal. |
|---|---|---|---|---|---|---|---|---|---|---|---|---|---|---|---|
| 1 | Kevin Pillar | RIGHT | 0.327 | 0.295 | 0.142 | 32.9% | 2.7% | 14.8% | 37.0% | OF | $3,400 | OF | $3,800 | CF | $7,600 |
| 2 | Jose Bautista | RIGHT | 0.297 | 0.356 | 0.160 | 37.6% | 13.0% | 18.8% | 38.7% | OF | $3,700 | OF | $4,000 | RF | $7,800 |
| 3 | Kendrys Morales | SWITCH | 0.383 | 0.396 | 0.215 | 38.3% | 4.9% | 19.3% | 36.5% | 1B | $2,800 | 1B | $3,900 | 1B | $7,800 |
| 4 | Justin Smoak | SWITCH | 0.324 | 0.363 | 0.189 | 38.0% | 8.2% | 16.4% | 40.2% | 1B | $3,000 | 1B | $4,200 | 1B | $8,000 |
| 5 | Steve Pearce | RIGHT | 0.387 | 0.359 | 0.266 | 45.6% | 12.1% | 24.2% | 36.7% | OF | $2,900 | OF | $4,000 | 1B | $7,600 |
| 6 | Devon Travis | RIGHT | 0.264 | 0.276 | 0.085 | 23.4% | 2.5% | 20.5% | 43.6% | 2B | $2,300 | 2B | $3,400 | 2B | $6,800 |
| 7 | Darwin Barney | RIGHT | 0.337 | 0.311 | 0.098 | 28.7% | 7.5% | 16.4% | 42.0% | SS | $2,200 | 2B/3B | $2,900 | 2B | $5,700 |
| 8 | Ryan Goins | LEFT | 0.207 | 0.225 | 0.039 | 20.5% | 1.9% | 22.6% | 65.8% | 2B | $2,400 | SS | $3,000 | 2B | $6,000 |
| 9 | Luke Maile | RIGHT | 0.288 | 0.276 | 0.200 | 41.7% | 2.7% | 32.4% | 39.1% | C | $2,000 | C | $2,400 | C | $4,800 |
After posting MLB’s 27th-highest team ISO in April (.122), the Jays are ranked fourth in MLB in team ISO in May (.198). Even without a depleted lineup, they’re starting to score runs, and with a 4.68 implied run total, we should consider a few of their bats. It starts with Jose Bautista, who is red hot, with homers in three of his last four. Steve Pearce hasn’t gotten it going against lefties this season, but he has a long reputation of crushing southpaws (.373 wOBA, .263 ISO against LHP since 2014). Switch-hitting Justin Smoak can also be thrown into the mix. I don’t mind a Blue Jays stack here, as Miranda’s fly ball tendencies should not play well at the Rogers Centre.
Elite Plays – Jose Bautista, Steve Pearce
Secondary Plays – Justin Smoak
Stackability – YELLOW – A viable mini-stack in cash games and full stack in GPPs.
Atlanta at Miami – 1:10 PM ET
| Atlanta | Miami | ||||||||||||||
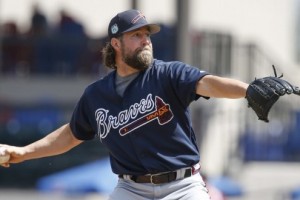
 | R.A. Dickey |  | Dan Straily | ||||||||||||
| RIGHT | RIGHT | ||||||||||||||
| Vegas Moneyline | Vegas Over/Under | ||||||||||||||
| MIA-115 | 9.0 | ||||||||||||||
| Stats | wOBA | xwOBA | HC% | BB% | K% | GB% | Stats | wOBA | xwOBA | HC% | BB% | K% | GB% | ||
|---|---|---|---|---|---|---|---|---|---|---|---|---|---|---|---|
| SP vs. Left (2016-17) | 0.347 | 0.348 | 28.6% | 10.1% | 15.3% | 40.7% | SP vs. Left (2016-17) | 0.287 | 0.322 | 30.1% | 13.3% | 20.0% | 35.0% | ||
| SP vs. Right (2016-17) | 0.340 | 0.346 | 30.5% | 7.9% | 17.7% | 46.2% | SP vs. Right (2016-17) | 0.316 | 0.312 | 34.9% | 6.6% | 21.9% | 31.3% | ||
Pitcher Grind Down
| R.A. Dickey | |||||||||
 | FanDuel | DraftKings | FantasyDraft | ||||||
| Salary: | $7,200 | Salary: | $6,700 | Salary: | $13,200 | ||||
| Salary Rank: | 23 of 30 | Salary Rank: | 25 of 30 | Salary Rank: | 25 of 30 | ||||
| Stats | Starts | SIERA | ERA | K% | BB% | GB% | HC% | SC% | |
|---|---|---|---|---|---|---|---|---|---|
| 2016 | 29 | 4.81 | 4.46 | 17.3% | 8.7% | 42.1% | 30.0% | 22.7% | |
| 2017 | 6 | 4.97 | 4.29 | 13.6% | 9.7% | 51.8% | 28.2% | 22.2% | |
All signs are pointing to this being the beginning of the end of the Braves’ 42-year-old knuckleballer. His SIERA has increased in each of the past four seasons, and his ability to fool hitters with his knuckler appear to be gone, as his 6.9% swinging-strike rate is his lowest since 2009, and he has an 85.1% contact rate, which is near the top of all qualified starters this year. About the best thing we can say about Dickey this year is that he hasn’t been blown up, allowing four or fewer earned runs in each of his six starts. The Marlins aren’t exactly an offense to be feared, but even so, there’s no reason to consider Dickey.
Quick Breakdown: Dickey is one of those pitchers who would have to be pretty close to free to be seriously considered as a DFS option. He isn’t, so don’t.
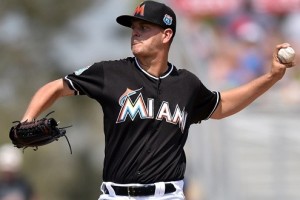
| Justin Nicolino | |||||||||
 | FanDuel | DraftKings | FantasyDraft | ||||||
| Salary: | $8,400 | Salary: | $8,000 | Salary: | $15,600 | ||||
| Salary Rank: | 10 of 30 | Salary Rank: | 13 of 30 | Salary Rank: | 13 of 30 | ||||
| Stats | Starts | SIERA | ERA | K% | BB% | GB% | HC% | SC% | |
|---|---|---|---|---|---|---|---|---|---|
| 2016 | 31 | 4.67 | 3.76 | 20.5% | 9.2% | 32.0% | 32.2% | 14.8% | |
| 2017 | 7 | 4.37 | 4.03 | 24.0% | 11.7% | 37.9% | 36.1% | 23.7% | |
In DFS, one of the primary objectives is selecting a starting pitcher who can rack up strikeouts. Justin Nicolino, just called up from Triple-A for this spot start, has a 9.3% strikeout rate for his career. I’d rather start R.A. Dickey here, which should tell you something.
Quick Breakdown: Against the contact-oriented Braves lineup, it’s not out of the question that Nicolino records literally zero strikeouts. Easy fade in all formats.
Batter Grind Down
Atlanta
Projected Lineup (Splits vs. RH Pitching)
| # | Player | Bats | wOBA | xwOBA | ISO | HC% | BB% | K% | GB% | FD Pos. | FD Sal. | DK Pos. | DK Sal. | FDRFT Pos. | FDRFT Sal. |
|---|---|---|---|---|---|---|---|---|---|---|---|---|---|---|---|
| 1 | Ender Inciarte | LEFT | 0.319 | 0.295 | 0.119 | 26.7% | 8.3% | 13.8% | 44.1% | OF | $3,400 | OF | $4,000 | CF | $7,800 |
| 2 | Brandon Phillips | RIGHT | 0.328 | 0.301 | 0.122 | 28.5% | 3.0% | 11.6% | 47.6% | 2B | $2,700 | 2B | $3,300 | 2B | $6,600 |
| 3 | Freddie Freeman | LEFT | 0.426 | 0.429 | 0.314 | 42.6% | 15.5% | 21.5% | 28.9% | 1B | $4,400 | 1B | $5,000 | 1B | $9,900 |
| 4 | Matt Kemp | RIGHT | 0.332 | 0.350 | 0.222 | 36.9% | 5.2% | 24.0% | 39.4% | OF | $3,900 | OF | $4,200 | RF | $8,000 |
| 5 | Nick Markakis | LEFT | 0.338 | 0.362 | 0.147 | 33.5% | 11.9% | 16.6% | 40.6% | OF | $3,200 | OF | $3,400 | RF | $6,600 |
| 6 | Adonis Garcia | RIGHT | 0.289 | 0.312 | 0.137 | 29.9% | 3.2% | 16.7% | 52.3% | 3B | $3,000 | 3B | $3,300 | IF/OF | $6,400 |
| 7 | Kurt Suzuki | RIGHT | 0.297 | 0.309 | 0.123 | 30.5% | 6.5% | 12.3% | 42.5% | C | $2,500 | C | $2,400 | C | $4,800 |
| 8 | Dansby Swanson | RIGHT | 0.266 | 0.285 | 0.077 | 30.7% | 9.8% | 24.8% | 46.7% | SS | $2,500 | SS | $3,000 | SS | $6,000 |
| 9 | R.A. Dickey | RIGHT | 0.080 | 0.109 | 0.000 | 0.0% | 0.0% | 18.2% | 77.8% | P | $7,200 | P | $6,700 | P | $13,200 |
The Braves are going to make a lot of contact against Justin Nicolino; that much is certain. Justin Nicolino has struggled against right-handed batters, and he has a reasonably high fly ball rate against them. This makes Matt Kemp a very interesting play, and one that likely won’t be popular. Outside of Kemp, Freddie Freeman will go virtually unowned in tournaments, and the lefty/lefty matchup shouldn’t bother him much considering Nicolino’s inability to strike anyone out. Tyler Flowers makes some sense as a punt catcher.
Elite Plays – Matt Kemp
Secondary Plays – Freddie Freeman, Tyler Flowers
Stackability – ORANGE – A viable stack in large field GPPs.
Miami
Projected Lineup (Splits vs. RH Pitching)
| # | Player | Bats | wOBA | xwOBA | ISO | HC% | BB% | K% | GB% | FD Pos. | FD Sal. | DK Pos. | DK Sal. | FDRFT Pos. | FDRFT Sal. |
|---|---|---|---|---|---|---|---|---|---|---|---|---|---|---|---|
| 1 | Derek Dietrich | LEFT | 0.347 | 0.348 | 0.143 | 28.7% | 8.7% | 20.1% | 37.4% | 2B | $2,500 | 3B | $3,100 | 3B | $6,000 |
| 2 | J.T. Realmuto | RIGHT | 0.341 | 0.310 | 0.114 | 30.6% | 4.8% | 16.8% | 50.5% | C | $2,700 | C | $3,400 | C | $6,800 |
| 3 | Christian Yelich | LEFT | 0.377 | 0.390 | 0.207 | 40.8% | 11.9% | 20.0% | 54.8% | OF | $3,400 | OF | $4,200 | CF | $8,000 |
| 4 | Marcell Ozuna | RIGHT | 0.336 | 0.340 | 0.186 | 37.0% | 7.9% | 19.6% | 46.0% | OF | $4,000 | OF | $4,100 | LF | $8,000 |
| 5 | Giancarlo Stanton | RIGHT | 0.329 | 0.339 | 0.231 | 38.3% | 9.8% | 28.8% | 39.0% | OF | $4,200 | OF | $4,800 | RF | $9,300 |
| 6 | Justin Bour | LEFT | 0.343 | 0.392 | 0.217 | 38.0% | 12.7% | 16.7% | 44.6% | 1B | $3,100 | 1B | $3,400 | 1B | $6,800 |
| 7 | JT Riddle | LEFT | 2B | $2,000 | SS | $2,400 | SS | $4,800 | |||||||
| 8 | Justin Nicolino | LEFT | 0.153 | 0.167 | 0.000 | 0.0% | 6.3% | 50.0% | 85.7% | P | $4,500 | P | $8,800 | ||
| 9 | Dee Gordon | LEFT | 0.297 | 0.247 | 0.074 | 18.1% | 5.8% | 16.1% | 56.6% | 2B | $3,400 | 2B | $4,200 | 2B | $8,100 |
R.A. Dickey has been prone to the long ball this year, and even in pitcher-friendly Marlins Park, there’s a good chance he’ll give up one or two more today. Derek Dietrich is an elite play out of the leadoff spot. Christian Yelich is really underpriced for his skills at FanDuel and is cash game viable. Giancarlo Stanton has actually struggled against Dickey, going just 6-for-20 with eight strikeouts and only one extra-base hit (a double), but I’m certainly not leaving him out of any Marlins stacks, nor am I leaving out Marcell Ozuna, who has two-homer upside. J.T. Realmuto continues to be cheap and hit near the top of the order, which is rare for a catcher.
Elite Plays – Derek Dietrich, Christian Yelich
Secondary Plays – Giancarlo Stanton, Marcell Ozuna, J.T. Realmuto
Stackability – YELLOW – A viable mini-stack in cash games and full stack in GPPs.
Minnesota at Cleveland – 1:10 PM ET
| Minnesota | Cleveland | ||||||||||||||
 | Hector Santiago |  | Trevor Bauer | ||||||||||||
| LEFT | RIGHT | ||||||||||||||
| Vegas Moneyline | Vegas Over/Under | ||||||||||||||
| CLE-155 | 9.0 | ||||||||||||||
| Stats | wOBA | xwOBA | HC% | BB% | K% | GB% | Stats | wOBA | xwOBA | HC% | BB% | K% | GB% | ||
|---|---|---|---|---|---|---|---|---|---|---|---|---|---|---|---|
| SP vs. Left (2016-17) | 0.349 | 0.364 | 33.6% | 14.1% | 17.7% | 48.4% | SP vs. Left (2016-17) | 0.316 | 0.328 | 37.0% | 8.1% | 24.4% | 38.8% | ||
| SP vs. Right (2016-17) | 0.314 | 0.346 | 37.6% | 8.9% | 18.4% | 31.0% | SP vs. Right (2016-17) | 0.325 | 0.332 | 29.1% | 9.6% | 18.8% | 54.6% | ||
Pitcher Grind Down
| Hector Santiago | |||||||||
 | FanDuel | DraftKings | FantasyDraft | ||||||
| Salary: | $7,600 | Salary: | $7,000 | Salary: | $13,800 | ||||
| Salary Rank: | 16 of 30 | Salary Rank: | 20 of 30 | Salary Rank: | 21 of 30 | ||||
| Stats | Starts | SIERA | ERA | K% | BB% | GB% | HC% | SC% | |
|---|---|---|---|---|---|---|---|---|---|
| 2016 | 33 | 5.07 | 4.70 | 18.3% | 10.1% | 34.1% | 37.3% | 18.1% | |
| 2017 | 7 | 4.85 | 2.76 | 17.8% | 9.2% | 35.0% | 34.7% | 14.5% | |
Hector Santiago brings an unspectacular 4.82 SIERA into Progressive Field to take on the Indians. Santiago’s 4.82 SIERA (against a 2.76 ERA) suggests that he’s in line for some serious regression. The Twins lefty has one of the highest fly ball rates in Major League Baseball over the past few seasons, and while that can lead to a bunch of pop outs, it can also lead to a bunch of home runs. That hasn’t happened this year, but his unsustainable 5.2% HR/FB rate will rise. There’s no reason to dig this deep, even on Sundays, when the day’s slate of games are split in half.
Quick Breakdown: Santiago hasn’t gotten blown up this year, but that’s largely due to some unsustainable positive fortune. Avoid in all formats.
| Trevor Bauer | |||||||||
 | FanDuel | DraftKings | FantasyDraft | ||||||
| Salary: | $8,400 | Salary: | $7,200 | Salary: | $14,400 | ||||
| Salary Rank: | 10 of 30 | Salary Rank: | 18 of 30 | Salary Rank: | 16 of 30 | ||||
| Stats | Starts | SIERA | ERA | K% | BB% | GB% | HC% | SC% | |
|---|---|---|---|---|---|---|---|---|---|
| 2016 | 28 | 4.22 | 4.26 | 20.7% | 8.6% | 48.7% | 31.9% | 19.0% | |
| 2017 | 6 | 3.96 | 7.36 | 25.3% | 10.3% | 40.2% | 37.2% | 16.0% | |
Trevor Bauer has a 7.36 ERA through six starts this year. But if you play DFS seriously, you probably look a little deeper than ERA. Truth be told, Bauer’s peripherals suggest he’s due for some positive regression. I’m no fan of Bauer, but a .345 BABIP and 20.0% HR/FB rate just aren’t sustainable, no matter how dislikable you are as a person. The Twins have been a tough matchup for right-handed pitchers this year, with a few power bats that could spell trouble for Bauer. His walk rate remains high, which leaves him always at risk for giving up big innings. For those reasons, he’s more of a stay away, though his 25.3% K rate says you can use him in tournaments.
Quick Breakdown: Bauer does present some strikeout upside, which puts him in play for tournaments. However, he should be far from your cash games.
Batter Grind Down
Minnesota
Projected Lineup (Splits vs. RH Pitching)
| # | Player | Bats | wOBA | xwOBA | ISO | HC% | BB% | K% | GB% | FD Pos. | FD Sal. | DK Pos. | DK Sal. | FDRFT Pos. | FDRFT Sal. |
|---|---|---|---|---|---|---|---|---|---|---|---|---|---|---|---|
| 1 | Brian Dozier | RIGHT | 0.356 | 0.325 | 0.251 | 33.3% | 9.0% | 19.7% | 39.2% | 2B | $4,200 | 2B | $4,700 | 2B | $9,300 |
| 2 | Joe Mauer | LEFT | 0.339 | 0.392 | 0.137 | 33.4% | 14.1% | 14.1% | 47.4% | 1B | $2,800 | 1B | $4,000 | 1B | $7,800 |
| 3 | Miguel Sano | RIGHT | 0.352 | 0.349 | 0.241 | 42.7% | 11.9% | 36.5% | 33.2% | 3B | $3,800 | 3B | $4,900 | IF/OF | $9,600 |
| 4 | Max Kepler | LEFT | 0.342 | 0.321 | 0.207 | 34.7% | 10.8% | 18.8% | 44.2% | OF | $3,000 | OF | $4,100 | RF | $8,000 |
| 5 | Kennys Vargas | SWITCH | 0.327 | 0.299 | 0.265 | 34.9% | 11.9% | 33.1% | 32.5% | 1B | $3,000 | 1B | $4,300 | 1B | $8,400 |
| 6 | Eddie Rosario | LEFT | 0.319 | 0.287 | 0.185 | 33.1% | 3.5% | 23.5% | 44.9% | OF | $2,600 | OF | $3,800 | LF | $7,500 |
| 7 | Jorge Polanco | SWITCH | 0.307 | 0.300 | 0.104 | 23.4% | 8.2% | 13.1% | 34.0% | SS | $2,700 | SS | $3,500 | SS | $6,800 |
| 8 | Jason Castro | LEFT | 0.327 | 0.324 | 0.198 | 37.0% | 12.7% | 32.5% | 42.2% | C | $2,500 | C | $3,000 | C | $6,000 |
| 9 | Byron Buxton | RIGHT | 0.291 | 0.234 | 0.183 | 23.3% | 6.2% | 36.0% | 35.4% | OF | $2,800 | OF | $3,700 | CF | $7,200 |
As with the Indians, there is certainly no shortage of talent in the Twins lineup. Miguel Sano, who owns an insane 57.5% hard contact rate against righties, is the top target here. He’s cash game playable at FanDuel, although I slightly prefer Manny Machado if I’m spending up at third base. Brian Dozier has no problem hitting right-handed pitching, and he’s one of the top raw points plays at second base. A stack is certainly in play given Bauer’s tendency to get wild, although it’s not one of my favorites of the slate.
Elite Plays – Miguel Sano
Secondary Plays – Brian Dozier
Stackability – ORANGE – A viable stack in large field GPPs.
Cleveland
Projected Lineup (Splits vs. LH Pitching)
| # | Player | Bats | wOBA | xwOBA | ISO | HC% | BB% | K% | GB% | FD Pos. | FD Sal. | DK Pos. | DK Sal. | FDRFT Pos. | FDRFT Sal. |
|---|---|---|---|---|---|---|---|---|---|---|---|---|---|---|---|
| 1 | Carlos Santana | SWITCH | 0.313 | 0.322 | 0.120 | 29.3% | 11.6% | 8.5% | 54.6% | 1B | $3,900 | 1B | $4,400 | 1B | $8,700 |
| 2 | Francisco Lindor | SWITCH | 0.330 | 0.331 | 0.137 | 31.8% | 6.8% | 14.9% | 47.2% | SS | $3,900 | SS | $4,700 | SS | $9,200 |
| 3 | Michael Brantley | LEFT | 0.305 | 0.299 | 0.119 | 34.4% | 8.5% | 23.4% | 46.9% | OF | $3,800 | OF | $4,600 | LF | $8,800 |
| 4 | Edwin Encarnacion | RIGHT | 0.361 | 0.383 | 0.206 | 40.5% | 19.6% | 21.6% | 39.7% | 1B | $3,500 | 1B | $4,300 | 1B | $8,400 |
| 5 | Jose Ramirez | SWITCH | 0.351 | 0.351 | 0.155 | 33.3% | 7.5% | 14.2% | 42.7% | 3B | $3,600 | 2B/3B | $4,300 | IF/OF | $8,400 |
| 6 | Jason Kipnis | LEFT | 0.318 | 0.306 | 0.165 | 28.5% | 5.8% | 25.0% | 43.4% | 2B | $3,000 | 2B | $3,800 | 2B | $7,600 |
| 7 | Brandon Guyer | RIGHT | 0.386 | 0.361 | 0.189 | 28.4% | 4.5% | 13.9% | 36.2% | OF | $2,500 | OF | $3,200 | LF | $6,300 |
| 8 | Yan Gomes | RIGHT | 0.355 | 0.311 | 0.207 | 29.2% | 7.8% | 21.4% | 42.3% | C | $2,900 | C | $3,100 | C | $6,000 |
| 9 | Abraham Almonte | SWITCH | 0.296 | 0.284 | 0.133 | 26.1% | 7.0% | 23.0% | 55.2% | OF | $2,300 | OF | $3,200 | RF | $6,400 |
As a team, the Indians are much more effective against right-handed pitching. For that reason, I wasn’t initially a fan of this spot, but the Indians’ 4.83 implied run total has me a bit more interested. Francisco Lindor prefers to hit left-handed, but on a weak slate for shortstops, he’s in consideration. The price of Edwin Encarnacion is coming up at FanDuel, but he’s still too cheap for his home run upside, especially against a fly ball pitcher like Santiago.
Elite Plays – Francisco Lindor
Secondary Plays – Edwin Encarnacion
Stackability – ORANGE – A viable stack in large field GPPs.
Philadelphia at Washington – 1:35 PM ET
| Philadelphia | Washington | ||||||||||||||
 | Jeremy Hellickson |  | Gio Gonzalez | ||||||||||||
| RIGHT | LEFT | ||||||||||||||
| Vegas Moneyline | Vegas Over/Under | ||||||||||||||
| WAS-170 | 8.5 | ||||||||||||||
| Stats | wOBA | xwOBA | HC% | BB% | K% | GB% | Stats | wOBA | xwOBA | HC% | BB% | K% | GB% | ||
|---|---|---|---|---|---|---|---|---|---|---|---|---|---|---|---|
| SP vs. Left (2016-17) | 0.314 | 0.347 | 26.2% | 8.9% | 15.7% | 32.7% | SP vs. Left (2016-17) | 0.278 | 0.318 | 26.1% | 8.5% | 18.6% | 57.1% | ||
| SP vs. Right (2016-17) | 0.297 | 0.308 | 26.0% | 2.9% | 20.7% | 45.9% | SP vs. Right (2016-17) | 0.327 | 0.319 | 33.8% | 8.5% | 22.6% | 43.9% | ||
Pitcher Grind Down
| Jeremy Hellickson | |||||||||
 | FanDuel | DraftKings | FantasyDraft | ||||||
| Salary: | $8,200 | Salary: | $7,600 | Salary: | $15,000 | ||||
| Salary Rank: | 15 of 30 | Salary Rank: | 14 of 30 | Salary Rank: | 14 of 30 | ||||
| Stats | Starts | SIERA | ERA | K% | BB% | GB% | HC% | SC% | |
|---|---|---|---|---|---|---|---|---|---|
| 2016 | 32 | 4.15 | 3.71 | 20.0% | 5.8% | 40.7% | 25.9% | 20.8% | |
| 2017 | 7 | 5.32 | 3.49 | 10.7% | 5.0% | 35.4% | 26.7% | 17.6% | |
In the first game in the day/night double-header between the Phillies and Nationals, Jeremy Hellickson takes the hill for the Phils. He has made a career of generating weak contact. He’s never been a high strikeout pitcher, but this year, his SIERA is at 5.32 (after being 4.14 and 4.15 the previous two years) – that’s the fourth-highest mark among qualified pitchers in MLB. His 10.7 K% is the lowest among qualified starters, and it isn’t that close (Zach Eflin is second at 13.0%). Needless to say, against the team that has the second-highest wOBA in MLB against righties, Hellickson has no business on anyone’s DFS lineups.
Quick Breakdown: Quick Breakdown: Hellickson has taken a major step backwards in the strikeout department this season, and he was rarely playable before this year. Easy fade.
| Gio Gonzalez | |||||||||
 | FanDuel | DraftKings | FantasyDraft | ||||||
| Salary: | $8,600 | Salary: | $9,400 | Salary: | $18,000 | ||||
| Salary Rank: | 7 of 30 | Salary Rank: | 5 of 30 | Salary Rank: | 5 of 30 | ||||
| Stats | Starts | SIERA | ERA | K% | BB% | GB% | HC% | SC% | |
|---|---|---|---|---|---|---|---|---|---|
| 2016 | 32 | 3.96 | 4.57 | 22.4% | 7.7% | 47.6% | 32.7% | 18.1% | |
| 2017 | 7 | 4.86 | 2.64 | 19.3% | 11.8% | 43.5% | 29.7% | 26.6% | |
If you’ve played DFS long enough, you’ve most likely been burned by Gio Gonzalez at some point (and if you’re new to DFS, it may have been in his last start, when he gave up six earned to the Orioles). Gio has a 2.64 but has gotten incredibly lucky with an 89.6% strand rate and .248 BABIP. The 4.84 SIERA tells the real story. Gio has had tremendous success against the Phillies in the past, limiting them to two or fewer earned runs in seven consecutive starts dating back to 2015. But the 2017 Phillies are quietly crushing left-handed pitching in 2017, ranking in the top six of MLB in wOBA, ISO, and wRC+. We’re still in small sample land, so it’s not clear how real those numbers are, but they’re certainly enough to give pause. Sunday’s early slate is pretty thin for SP2 options, though, so Gonzalez is in play on two-pitcher sites.
Quick Breakdown: Depending on your risk tolerance, you may consider Gonzalez as an SP2 or in tournaments.
Batter Grind Down
Philadelphia
Projected Lineup (Splits vs. LH Pitching)
| # | Player | Bats | wOBA | xwOBA | ISO | HC% | BB% | K% | GB% | FD Pos. | FD Sal. | DK Pos. | DK Sal. | FDRFT Pos. | FDRFT Sal. |
|---|---|---|---|---|---|---|---|---|---|---|---|---|---|---|---|
| 1 | Cesar Hernandez | SWITCH | 0.349 | 0.291 | 0.096 | 22.9% | 7.3% | 19.8% | 59.1% | 2B | $3,500 | 2B | $3,700 | 2B | $7,200 |
| 2 | Aaron Altherr | RIGHT | 0.395 | 0.351 | 0.266 | 34.0% | 12.2% | 18.9% | 44.0% | OF | $4,100 | OF | $3,700 | LF | $7,200 |
| 3 | Odubel Herrera | LEFT | 0.303 | 0.289 | 0.080 | 23.5% | 9.7% | 21.9% | 59.7% | OF | $3,600 | OF | $3,600 | IF/OF | $7,200 |
| 4 | Maikel Franco | RIGHT | 0.344 | 0.359 | 0.219 | 38.1% | 7.0% | 17.5% | 45.2% | 3B | $3,200 | 3B | $3,600 | 3B | $7,200 |
| 5 | Michael Saunders | LEFT | 0.370 | 0.306 | 0.268 | 29.9% | 7.0% | 28.7% | 48.5% | OF | $2,600 | OF | $3,200 | RF | $6,400 |
| 6 | Tommy Joseph | RIGHT | 0.376 | 0.377 | 0.304 | 36.0% | 10.7% | 21.4% | 32.6% | 1B | $3,000 | 1B | $3,600 | 1B | $7,200 |
| 7 | Freddy Galvis | SWITCH | 0.238 | 0.263 | 0.117 | 26.2% | 2.1% | 18.2% | 39.6% | SS | $3,200 | SS | $3,300 | SS | $6,600 |
| 8 | Cameron Rupp | RIGHT | 0.413 | 0.322 | 0.290 | 40.6% | 7.9% | 28.7% | 50.0% | C | $2,900 | C | $3,100 | C | $6,000 |
| 9 | Jeremy Hellickson | RIGHT | 0.185 | 0.202 | 0.000 | 0.0% | 4.8% | 33.3% | 60.0% | P | $8,200 | P | $7,600 | P | $15,000 |
Despite the Phillies excellent team numbers against left-handed pitching this year, there really aren’t many individual bats that are catching my attention, outside of Aaron Altherr, who has been the best hitter on the planet since the calendar flipped to May. Take a look at his numbers this month: .635 wOBA (1st in MLB), .633 ISO (2nd), and 297 wRC+ (1st). He’s still way underpriced at DraftKings and makes for an excellent one-off in tournaments. On a weak slate for catchers, Cameron Rupp also deserves a look, as he crushes left-handed pitching.
Elite Plays – Aaron Altherr
Secondary Plays – Cameron Rupp, Tommy Joseph
Stackability – ORANGE – A viable stack in large field GPPs.
Washington
Projected Lineup (Splits vs. RH Pitching)
| # | Player | Bats | wOBA | xwOBA | ISO | HC% | BB% | K% | GB% | FD Pos. | FD Sal. | DK Pos. | DK Sal. | FDRFT Pos. | FDRFT Sal. |
|---|---|---|---|---|---|---|---|---|---|---|---|---|---|---|---|
| 1 | Trea Turner | RIGHT | 0.390 | 0.334 | 0.239 | 33.1% | 4.9% | 19.6% | 43.2% | SS | $3,700 | SS | $5,000 | IF/OF | $9,900 |
| 2 | Jayson Werth | RIGHT | 0.312 | 0.318 | 0.147 | 32.6% | 11.0% | 24.7% | 41.9% | OF | $3,500 | OF | $4,400 | LF | $8,400 |
| 3 | Bryce Harper | LEFT | 0.380 | 0.395 | 0.234 | 35.3% | 19.2% | 15.9% | 39.7% | OF | $4,900 | OF | $5,600 | RF | $10,800 |
| 4 | Ryan Zimmerman | RIGHT | 0.325 | 0.333 | 0.196 | 35.8% | 5.2% | 23.4% | 45.4% | 1B | $4,100 | 1B | $4,900 | 1B | $9,600 |
| 5 | Daniel Murphy | LEFT | 0.417 | 0.401 | 0.252 | 39.1% | 6.8% | 9.2% | 35.0% | 2B | $4,200 | 2B | $4,900 | 2B | $9,600 |
| 6 | Anthony Rendon | RIGHT | 0.338 | 0.342 | 0.179 | 34.7% | 8.8% | 18.8% | 37.6% | 3B | $3,500 | 3B | $4,400 | 3B | $8,700 |
| 7 | Matt Wieters | SWITCH | 0.314 | 0.322 | 0.174 | 33.0% | 7.2% | 18.0% | 38.0% | C | $3,000 | C | $3,500 | C | $6,800 |
| 8 | Michael Taylor | RIGHT | 0.260 | 0.268 | 0.120 | 32.0% | 5.8% | 31.6% | 44.4% | OF | $3,300 | OF | $3,400 | CF | $6,600 |
| 9 | Gio Gonzalez | LEFT | 0.173 | 0.171 | 0.038 | 15.6% | 3.3% | 42.6% | 53.8% | P | $8,600 | P | $9,400 | P | $18,000 |
Jeremy Hellickson is a pitcher in the same vein as Tanner Roark, who isn’t someone we love to roster, but who also isn’t someone we love to pick on. Even so, Daniel Murphy and Bryce Harper are in play anytime they have the platoon edge (and oftentimes when they don’t). Trea Turner remains underpriced at FanDuel considering the power/speed upside he brings. Even though Hellickson can generally limit the damage and has had success against the Nationals this year, it’s rarely wrong to stack Washington bats up in 2017.
Elite Plays – Bryce Harper, Daniel Murphy
Secondary Plays – Trea Turner
Stackability – YELLOW – A viable mini-stack in cash games and full stack in GPPs.
Tampa Bay at Boston – 1:35 PM ET
| Tampa Bay | Boston | ||||||||||||||
 | Matt Andriese |  | Drew Pomeranz | ||||||||||||
| RIGHT | LEFT | ||||||||||||||
| Vegas Moneyline | Vegas Over/Under | ||||||||||||||
| BOS-150 | 8.5 | ||||||||||||||
| Stats | wOBA | xwOBA | HC% | BB% | K% | GB% | Stats | wOBA | xwOBA | HC% | BB% | K% | GB% | ||
|---|---|---|---|---|---|---|---|---|---|---|---|---|---|---|---|
| SP vs. Left (2016-17) | 0.294 | 0.312 | 36.1% | 6.6% | 20.9% | 43.2% | SP vs. Left (2016-17) | 0.311 | 0.299 | 33.8% | 9.6% | 23.9% | 42.2% | ||
| SP vs. Right (2016-17) | 0.321 | 0.317 | 35.6% | 5.1% | 21.0% | 45.1% | SP vs. Right (2016-17) | 0.291 | 0.283 | 31.2% | 8.9% | 27.4% | 46.4% | ||
Pitcher Grind Down
| Matt Andriese | |||||||||
 | FanDuel | DraftKings | FantasyDraft | ||||||
| Salary: | $7,400 | Salary: | $7,300 | Salary: | $14,400 | ||||
| Salary Rank: | 18 of 30 | Salary Rank: | 16 of 30 | Salary Rank: | 16 of 30 | ||||
| Stats | Starts | SIERA | ERA | K% | BB% | GB% | HC% | SC% | |
|---|---|---|---|---|---|---|---|---|---|
| 2016 | 19 | 3.90 | 4.37 | 20.7% | 4.7% | 42.9% | 34.3% | 16.6% | |
| 2017 | 7 | 4.03 | 3.12 | 21.9% | 8.9% | 48.7% | 41.0% | 15.4% | |
Matt Andriese is very quietly having a solid year for the Rays. However, the 41.0% hard hit rate says he could be due for some regression. It’s difficult to roster even elite starters against the Red Sox given their MLB-low 16.8% K rate against righties, and Andriese is far from elite.
Quick Breakdown: Andriese is a perfectly average starter, but that’s not going to cut it in a poor matchup with the Red Sox.
| Drew Pomeranz | |||||||||
 | FanDuel | DraftKings | FantasyDraft | ||||||
| Salary: | $8,300 | Salary: | $8,200 | Salary: | $15,900 | ||||
| Salary Rank: | 12 of 30 | Salary Rank: | 12 of 30 | Salary Rank: | 12 of 30 | ||||
| Stats | Starts | SIERA | ERA | K% | BB% | GB% | HC% | SC% | |
|---|---|---|---|---|---|---|---|---|---|
| 2016 | 30 | 3.80 | 3.32 | 26.5% | 9.3% | 46.2% | 31.5% | 19.1% | |
| 2017 | 6 | 3.54 | 5.23 | 26.7% | 8.2% | 40.9% | 34.1% | 26.1% | |
The pitcher on the other side of this game is a bit more interesting, at least for tournaments. Drew Pomeranz has elite strikeout upside against any opponent, but against Tampa Bay, he could reach double figures in strikeouts (and in fact, he did the last time he faced them, on April 16th). The fact that he also gave up five earned runs in that start illustrates why he’s a tournament play. The issue with Pomeranz is that he rarely pitches deep into games. His 4.22 pitches per plate appearance is seventh-highest in MLB. His SIERA is 3.54, actually down from the 3.80 he posted last year. It appears that variance hasn’t been on his side regarding BABIP and his HR/FB rate. The real upside here, though, comes in the strikeout department: the Rays whiff 27.0% of the time against lefties, more often than any other team in baseball.
Quick Breakdown: It’s the same old story with Pomeranz: great tournament play, but very risky for cash games.
Batter Grind Down
Tampa Bay
Projected Lineup (Splits vs. LH Pitching)
| # | Player | Bats | wOBA | xwOBA | ISO | HC% | BB% | K% | GB% | FD Pos. | FD Sal. | DK Pos. | DK Sal. | FDRFT Pos. | FDRFT Sal. |
|---|---|---|---|---|---|---|---|---|---|---|---|---|---|---|---|
| 1 | Steve Souza | RIGHT | 0.305 | 0.291 | 0.149 | 34.0% | 7.8% | 35.9% | 40.4% | OF | $3,100 | OF | $3,700 | RF | $7,200 |
| 2 | Tim Beckham | RIGHT | 0.328 | 0.286 | 0.151 | 38.3% | 7.9% | 33.1% | 51.9% | SS | $2,800 | SS | $3,500 | SS | $6,800 |
| 3 | Evan Longoria | RIGHT | 0.303 | 0.338 | 0.180 | 33.1% | 9.5% | 21.6% | 36.0% | 3B | $2,900 | 3B | $4,000 | 3B | $7,800 |
| 4 | Logan Morrison | LEFT | 0.313 | 0.321 | 0.108 | 25.8% | 10.6% | 22.3% | 51.6% | 1B | $3,300 | 1B | $4,100 | 1B | $8,100 |
| 5 | Rickie Weeks | RIGHT | 0.386 | 0.410 | 0.298 | 50.8% | 15.2% | 27.7% | 38.1% | OF | $2,700 | 1B | $3,000 | IF/OF | $6,000 |
| 6 | Daniel Robertson | RIGHT | 0.381 | 0.334 | 0.091 | 40.0% | 8.3% | 8.3% | 40.0% | SS | $2,100 | 3B/SS | $2,800 | SS | $5,400 |
| 7 | Kevin Kiermaier | LEFT | 0.308 | 0.271 | 0.131 | 29.8% | 10.4% | 24.7% | 45.1% | OF | $2,700 | OF | $3,600 | CF | $7,200 |
| 8 | Derek Norris | RIGHT | 0.273 | 0.316 | 0.135 | 41.3% | 9.8% | 21.5% | 31.2% | C | $2,500 | C | $3,200 | C | $6,300 |
| 9 | Peter Bourjos | RIGHT | 0.287 | 0.242 | 0.054 | 24.7% | 5.9% | 22.0% | 47.6% | OF | $2,100 | OF | $3,000 | CF | $6,000 |
The Rays have one of the lower implied run totals of the day at 3.96 runs. They strike out so much against lefties that it’s tough to consider any of them cash game options. Depending on lineup positioning, though, there are a few interesting bats to consider as “last man in” types. Rickie Weeks continues to be a value play with nice upside, particularly when he’s batting cleanup. If Tim Beckham is hitting near the top of the order, there are worse value options.
Elite Plays – NONE
Secondary Plays – Rickie Weeks, Tim Beckham
Stackability – ORANGE – A viable stack in large field GPPs.
Boston
Projected Lineup (Splits vs. RH Pitching)
| # | Player | Bats | wOBA | xwOBA | ISO | HC% | BB% | K% | GB% | FD Pos. | FD Sal. | DK Pos. | DK Sal. | FDRFT Pos. | FDRFT Sal. |
|---|---|---|---|---|---|---|---|---|---|---|---|---|---|---|---|
| 1 | Mookie Betts | RIGHT | 0.394 | 0.339 | 0.215 | 34.1% | 7.7% | 10.5% | 41.4% | OF | $4,700 | OF | $5,400 | RF | $10,400 |
| 2 | Dustin Pedroia | RIGHT | 0.356 | 0.333 | 0.133 | 33.9% | 8.0% | 9.5% | 50.2% | 2B | $3,600 | 2B | $4,300 | 2B | $8,400 |
| 3 | Xander Bogaerts | RIGHT | 0.342 | 0.296 | 0.137 | 29.4% | 6.9% | 16.4% | 48.2% | SS | $3,900 | SS | $4,600 | SS | $9,000 |
| 4 | Andrew Benintendi | LEFT | 0.395 | 0.349 | 0.214 | 37.5% | 8.6% | 13.8% | 35.2% | OF | $3,900 | OF | $4,600 | LF | $9,000 |
| 5 | Hanley Ramirez | RIGHT | 0.345 | 0.350 | 0.186 | 37.8% | 9.5% | 19.3% | 49.3% | 1B | $3,700 | 1B/OF | $4,600 | IF/OF | $8,800 |
| 6 | Mitch Moreland | LEFT | 0.308 | 0.354 | 0.186 | 38.5% | 8.3% | 22.7% | 39.9% | 1B | $3,200 | 1B | $3,400 | 1B | $6,600 |
| 7 | Josh Rutledge | RIGHT | 0.296 | 0.235 | 0.071 | 33.3% | 10.9% | 32.8% | 65.7% | 3B | $2,500 | 2B/3B | $2,800 | 2B | $5,600 |
| 8 | Sandy Leon | SWITCH | 0.310 | 0.274 | 0.153 | 35.3% | 5.9% | 25.9% | 45.2% | C | $2,600 | C | $3,100 | C | $6,000 |
| 9 | Jackie Bradley Jr. | LEFT | 0.357 | 0.355 | 0.241 | 38.1% | 10.3% | 22.0% | 46.6% | OF | $2,900 | OF | $3,900 | CF | $7,800 |
After a slow start to 2016, the Red Sox bats have woken up. They now lead Major League Baseball with a .365 wOBA in May, and their 14.1% K rate this month is by far the lowest in MLB. The only issue is their prices; none of these guys come cheap, with the exception of Mitch Moreland, who is an unsexy name at first base, but one who is underpriced given his skills and the matchup. Andrew Benintendi is reasonably priced, and Mookie Betts could be priced at $6,000 and still be a value the way he’s been playing recently. While Xander Bogaerts and Dustin Pedroia are needed to fill out the stack, neither are appealing in one-offs due to their lack of power. Neither Bogaerts nor Pedroia have a single barrel on the season (“barrel” is a StatCast metric that measures the best-hit balls based on a combination of exit velocity and launch angle).