MLB Grind Down: Thursday, August 3rd

Jump to Page 1 2 3
The RotoGrinders MLB Grind Down will give you an in-depth analysis into the upcoming MLB schedule. This article will break down the numbers for every single game and give you analysis on which trends you can exploit. While matchups are a major factor in daily fantasy baseball, there are plenty of other factors to consider such as injuries, weather, and salaries.
The analysis should point you in the right direction, but it is still up to you to decipher the information and make your own selections. No sport has more variance than baseball. The best choice is not always the right choice but following the trends will win you money over time.
Note: As always, if you want to try a new DFS site, be sure to click through a RotoGrinders link and use our DraftKings promo code, FanDuel promo code, and FantasyDraft promo code to receive the best perks in the industry.
Stackability Rating System:
GREEN – A viable full stack in cash games and GPPs.
YELLOW – A viable mini-stack in cash games and full stack in GPPs.
ORANGE – A viable stack in large field GPPs.
RED – Not a recommended stack for cash games or GPPs.
St. Louis at Milwaukee – 2:10 PM ET
| St. Louis | Milwaukee | ||||||||||||||
 | Michael Wacha |  | Matt Garza | ||||||||||||
| RIGHT | RIGHT | ||||||||||||||
| Vegas Moneyline | Vegas Over/Under | ||||||||||||||
| STL-112 | 8.5 | ||||||||||||||
| Stats | wOBA | xwOBA | HC% | BB% | K% | GB% | Stats | wOBA | xwOBA | HC% | BB% | K% | GB% | ||
|---|---|---|---|---|---|---|---|---|---|---|---|---|---|---|---|
| SP vs. Left (2016-17) | 0.313 | 0.317 | 30.9% | 8.7% | 19.5% | 45.3% | SP vs. Left (2016-17) | 0.342 | 0.341 | 35.6% | 10.0% | 12.1% | 46.8% | ||
| SP vs. Right (2016-17) | 0.335 | 0.306 | 28.2% | 6.4% | 22.1% | 48.0% | SP vs. Right (2016-17) | 0.303 | 0.290 | 32.7% | 5.3% | 19.0% | 53.5% | ||
Pitcher Grind Down
| Michael Wacha | |||||||||
 | FanDuel | DraftKings | FantasyDraft | ||||||
| Salary: | $8,400 | Salary: | $9,700 | Salary: | |||||
| Salary Rank: | 6 of 26 | Salary Rank: | 14 of 26 | Salary Rank: | of 26 | ||||
| Stats | Starts | SIERA | ERA | K% | BB% | GB% | HC% | SC% | |
|---|---|---|---|---|---|---|---|---|---|
| 2016 | 24 | 4.31 | 5.09 | 18.8% | 7.4% | 46.6% | 30.0% | 18.8% | |
| 2017 | 19 | 3.95 | 3.71 | 23.8% | 7.5% | 47.1% | 28.5% | 20.5% | |
| L30 | 5 | 2.94 | 1.93 | 29.8% | 4.0% | 46.9% | 25.9% | 22.2% | |
Wacha had a great start to the season, his production then dropped off for a couple of months, and now he is back in great form. In his last five starts, he has a 2.94 SIERA with a strikeout rate of 30%. He has always been good at inducing ground balls and soft contact and he now has an above-average strikeout rate to go with it. While this ballpark isn’t ideal for a pitcher, Wacha gets to face a right-handed heavy Brewers’ offense that has the second highest strikeout rate against right-handed pitching this season. There are two intriguing pitchers in the Cubs’ game, but Wacha is really the only other viable play in the early three-game slate.
Quick Breakdown: Wacha is viable in all formats and one of the top targets in the early slate.
| Matt Garza | |||||||||
 | FanDuel | DraftKings | FantasyDraft | ||||||
| Salary: | $6,500 | Salary: | $6,600 | Salary: | |||||
| Salary Rank: | 18 of 26 | Salary Rank: | 11 of 26 | Salary Rank: | of 26 | ||||
| Stats | Starts | SIERA | ERA | K% | BB% | GB% | HC% | SC% | |
|---|---|---|---|---|---|---|---|---|---|
| 2016 | 19 | 4.60 | 4.51 | 15.2% | 7.8% | 54.8% | 34.9% | 19.0% | |
| 2017 | 15 | 4.90 | 3.83 | 16.3% | 7.3% | 43.9% | 33.1% | 17.5% | |
| L30 | 4 | 5.72 | 2.11 | 13.3% | 10.0% | 41.5% | 29.0% | 26.1% | |
Garza will be activated off of the DL to make today’s start against the Cardinals. He’s had a decent season by his standards, but he doesn’t really fit the mold of what we are looking for in a pitcher. He has a high SIERA and a below-average strikeout rate. The one positive in this matchup against the Cardinals is that he will likely face seven or eight right-handed hitters. Since the start of last season, he has held righties to a .290 xwOBA with a 53% ground ball rate and a 19% strikeout rate.
Quick Breakdown: This is a decent matchup for Garza, but he might be rusty in his first start back from injury. I’ll take Wacha at the higher price point.
Batter Grind Down
St. Louis
The Cardinals aren’t nearly as bad offensively as people want to think. On the season, they are ranked above the major league average in both team wOBA and strikeout rate against right-handed pitching. They see a favorable ballpark shift playing in Miller Park and they draw a decent matchup against Matt Garza. The issue is that they don’t have the left-handed batters that we usually like to target against Garza. Matt Carpenter was a late scratch last night, but would be the preferred target if he’s back in the lineup today. I wouldn’t automatically rule out the righties here, but keep in mind that there is a game in Coors Field.
Projected Lineup (Splits vs. RH Pitching)
| # | Player | Bats | wOBA | xwOBA | ISO | HC% | BB% | K% | GB% | FD Pos. | FD Sal. | DK Pos. | DK Sal. | FDRFT Pos. | FDRFT Sal. |
|---|---|---|---|---|---|---|---|---|---|---|---|---|---|---|---|
| 1 | Matt Carpenter | LEFT | 0.375 | 0.389 | 0.221 | 43.5% | 15.8% | 18.2% | 24.6% | 1B | $3,500 | 1B | $3,900 | N/A | N/A |
| 2 | Tommy Pham | RIGHT | 0.380 | 0.358 | 0.185 | 37.8% | 10.6% | 24.7% | 50.7% | OF | $3,500 | OF | $5,000 | N/A | N/A |
| 3 | Paul DeJong | RIGHT | 0.348 | 0.335 | 0.261 | 40.7% | 1.3% | 31.3% | 32.4% | SS | $3,100 | 2B/SS | $4,700 | N/A | N/A |
| 4 | Jedd Gyorko | RIGHT | 0.344 | 0.330 | 0.188 | 30.5% | 10.4% | 22.5% | 41.2% | 3B | $2,800 | 3B | $3,500 | N/A | N/A |
| 5 | Yadier Molina | RIGHT | 0.294 | 0.305 | 0.126 | 34.2% | 4.3% | 15.8% | 45.7% | C | $3,000 | C | $3,500 | N/A | N/A |
| 6 | Stephen Piscotty | RIGHT | 0.327 | 0.357 | 0.151 | 29.0% | 12.7% | 20.0% | 45.8% | OF | $2,700 | OF | $3,100 | N/A | N/A |
| 7 | Kolten Wong | LEFT | 0.333 | 0.310 | 0.137 | 22.6% | 9.2% | 13.5% | 48.9% | 2B | $2,300 | 2B | $3,300 | N/A | N/A |
| 8 | Randal Grichuk | RIGHT | 0.314 | 0.308 | 0.229 | 41.9% | 5.1% | 30.8% | 36.8% | OF | $2,800 | OF | $3,300 | N/A | N/A |
| 9 | Michael Wacha | RIGHT | 0.038 | 0.096 | 0.000 | 12.5% | 0.0% | 40.7% | 83.3% | P | $8,400 | P | $9,700 | N/A | N/A |
Elite Plays – Matt Carpenter
Secondary Plays – Tommy Pham, Jedd Gyorko, Kolten Wong
Stackability – YELLOW
Milwaukee
Michael Wacha isn’t a pitcher that I like to target hitters against, especially when he’s in good form. He’s typically one of the streakier pitchers in baseball and he has been scary good in his last five outings. Since the start of last season, he has held both left and right-handed hitters under a .320 xwOBA and under a 31% hard contact rate. Eric Sogard is a decent punt batting leadoff, while Eric Thames and Travis Shaw always provide some upside as one-offs. With that said, I see all three as secondary plays, even in this small early slate.
Projected Lineup (Splits vs. RH Pitching)
| # | Player | Bats | wOBA | xwOBA | ISO | HC% | BB% | K% | GB% | FD Pos. | FD Sal. | DK Pos. | DK Sal. | FDRFT Pos. | FDRFT Sal. |
|---|---|---|---|---|---|---|---|---|---|---|---|---|---|---|---|
| 1 | Eric Sogard | LEFT | 0.382 | 0.347 | 0.124 | 26.2% | 14.5% | 12.4% | 39.6% | 2B | $2,300 | 2B/SS | $2,900 | N/A | N/A |
| 2 | Eric Thames | LEFT | 0.396 | 0.351 | 0.291 | 43.4% | 16.0% | 26.5% | 40.0% | 1B | $3,500 | 1B/OF | $4,300 | N/A | N/A |
| 3 | Ryan Braun | RIGHT | 0.359 | 0.335 | 0.277 | 41.8% | 8.6% | 22.5% | 45.6% | OF | $4,200 | OF | $4,000 | N/A | N/A |
| 4 | Travis Shaw | LEFT | 0.411 | 0.374 | 0.293 | 40.4% | 10.8% | 20.5% | 45.3% | 3B | $3,500 | 3B | $4,200 | N/A | N/A |
| 5 | Domingo Santana | RIGHT | 0.364 | 0.324 | 0.186 | 33.7% | 11.4% | 29.6% | 48.3% | OF | $3,600 | OF | $4,400 | N/A | N/A |
| 6 | Jett Bandy | RIGHT | 0.254 | 0.267 | 0.121 | 33.7% | 6.3% | 28.0% | 40.2% | C | $2,100 | C | $2,200 | N/A | N/A |
| 7 | Keon Broxton | RIGHT | 0.305 | 0.286 | 0.198 | 33.6% | 7.7% | 38.5% | 43.7% | OF | $2,200 | OF | $2,900 | N/A | N/A |
| 8 | Orlando Arcia | RIGHT | 0.308 | 0.272 | 0.135 | 27.5% | 4.9% | 17.7% | 51.9% | SS | $2,500 | SS | $3,100 | N/A | N/A |
| 9 | Matt Garza | RIGHT | 0.118 | 0.133 | 0.000 | 0.0% | 0.0% | 22.7% | 85.7% | P | $6,500 | P | $6,600 | N/A | N/A |
Elite Plays – None
Secondary Plays – Eric Sogard, Eric Thames (GPP), Travis Shaw (GPP)
Stackability – ORANGE
Arizona at Chicago Cubs – 2:20 PM ET
| Arizona | Chicago Cubs | ||||||||||||||
 | Zack Greinke |  | Jose Quintana | ||||||||||||
| RIGHT | LEFT | ||||||||||||||
| Vegas Moneyline | Vegas Over/Under | ||||||||||||||
| CHC-130 | 8.5 | ||||||||||||||
| Stats | wOBA | xwOBA | HC% | BB% | K% | GB% | Stats | wOBA | xwOBA | HC% | BB% | K% | GB% | ||
|---|---|---|---|---|---|---|---|---|---|---|---|---|---|---|---|
| SP vs. Left (2016-17) | 0.293 | 0.296 | 33.6% | 5.6% | 23.4% | 48.4% | SP vs. Left (2016-17) | 0.273 | 0.278 | 31.7% | 4.5% | 24.0% | 51.0% | ||
| SP vs. Right (2016-17) | 0.299 | 0.284 | 31.4% | 5.8% | 23.7% | 44.4% | SP vs. Right (2016-17) | 0.307 | 0.301 | 32.9% | 7.7% | 23.1% | 38.2% | ||
Pitcher Grind Down
| Zack Greinke | |||||||||
 | FanDuel | DraftKings | FantasyDraft | ||||||
| Salary: | $10,200 | Salary: | $12,200 | Salary: | |||||
| Salary Rank: | 2 of 26 | Salary Rank: | 3 of 26 | Salary Rank: | of 26 | ||||
| Stats | Starts | SIERA | ERA | K% | BB% | GB% | HC% | SC% | |
|---|---|---|---|---|---|---|---|---|---|
| 2016 | 26 | 4.11 | 4.37 | 20.1% | 6.2% | 45.9% | 30.7% | 20.3% | |
| 2017 | 21 | 3.30 | 2.84 | 27.9% | 5.1% | 47.3% | 35.1% | 21.7% | |
| L30 | 5 | 3.39 | 2.12 | 26.0% | 3.9% | 48.8% | 36.0% | 21.4% | |
Greinke has been solid all season. He has pitched well in difficult matchups, he has pitched well in bad ballparks, and he has pitched well on the road. In 21 starts, he owns a 3.30 SIERA with a strikeout rate of 28%. Surprisingly, he has allowed more hard contact this season, but that has yet to haunt him. He will try to do what Zack Godley did to the Cubs last night. The wind may be a difference maker though, instead of it blowing in at ten MPH like last night, it will be blowing out to left at close to ten MPH. Greinke is still viable in all formats given the lack of options, but he wouldn’t be a core play in a full slate.
Quick Breakdown: Greinke is viable in cash games and tournaments, even though he’s facing a good offense with the wind blowing out to left field.
| Jose Quintana | |||||||||
 | FanDuel | DraftKings | FantasyDraft | ||||||
| Salary: | $8,800 | Salary: | $10,100 | Salary: | |||||
| Salary Rank: | 5 of 26 | Salary Rank: | 2 of 26 | Salary Rank: | of 26 | ||||
| Stats | Starts | SIERA | ERA | K% | BB% | GB% | HC% | SC% | |
|---|---|---|---|---|---|---|---|---|---|
| 2016 | 32 | 4.01 | 3.20 | 21.6% | 6.0% | 40.4% | 32.7% | 18.6% | |
| 2017 | 21 | 3.97 | 4.16 | 26.0% | 8.7% | 42.2% | 32.5% | 17.6% | |
| L30 | 5 | 3.04 | 3.45 | 33.9% | 7.6% | 41.8% | 37.7% | 15.9% | |
Quintana is making his fourth start with the Cubs and so far, so good. He already has 25 strikeouts in a Cubs’ uniform, which is shown in his 34% strikeout rate in his last five outings. The Diamondbacks have two very good hitters against lefties, but the rest of their lineup is exploitable. If you look at the projected lineup below, six of their starters (including the pitcher) have an xwOBA under .320 against southpaws this season. Quintana is firmly in play here, even with the wind blowing out to left. He needs to pitch around Paul Goldschmidt and J.D. Martinez, but he should be in for a nice outing if he can accomplish that task.
Quick Breakdown: There are three viable pitching options in the early slate and it’s all going to come down to price. Quintana is viable in all formats.
Batter Grind Down
Arizona
Even though there is a helping wind headed out to left field, there are more negatives than positives in today’s matchup against Jose Quintana. In addition to the great form, Quintana has held both left and right-handed hitters under a .305 xwOBA in the last two seasons. Paul Goldschmidt and J.D. Martinez are two of the best hitters in baseball against lefties, but I see them as one-off tournament targets in a slate that features a Coors Field game.
Projected Lineup (Splits vs. LH Pitching)
| # | Player | Bats | wOBA | xwOBA | ISO | HC% | BB% | K% | GB% | FD Pos. | FD Sal. | DK Pos. | DK Sal. | FDRFT Pos. | FDRFT Sal. |
|---|---|---|---|---|---|---|---|---|---|---|---|---|---|---|---|
| 1 | David Peralta | LEFT | 0.335 | 0.317 | 0.152 | 28.6% | 2.8% | 14.1% | 57.1% | OF | $3,300 | OF | $2,900 | N/A | N/A |
| 2 | A.J. Pollock | RIGHT | 0.339 | 0.290 | 0.240 | 29.9% | 3.8% | 10.1% | 53.0% | OF | $3,700 | OF | $4,500 | N/A | N/A |
| 3 | Adam Rosales | RIGHT | 0.324 | 0.263 | 0.138 | 27.3% | 9.1% | 24.2% | 30.2% | SS | $2,300 | SS | $3,100 | N/A | N/A |
| 4 | Paul Goldschmidt | RIGHT | 0.339 | 0.389 | 0.133 | 50.0% | 18.9% | 17.9% | 47.0% | 1B | $4,600 | 1B | $5,000 | N/A | N/A |
| 5 | J.D. Martinez | RIGHT | 0.623 | 0.510 | 0.628 | 50.0% | 14.0% | 18.0% | 29.4% | OF | $4,100 | OF | $4,400 | N/A | N/A |
| 6 | Jake Lamb | LEFT | 0.244 | 0.244 | 0.179 | 30.4% | 12.4% | 39.2% | 63.0% | 3B | $3,700 | 3B | $3,700 | N/A | N/A |
| 7 | Brandon Drury | RIGHT | 0.263 | 0.267 | 0.114 | 23.6% | 1.2% | 29.6% | 50.9% | 2B | $2,200 | 2B | $2,400 | N/A | N/A |
| 8 | Jeff Mathis | RIGHT | 0.355 | 0.351 | 0.206 | 44.0% | 15.0% | 22.5% | 28.0% | C | $2,400 | C | $2,700 | N/A | N/A |
| 9 | Zack Greinke | RIGHT | 0.174 | 0.263 | 0.000 | 60.0% | 11.1% | 33.3% | 20.0% | P | $10,200 | P | $12,200 | N/A | N/A |
Elite Plays – None
Secondary Plays – Paul Goldschmidt, J.D. Martinez
Stackability – ORANGE
Chicago Cubs
The Cubs are in the same boat as the Diamondbacks. Despite a helping wind, there aren’t any hitters that stand out as elite plays in a slate that features a Coors Field game. Zack Greinke has been in great form all season and has held both left and right-handed hitters under a .295 xwOBA. I don’t make a habit of targeting hitters against elite pitchers, especially when there are viable alternatives.
Projected Lineup (Splits vs. RH Pitching)
| # | Player | Bats | wOBA | xwOBA | ISO | HC% | BB% | K% | GB% | FD Pos. | FD Sal. | DK Pos. | DK Sal. | FDRFT Pos. | FDRFT Sal. |
|---|---|---|---|---|---|---|---|---|---|---|---|---|---|---|---|
| 1 | Ben Zobrist | SWITCH | 0.316 | 0.333 | 0.151 | 34.9% | 11.5% | 12.3% | 54.1% | OF | $3,100 | 2B/OF | $3,100 | N/A | N/A |
| 2 | Kris Bryant | RIGHT | 0.372 | 0.324 | 0.225 | 30.4% | 11.7% | 20.9% | 38.6% | 3B | $4,100 | 3B | $4,500 | N/A | N/A |
| 3 | Anthony Rizzo | LEFT | 0.367 | 0.398 | 0.232 | 32.6% | 14.2% | 12.1% | 37.5% | 1B | $4,600 | 1B | $5,200 | N/A | N/A |
| 4 | Willson Contreras | RIGHT | 0.334 | 0.287 | 0.210 | 33.1% | 7.0% | 27.8% | 51.7% | C | $3,500 | C | $3,600 | N/A | N/A |
| 5 | Kyle Schwarber | LEFT | 0.318 | 0.363 | 0.255 | 35.6% | 11.7% | 27.0% | 41.9% | OF | $3,100 | OF | $3,800 | N/A | N/A |
| 6 | Addison Russell | RIGHT | 0.297 | 0.288 | 0.186 | 32.6% | 4.9% | 22.9% | 39.4% | SS | $2,700 | SS | $3,200 | N/A | N/A |
| 7 | Jason Heyward | LEFT | 0.316 | 0.325 | 0.155 | 27.8% | 8.4% | 11.6% | 48.5% | OF | $2,800 | OF | $3,000 | N/A | N/A |
| 8 | Jon Jay | LEFT | 0.345 | 0.305 | 0.103 | 25.2% | 9.9% | 21.0% | 50.0% | OF | $2,600 | OF | $3,100 | N/A | N/A |
| 9 | Jose Quintana | LEFT | 0.000 | 0.038 | 0.000 | 0.0% | 0.0% | 40.0% | 66.7% | P | $8,800 | P | $10,100 | N/A | N/A |
Elite Plays – None
Secondary Plays – Anthony Rizzo, Kyle Schwarber
Stackability – ORANGE
NY Mets at Colorado – 3:10 PM ET
| NY Mets | Colorado | ||||||||||||||
 | Rafael Montero |  | German Marquez | ||||||||||||
| RIGHT | RIGHT | ||||||||||||||
| Vegas Moneyline | Vegas Over/Under | ||||||||||||||
| COL-160 | 12.5 | ||||||||||||||
| Stats | wOBA | xwOBA | HC% | BB% | K% | GB% | Stats | wOBA | xwOBA | HC% | BB% | K% | GB% | ||
|---|---|---|---|---|---|---|---|---|---|---|---|---|---|---|---|
| SP vs. Left (2016-17) | 0.358 | 0.332 | 25.7% | 12.5% | 18.1% | 42.3% | SP vs. Left (2016-17) | 0.330 | 0.303 | 31.3% | 7.8% | 20.8% | 49.1% | ||
| SP vs. Right (2016-17) | 0.377 | 0.341 | 30.3% | 13.7% | 24.4% | 43.2% | SP vs. Right (2016-17) | 0.329 | 0.321 | 38.1% | 6.3% | 22.3% | 40.8% | ||
Pitcher Grind Down
| Rafael Montero | |||||||||
 | FanDuel | DraftKings | FantasyDraft | ||||||
| Salary: | $5,500 | Salary: | $4,000 | Salary: | |||||
| Salary Rank: | 25 of 26 | Salary Rank: | 25 of 26 | Salary Rank: | of 26 | ||||
| Stats | Starts | SIERA | ERA | K% | BB% | GB% | HC% | SC% | |
|---|---|---|---|---|---|---|---|---|---|
| 2016 | 3 | 5.40 | 8.05 | 21.5% | 17.2% | 35.7% | 31.6% | 17.5% | |
| 2017 | 7 | 4.71 | 5.56 | 21.6% | 11.7% | 45.2% | 27.0% | 17.2% | |
| L30 | 4 | 4.69 | 5.47 | 20.2% | 9.2% | 43.8% | 26.3% | 17.1% | |
The Rockies have only scored ten runs in the first two games of this series. While that’s not bad, that’s not very Coors-like. They seem poised for a breakout and Montero may be on the receiving end of it. He has not pitched well this season, posting a 4.71 SIERA with a walk rate of 12%. He isn’t particularly effective against left or right-handed hitters and we obviously don’t want to play him in Coors Field.
Quick Breakdown: Avoid Montero in all formats.
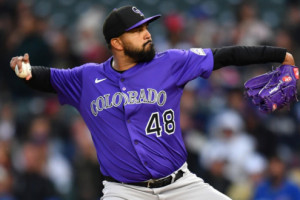
| German Marquez | |||||||||
 | FanDuel | DraftKings | FantasyDraft | ||||||
| Salary: | $7,000 | Salary: | $5,600 | Salary: | |||||
| Salary Rank: | 14 of 26 | Salary Rank: | 23 of 26 | Salary Rank: | of 26 | ||||
| Stats | Starts | SIERA | ERA | K% | BB% | GB% | HC% | SC% | |
|---|---|---|---|---|---|---|---|---|---|
| 2016 | 3 | 3.97 | 5.23 | 15.3% | 6.1% | 54.9% | 29.7% | 13.5% | |
| 2017 | 17 | 4.10 | 4.08 | 23.0% | 7.3% | 42.4% | 35.9% | 15.0% | |
| L30 | 5 | 3.07 | 3.51 | 29.8% | 5.3% | 48.2% | 34.5% | 16.7% | |
Marquez has looked good and bad at times this season. Overall, he has a mediocre 4.10 SIERA with a strikeout rate of 23%. His Achilles Heel has been his hard contact rate (35%). You don’t get away with giving up hard contact in this ballpark. A matchup against the Mets doesn’t help his cause, as New York is ranked tenth in team wOBA and second in strikeout rate against right-handed pitching this season.
Quick Breakdown: Avoid Marquez in all formats. This is the game to target for hitters in the early slate.
Batter Grind Down
NY Mets
The Mets are sizable underdogs today, but we can throw that out the window when it comes to Coors Field. This is the best hitter’s park in baseball and New York took full advantage last night by putting up ten runs. Hitters from both sides of the plate are viable targets here, but we should give a slight edge to those that bat from the right side. Since the start of last season, German Marquez has allowed a .321 xwOBA and a 38% hard contact rate to righties. Load up on the Mets’ offense in both cash games and tournaments.
Projected Lineup (Splits vs. RH Pitching)
| # | Player | Bats | wOBA | xwOBA | ISO | HC% | BB% | K% | GB% | FD Pos. | FD Sal. | DK Pos. | DK Sal. | FDRFT Pos. | FDRFT Sal. |
|---|---|---|---|---|---|---|---|---|---|---|---|---|---|---|---|
| 1 | Michael Conforto | LEFT | 0.419 | 0.392 | 0.298 | 41.7% | 14.1% | 21.7% | 36.2% | OF | $4,700 | OF | $5,300 | N/A | N/A |
| 2 | Asdrubal Cabrera | SWITCH | 0.312 | 0.359 | 0.161 | 36.4% | 11.2% | 14.5% | 42.0% | 3B | $3,600 | 2B/SS | $4,600 | N/A | N/A |
| 3 | Yoenis Cespedes | RIGHT | 0.338 | 0.329 | 0.173 | 40.5% | 6.0% | 15.5% | 37.4% | OF | $4,200 | OF | $4,900 | N/A | N/A |
| 4 | Jay Bruce | LEFT | 0.371 | 0.368 | 0.273 | 42.8% | 9.4% | 22.5% | 33.2% | OF | $4,300 | OF | $5,100 | N/A | N/A |
| 5 | Neil Walker | SWITCH | 0.359 | 0.365 | 0.220 | 34.9% | 9.2% | 13.3% | 36.2% | 2B | $3,600 | 2B | $3,900 | N/A | N/A |
| 6 | Wilmer Flores | RIGHT | 0.336 | 0.327 | 0.186 | 33.8% | 6.1% | 13.3% | 36.6% | 1B | $3,700 | 1B/3B | $4,200 | N/A | N/A |
| 7 | Amed Rosario | RIGHT | SS | $3,000 | SS | $3,800 | N/A | N/A | |||||||
| 8 | Rene Rivera | RIGHT | 0.262 | 0.315 | 0.099 | 31.8% | 5.3% | 26.0% | 43.7% | C | $3,200 | C | $2,300 | N/A | N/A |
| 9 | Rafael Montero | RIGHT | 0.110 | 0.130 | 0.000 | 0.0% | 0.0% | 37.5% | 75.0% | P | $5,500 | P | $4,000 | N/A | N/A |
Elite Plays – Michael Conforto, Yoenis Cespedes, Jay Bruce, Neil Walker
Secondary Plays – Asdrubal Cabrera, Wilmer Flores, Amed Rosario
Stackability – YELLOW / GREEN
Colorado
The Rockies have the highest implied run total in the slate and it’s not particularly close. They draw an exploitable matchup against Rafael Montero and they get to face him at home in Coors Field. Montero hasn’t allowed a ton of hard contact, but he has given up a .337+ xwOBA to both left and right-handed pitchers in the last two seasons. Fading the chalk can be profitable in tournaments, but I’m going to eat the Rockies’ chalk in this case. I will be stacking the Rockies in both cash games and tournaments.
Projected Lineup (Splits vs. RH Pitching)
| # | Player | Bats | wOBA | xwOBA | ISO | HC% | BB% | K% | GB% | FD Pos. | FD Sal. | DK Pos. | DK Sal. | FDRFT Pos. | FDRFT Sal. |
|---|---|---|---|---|---|---|---|---|---|---|---|---|---|---|---|
| 1 | Charlie Blackmon | LEFT | 0.404 | 0.351 | 0.290 | 39.0% | 7.9% | 22.5% | 35.8% | OF | $4,900 | OF | $5,500 | N/A | N/A |
| 2 | DJ LeMahieu | RIGHT | 0.306 | 0.319 | 0.059 | 26.7% | 8.1% | 13.7% | 57.3% | 2B | $3,800 | 2B | $5,200 | N/A | N/A |
| 3 | Nolan Arenado | RIGHT | 0.339 | 0.321 | 0.228 | 36.4% | 7.3% | 18.7% | 36.1% | 3B | $4,800 | 3B | $5,400 | N/A | N/A |
| 4 | Mark Reynolds | RIGHT | 0.403 | 0.337 | 0.264 | 33.7% | 9.3% | 27.7% | 43.1% | 1B | $4,000 | 1B | $4,800 | N/A | N/A |
| 5 | Gerardo Parra | LEFT | 0.379 | 0.332 | 0.205 | 37.7% | 4.4% | 13.2% | 46.9% | OF | $3,700 | OF | $5,100 | N/A | N/A |
| 6 | Trevor Story | RIGHT | 0.281 | 0.268 | 0.148 | 34.3% | 9.3% | 34.8% | 34.6% | SS | $3,700 | SS | $4,600 | N/A | N/A |
| 7 | Carlos Gonzalez | LEFT | 0.290 | 0.302 | 0.125 | 25.4% | 11.3% | 19.8% | 46.9% | OF | $3,600 | OF | $3,600 | N/A | N/A |
| 8 | Jonathan Lucroy | RIGHT | 0.281 | 0.302 | 0.093 | 23.8% | 7.2% | 11.4% | 54.5% | C | $3,200 | C | $3,500 | N/A | N/A |
| 9 | German Marquez | RIGHT | 0.152 | 0.154 | 0.000 | 23.5% | 0.0% | 34.6% | 78.6% | P | $7,000 | P | $5,600 | N/A | N/A |
Elite Plays – Charlie Blackmon, DJ LeMahieu, Nolan Arenado, Mark Reynolds, Gerardo Parra
Secondary Plays – Trevor Story, Carlos Gonzalez, Jonathan Lucroy
Stackability – GREEN
Cincinnati at Pittsburgh – 7:05 PM ET
| Cincinnati | Pittsburgh | ||||||||||||||
 | Sal Romano |  | Chad Kuhl | ||||||||||||
| RIGHT | RIGHT | ||||||||||||||
| Vegas Moneyline | Vegas Over/Under | ||||||||||||||
| PIT-160 | 9.0 | ||||||||||||||
| Stats | wOBA | xwOBA | HC% | BB% | K% | GB% | Stats | wOBA | xwOBA | HC% | BB% | K% | GB% | ||
|---|---|---|---|---|---|---|---|---|---|---|---|---|---|---|---|
| SP vs. Left (2016-17) | 0.325 | 0.315 | 35.7% | 16.0% | 26.0% | 34.6% | SP vs. Left (2016-17) | 0.374 | 0.342 | 36.8% | 9.8% | 18.5% | 38.6% | ||
| SP vs. Right (2016-17) | 0.397 | 0.294 | 24.2% | 17.3% | 19.2% | 60.0% | SP vs. Right (2016-17) | 0.298 | 0.301 | 29.7% | 7.5% | 18.3% | 48.9% | ||
Pitcher Grind Down
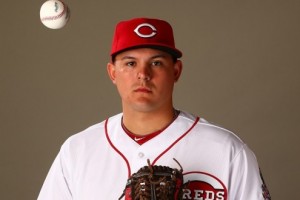
| Sal Romano | |||||||||
 | FanDuel | DraftKings | FantasyDraft | ||||||
| Salary: | $5,600 | Salary: | $6,400 | Salary: | $12,800 | ||||
| Salary Rank: | 24 of 26 | Salary Rank: | 20 of 26 | Salary Rank: | 10 of 26 | ||||
| Stats | Starts | SIERA | ERA | K% | BB% | GB% | HC% | SC% | |
|---|---|---|---|---|---|---|---|---|---|
| 2017 | 5 | 5.46 | 4.57 | 22.6% | 16.7% | 48.2% | 29.5% | 21.3% | |
| L30 | 4 | 4.92 | 4.34 | 25.0% | 15.5% | 54.3% | 28.0% | 18.0% | |
Romano has a 23% strikeout rate in his first five major league starts, but we shouldn’t be buying what he’s selling. In ten Triple-A starts earlier this year, his strikeout rate was only 15%. Basically, it’s only a matter of time before the big leagues figure him out and start making better contact. His command is also a concern (17%) and he comes into tonight’s game as a large underdog against a Pirates’ offense that has the second lowest strikeout rate against right-handed pitching this season.
Quick Breakdown: Avoid Romano in all formats.
| Chad Kuhl | |||||||||
 | FanDuel | DraftKings | FantasyDraft | ||||||
| Salary: | $5,900 | Salary: | $5,700 | Salary: | $11,200 | ||||
| Salary Rank: | 22 of 26 | Salary Rank: | 18 of 26 | Salary Rank: | 15 of 26 | ||||
| Stats | Starts | SIERA | ERA | K% | BB% | GB% | HC% | SC% | |
|---|---|---|---|---|---|---|---|---|---|
| 2016 | 14 | 4.50 | 4.20 | 17.6% | 6.6% | 44.3% | 33.0% | 19.6% | |
| 2017 | 21 | 4.87 | 4.84 | 18.9% | 9.9% | 43.9% | 33.0% | 17.0% | |
| L30 | 6 | 5.03 | 3.27 | 18.7% | 11.9% | 48.9% | 33.7% | 20.7% | |
Kuhl isn’t having a great season overall, posting a 4.87 SIERA with a strikeout rate of 19% and a walk rate of 10%. The opposing lineup matters for all pitcher, but especially for Kuhl, who has some drastic splits. He has been very tough on righties, but has allowed a .342 xwOBA to lefties since the start of last season. He should have the platoon advantage tonight against the Reds, although he will still have to face the likes of Joey Votto, Scooter Gennett, and Jesse Winker.
Quick Breakdown: Kuhl is a decent value at the price, but he’s far from a core play in this slate.
Batter Grind Down
Cincinnati
The Reds’ matchup against Chad Kuhl is one of the easiest to break down in the slate. In case you skipped over the Kuhl blurb above, I’ll repeat what I said. He is very tough on right-handed hitters, but has allowed a .342 xwOBA and a 37% hard contact rate to left-handed hitters. Rookie Jesse Winker provides nice value if he’s batting second again, while Joey Votto and Scooter Gennett are viable one-off targets.
Projected Lineup (Splits vs. RH Pitching)
| # | Player | Bats | wOBA | xwOBA | ISO | HC% | BB% | K% | GB% | FD Pos. | FD Sal. | DK Pos. | DK Sal. | FDRFT Pos. | FDRFT Sal. |
|---|---|---|---|---|---|---|---|---|---|---|---|---|---|---|---|
| 1 | Billy Hamilton | SWITCH | 0.300 | 0.266 | 0.081 | 17.9% | 8.9% | 20.3% | 45.7% | OF | $3,600 | OF | $4,700 | CF | $9,200 |
| 2 | Jesse Winker | LEFT | 0.339 | 0.380 | 0.077 | 45.5% | 23.5% | 11.8% | 45.5% | OF | $2,300 | OF | $3,100 | LF | $6,000 |
| 3 | Joey Votto | LEFT | 0.416 | 0.423 | 0.262 | 36.2% | 17.2% | 11.7% | 36.2% | 1B | $4,000 | 1B | $5,100 | 1B | $10,000 |
| 4 | Adam Duvall | RIGHT | 0.337 | 0.289 | 0.247 | 34.2% | 5.1% | 27.7% | 30.7% | OF | $3,700 | OF | $4,800 | IF/OF | $9,200 |
| 5 | Scooter Gennett | LEFT | 0.431 | 0.359 | 0.312 | 41.5% | 6.3% | 20.7% | 41.1% | 2B | $2,900 | 2B/OF | $4,600 | 2B | $9,000 |
| 6 | Eugenio Suarez | RIGHT | 0.341 | 0.336 | 0.193 | 29.3% | 11.0% | 23.2% | 43.9% | 3B | $3,100 | 3B | $4,000 | 3B | $7,600 |
| 7 | Jose Peraza | RIGHT | 0.255 | 0.268 | 0.077 | 19.7% | 1.8% | 14.3% | 42.9% | SS | $2,500 | 2B/SS | $3,400 | 2B | $6,600 |
| 8 | Tucker Barnhart | SWITCH | 0.311 | 0.325 | 0.128 | 34.6% | 7.5% | 14.9% | 43.3% | C | $2,200 | C | $2,900 | C | $5,700 |
| 9 | Sal Romano | RIGHT | 0.000 | 0.077 | 0.000 | 25.0% | 0.0% | 33.3% | 100.0% | P | $5,600 | P | $6,400 | P | $12,800 |
Elite Plays – None
Secondary Plays – Jesse Winker, Joey Votto, Scooter Gennett
Stackability – ORANGE
Pittsburgh
We shouldn’t put a ton of stock into Sal Romano splits in his first five major league starts. As mentioned above, he had a 15% strikeout rate in the minors this season, so we should expect some regression moving forward. The Pirates’ offense has been tilting this season, but once again, they have a high implied run total. I’m not going to label the stack YELLOW / GREEN again, because that clearly isn’t working. There are some viable one-off targets though, including Adam Frazier, Andrew McCutchen, and Josh Bell.
Projected Lineup (Splits vs. RH Pitching)
| # | Player | Bats | wOBA | xwOBA | ISO | HC% | BB% | K% | GB% | FD Pos. | FD Sal. | DK Pos. | DK Sal. | FDRFT Pos. | FDRFT Sal. |
|---|---|---|---|---|---|---|---|---|---|---|---|---|---|---|---|
| 1 | Starling Marte | RIGHT | 0.320 | 0.280 | 0.096 | 23.6% | 4.9% | 23.5% | 51.9% | OF | $3,000 | OF | $3,900 | CF | $7,600 |
| 2 | Adam Frazier | LEFT | 0.314 | 0.332 | 0.113 | 29.7% | 8.5% | 11.6% | 49.0% | OF | $2,800 | OF | $4,100 | IF/OF | $8,000 |
| 3 | Andrew McCutchen | RIGHT | 0.349 | 0.357 | 0.179 | 34.3% | 10.5% | 17.4% | 41.1% | OF | $4,000 | OF | $5,400 | RF | $10,500 |
| 4 | Josh Bell | SWITCH | 0.341 | 0.333 | 0.231 | 34.5% | 10.2% | 21.3% | 51.2% | 1B | $3,500 | 1B | $3,400 | IF/OF | $6,600 |
| 5 | David Freese | RIGHT | 0.321 | 0.346 | 0.106 | 30.3% | 12.1% | 20.1% | 55.9% | 3B | $3,000 | 3B | $3,200 | 3B | $6,300 |
| 6 | Gregory Polanco | LEFT | 0.321 | 0.314 | 0.175 | 25.5% | 7.2% | 11.0% | 40.6% | OF | $3,100 | OF | $4,300 | RF | $8,400 |
| 7 | Francisco Cervelli | RIGHT | 0.337 | 0.341 | 0.137 | 33.3% | 10.5% | 20.0% | 48.6% | C | $2,400 | C | $2,300 | C | $4,400 |
| 8 | Jordy Mercer | RIGHT | 0.326 | 0.315 | 0.151 | 27.2% | 10.5% | 14.9% | 45.9% | SS | $2,400 | SS | $3,000 | SS | $6,000 |
| 9 | Chad Kuhl | RIGHT | 0.030 | 0.142 | 0.000 | 33.3% | 4.2% | 33.3% | 66.7% | P | $5,900 | P | $5,700 | P | $11,200 |
Elite Plays – None
Secondary Plays – Adam Frazier, Andrew McCutchen, Josh Bell
Stackability – YELLOW
| Detroit | Baltimore | ||||||||||||||
 | Matt Boyd |  | Chris Tillman | ||||||||||||
| LEFT | RIGHT | ||||||||||||||
| Vegas Moneyline | Vegas Over/Under | ||||||||||||||
| BAL-126 | 10.5 | ||||||||||||||
| Stats | wOBA | xwOBA | HC% | BB% | K% | GB% | Stats | wOBA | xwOBA | HC% | BB% | K% | GB% | ||
|---|---|---|---|---|---|---|---|---|---|---|---|---|---|---|---|
| SP vs. Left (2016-17) | 0.288 | 0.289 | 22.7% | 6.9% | 16.2% | 55.7% | SP vs. Left (2016-17) | 0.348 | 0.345 | 31.2% | 12.9% | 19.7% | 41.8% | ||
| SP vs. Right (2016-17) | 0.351 | 0.328 | 35.5% | 7.8% | 18.5% | 36.7% | SP vs. Right (2016-17) | 0.345 | 0.347 | 33.9% | 6.6% | 17.4% | 39.6% | ||
Pitcher Grind Down
| Matt Boyd | |||||||||
 | FanDuel | DraftKings | FantasyDraft | ||||||
| Salary: | $6,600 | Salary: | $5,000 | Salary: | $10,000 | ||||
| Salary Rank: | 17 of 26 | Salary Rank: | 17 of 26 | Salary Rank: | 18 of 26 | ||||
| Stats | Starts | SIERA | ERA | K% | BB% | GB% | HC% | SC% | |
|---|---|---|---|---|---|---|---|---|---|
| 2016 | 18 | 4.38 | 4.53 | 19.9% | 7.0% | 38.1% | 30.0% | 19.2% | |
| 2017 | 14 | 5.10 | 5.30 | 15.8% | 8.4% | 42.4% | 37.2% | 20.6% | |
| L30 | 3 | 4.30 | 4.19 | 20.5% | 5.1% | 37.5% | 21.1% | 33.3% | |
We know that the Orioles have struggled against left-handed pitching this season, but it’s going to take more than that for me to roster Matt Boyd. In 14 starts this season, he has a 5.10 SIERA with a strikeout rate of 16% and a hard contact rate of 37%. To make matters worse, he is pitching on the road in a hitter-friendly environment and he is facing a team that is still trying to win baseball games.
Quick Breakdown: Boyd is a hard pass for me tonight, even though Baltimore has struggled against southpaws.
| Chris Tillman | |||||||||
 | FanDuel | DraftKings | FantasyDraft | ||||||
| Salary: | $6,100 | Salary: | $4,800 | Salary: | $9,600 | ||||
| Salary Rank: | 20 of 26 | Salary Rank: | 12 of 26 | Salary Rank: | 19 of 26 | ||||
| Stats | Starts | SIERA | ERA | K% | BB% | GB% | HC% | SC% | |
|---|---|---|---|---|---|---|---|---|---|
| 2016 | 30 | 4.61 | 3.77 | 19.6% | 9.2% | 41.2% | 31.5% | 18.3% | |
| 2017 | 14 | 5.35 | 7.65 | 15.9% | 10.2% | 39.1% | 35.5% | 18.6% | |
| L30 | 4 | 4.60 | 6.10 | 20.9% | 8.8% | 36.5% | 33.3% | 14.3% | |
Tillman might be having a worse season than Matt Boyd and that’s saying something. In 14 starts, he has a 5.35 SIERA with a walk rate of 10% and a hard contact rate of 35%. The Tigers haven’t been great against right-handed pitching this season, but their expected wOBA is significantly higher than their actual wOBA, which suggests some positive regression moving forward. Tillman doesn’t have the strikeout upside to make up for his mistakes, especially in this ballpark.
Quick Breakdown: Avoid Tillman in all formats.
Batter Grind Down
Detroit
The Tigers have little to play for at this point of the season, but they draw one of the best matchups in the slate. In addition to the low strikeout rate and high walk rate, Chris Tillman has allowed a .345+ xwOBA to both left and right-handed hitters. Say what you want about this lineup, but they hit the ball incredibly hard. Every single starter in their projected lineup has a 35%+ hard contact rate against right-handed pitching this season.
Projected Lineup (Splits vs. RH Pitching)
| # | Player | Bats | wOBA | xwOBA | ISO | HC% | BB% | K% | GB% | FD Pos. | FD Sal. | DK Pos. | DK Sal. | FDRFT Pos. | FDRFT Sal. |
|---|---|---|---|---|---|---|---|---|---|---|---|---|---|---|---|
| 1 | Ian Kinsler | RIGHT | 0.303 | 0.314 | 0.115 | 34.7% | 10.4% | 12.5% | 32.9% | 2B | $3,100 | 2B | $4,000 | 2B | $7,600 |
| 2 | Jim Adduci | LEFT | 0.328 | 0.350 | 0.174 | 57.1% | 9.8% | 21.6% | 54.3% | OF | $2,100 | OF | $2,900 | LF | $5,600 |
| 3 | Justin Upton | RIGHT | 0.351 | 0.351 | 0.221 | 42.7% | 12.5% | 27.9% | 36.8% | OF | $3,900 | OF | $5,000 | LF | $9,600 |
| 4 | Miguel Cabrera | RIGHT | 0.314 | 0.385 | 0.184 | 46.0% | 10.0% | 20.1% | 42.0% | 1B | $3,600 | 1B | $4,500 | 1B | $8,800 |
| 5 | Nick Castellanos | RIGHT | 0.295 | 0.334 | 0.145 | 45.1% | 7.3% | 25.6% | 40.9% | 3B | $2,800 | 3B | $4,600 | 3B | $8,800 |
| 6 | Victor Martinez | SWITCH | 0.308 | 0.375 | 0.133 | 43.5% | 8.9% | 13.0% | 39.3% | C | $2,700 | 1B | $3,300 | 1B | $6,600 |
| 7 | Mikie Mahtook | RIGHT | 0.344 | 0.316 | 0.139 | 34.6% | 6.4% | 21.8% | 48.1% | OF | $2,900 | OF | $4,500 | CF | $8,800 |
| 8 | James McCann | RIGHT | 0.242 | 0.303 | 0.105 | 43.4% | 8.3% | 26.5% | 39.0% | C | $2,600 | C | $4,400 | C | $8,400 |
| 9 | Dixon Machado | RIGHT | 0.397 | 0.321 | 0.118 | 42.2% | 3.8% | 11.3% | 53.3% | 2B | $2,300 | 2B/SS | $3,400 | SS | $6,600 |
Elite Plays – Ian Kinsler, Miguel Cabrera
Secondary Plays – Jim Adduci, Justin Upton, Nick Castellanos, Victor Martinez
Stackability – YELLOW / GREEN
Baltimore
The Orioles are similar to the Tigers in that their expected wOBA is a lot higher than their actual wOBA, although with Baltimore we are talking about left-handed pitching. The gap between the two suggests some positive regression, particularly for Manny Machado and Trey Mancini. I love targeting right-handed hitters against Matt Boyd, as he has given up a .351 xwOBA and a 36% hard contact to righties since the start of last season. An Orioles’ stack isn’t the worst play in the world, especially since it should be fairly low owned.
Projected Lineup (Splits vs. LH Pitching)
| # | Player | Bats | wOBA | xwOBA | ISO | HC% | BB% | K% | GB% | FD Pos. | FD Sal. | DK Pos. | DK Sal. | FDRFT Pos. | FDRFT Sal. |
|---|---|---|---|---|---|---|---|---|---|---|---|---|---|---|---|
| 1 | Adam Jones | RIGHT | 0.321 | 0.310 | 0.186 | 30.8% | 6.3% | 22.3% | 37.7% | OF | $3,400 | OF | $3,600 | CF | $7,200 |
| 2 | Manny Machado | RIGHT | 0.315 | 0.388 | 0.214 | 50.6% | 8.8% | 18.4% | 43.9% | 3B | $3,800 | 3B | $4,600 | 3B | $9,000 |
| 3 | Jonathan Schoop | RIGHT | 0.385 | 0.386 | 0.296 | 40.5% | 8.3% | 22.9% | 43.2% | 2B | $3,900 | 2B | $5,200 | 2B | $10,000 |
| 4 | Trey Mancini | RIGHT | 0.289 | 0.331 | 0.155 | 33.8% | 3.7% | 24.1% | 49.4% | OF | $3,000 | 1B/OF | $4,300 | 1B | $8,400 |
| 5 | Chris Davis | LEFT | 0.314 | 0.335 | 0.163 | 34.0% | 10.1% | 38.4% | 34.0% | 1B | $3,400 | 1B | $4,100 | IF/OF | $8,100 |
| 6 | Welington Castillo | RIGHT | 0.336 | 0.345 | 0.125 | 42.2% | 4.5% | 28.4% | 33.3% | C | $3,100 | C | $4,300 | C | $8,400 |
| 7 | Tim Beckham | RIGHT | 0.318 | 0.326 | 0.135 | 36.7% | 9.1% | 29.3% | 50.0% | SS | $2,500 | SS | $4,400 | SS | $8,400 |
| 8 | Joey Rickard | RIGHT | 0.302 | 0.278 | 0.100 | 29.7% | 6.1% | 18.4% | 33.3% | OF | $2,100 | OF | $3,000 | RF | $6,000 |
| 9 | Craig Gentry | RIGHT | 0.245 | 0.253 | 0.121 | 19.1% | 12.8% | 33.3% | 61.1% | OF | $2,100 | OF | $3,100 | LF | $6,000 |