MLB Grind Down: Thursday, September 14th

Jump to Page 1 2 3
The RotoGrinders MLB Grind Down will give you an in-depth analysis into the upcoming MLB schedule. This article will break down the numbers for every single game and give you analysis on which trends you can exploit. While matchups are a major factor in daily fantasy baseball, there are plenty of other factors to consider such as injuries, weather, and salaries.
The analysis should point you in the right direction, but it is still up to you to decipher the information and make your own selections. No sport has more variance than baseball. The best choice is not always the right choice but following the trends will win you money over time.
Note: As always, if you want to try a new DFS site, be sure to click through a RotoGrinders link and use our DraftKings promo code, FanDuel promo code, and FantasyDraft promo code to receive the best perks in the industry.
Stackability Rating System:
GREEN – A viable full stack in cash games and GPPs.
YELLOW – A viable mini-stack in cash games and full stack in GPPs.
ORANGE – A viable stack in large field GPPs.
RED – Not a recommended stack for cash games or GPPs.
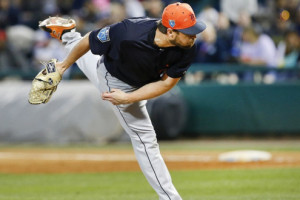
Chicago White Sox at Detroit – 1:10 PM ET
| Chicago White Sox | Detroit | ||||||||||||||
 | James Shields |  | Chad Bell | ||||||||||||
| RIGHT | LEFT | ||||||||||||||
| Vegas Moneyline | Vegas Over/Under | ||||||||||||||
| DET-123 | 10.0 | ||||||||||||||
| Stats | wOBA | xwOBA | HC% | BB% | K% | GB% | Stats | wOBA | xwOBA | HC% | BB% | K% | GB% | ||
|---|---|---|---|---|---|---|---|---|---|---|---|---|---|---|---|
| SP vs. Left (2016-17) | 0.397 | 0.373 | 33.1% | 12.5% | 16.3% | 39.5% | SP vs. Left (2016-17) | 0.328 | 0.315 | 38.3% | 10.5% | 26.3% | 46.8% | ||
| SP vs. Right (2016-17) | 0.298 | 0.323 | 32.1% | 8.4% | 22.3% | 37.1% | SP vs. Right (2016-17) | 0.390 | 0.386 | 42.2% | 10.7% | 15.1% | 47.4% | ||
Pitcher Grind Down
| James Shields | |||||||||
 | FanDuel | DraftKings | FantasyDraft | ||||||
| Salary: | $6,400 | Salary: | $7,700 | Salary: | |||||
| Salary Rank: | 18 of 23 | Salary Rank: | 10 of 23 | Salary Rank: | of 23 | ||||
| Stats | Starts | SIERA | ERA | K% | BB% | GB% | HC% | SC% | |
|---|---|---|---|---|---|---|---|---|---|
| 2016 | 33 | 5.12 | 5.85 | 16.4% | 10.0% | 40.4% | 33.8% | 15.3% | |
| 2017 | 18 | 5.09 | 5.40 | 19.1% | 10.6% | 38.4% | 32.7% | 18.2% | |
| L30 | 6 | 4.50 | 4.29 | 22.8% | 10.3% | 43.8% | 27.8% | 19.6% | |
There are four early games on the schedule, three of which are included in the early-only slate. The Rockies/Diamondbacks game is included in the all-day slates, so we will cover that one as well. We start our day with a familiar face in James Shields. He’s been around longer than DFS and he’s been a punching bag for most of that time. In 18 starts this season, he has a 5.09 SIERA with a strikeout rate of 19% and a walk rate of 11%. He is a fly-ball pitcher that gives up a lot of hard contact. While I’ve been streaming pitchers against the Tigers recently, all good things must come to an end.
Quick Breakdown: Shields should be avoided in both cash games and tournaments.
| Chad Bell | |||||||||
 | FanDuel | DraftKings | FantasyDraft | ||||||
| Salary: | $5,500 | Salary: | $5,900 | Salary: | |||||
| Salary Rank: | 23 of 23 | Salary Rank: | 19 of 23 | Salary Rank: | of 23 | ||||
| Stats | Starts | SIERA | ERA | K% | BB% | GB% | HC% | SC% | |
|---|---|---|---|---|---|---|---|---|---|
| 2017 | 2 | 4.66 | 5.79 | 18.7% | 10.6% | 47.2% | 41.1% | 16.6% | |
| L30 | 2 | 5.11 | 6.00 | 19.4% | 13.9% | 51.1% | 34.0% | 19.2% | |
Bell is a southpaw that is making this third career major league start tonight against the White Sox. He’s not a top pitching prospect by any means, posting a 3.63 FIP with a strikeout rate of 22 starts at the Triple-A level this season. He’s basically a minor league journeyman that is getting a few starts since the Tigers have nothing to play for. I love to root for players in these situations, but I don’t target them in DFS. The Tigers are slight favorites today against the White Sox, but the game features a massive total of 10.0 runs.
Quick Breakdown: Both pitchers in this game can be avoided in what I expect to be a shootout.
Batter Grind Down
Chicago White Sox
This game features two of the worst offenses in baseball and the total is set at 10.0 runs. That tells you all you need to know about these two pitchers. Chad Bell has been in the minor leagues a long time (28 years old) and hasn’t done anything that really stands out. He has struggled with his command in his first two major league starts and has allowed a .386 xwOBA to right-handed hitters. Much like yesterday’s game, I will be loading up on the righties in the White Sox lineup.
Projected Lineup (Splits vs. LH Pitching)
| # | Player | Bats | wOBA | xwOBA | ISO | HC% | BB% | K% | GB% | FD Pos. | FD Sal. | DK Pos. | DK Sal. | FDRFT Pos. | FDRFT Sal. |
|---|---|---|---|---|---|---|---|---|---|---|---|---|---|---|---|
| 1 | Tim Anderson | RIGHT | 0.345 | 0.305 | 0.171 | 30.2% | 1.4% | 24.3% | 50.0% | SS | $3,500 | SS | $3,800 | N/A | N/A |
| 2 | Yoan Moncada | SWITCH | 0.233 | 0.202 | 0.114 | 26.9% | 8.2% | 36.7% | 50.0% | 2B | $3,000 | 2B | $3,900 | N/A | N/A |
| 3 | Jose Abreu | RIGHT | 0.459 | 0.419 | 0.292 | 40.8% | 7.7% | 18.9% | 45.6% | 1B | $4,000 | 1B | $4,800 | N/A | N/A |
| 4 | Avisail Garcia | RIGHT | 0.438 | 0.332 | 0.167 | 40.9% | 4.2% | 18.3% | 52.7% | OF | $4,000 | OF | $4,300 | N/A | N/A |
| 5 | Matt Davidson | RIGHT | 0.328 | 0.319 | 0.222 | 30.3% | 5.6% | 31.5% | 28.8% | 3B | $2,200 | 1B/3B | $3,400 | N/A | N/A |
| 6 | Kevan Smith | RIGHT | 0.254 | 0.278 | 0.120 | 22.1% | 1.0% | 13.6% | 61.2% | C | $2,200 | C | $2,800 | N/A | N/A |
| 7 | Yolmer Sanchez | SWITCH | 0.291 | 0.240 | 0.140 | 17.4% | 5.8% | 23.1% | 42.0% | 2B | $4,200 | 2B/3B | $4,300 | N/A | N/A |
| 8 | Rymer Liriano | RIGHT | 0.438 | 0.000 | 0.0% | 0.0% | 0.0% | 100.0% | OF | $3,200 | N/A | N/A | |||
| 9 | Adam Engel | RIGHT | 0.292 | 0.243 | 0.147 | 21.7% | 7.9% | 28.9% | 42.2% | OF | $2,500 | OF | $3,400 | N/A | N/A |
Elite Plays – Tim Anderson, Jose Abreu
Secondary Plays – Yoan Moncada, Avisail Garcia, Matt Davidson
Stackability – YELLOW / GREEN
Detroit
The Tigers may have the best matchup in the early slate. James Shields has flashed some decent form recently, but I’m trusting the larger sample size here. He has a high walk rate and he’s a fly-ball pitcher that gives up a lot of hard contact. On the season, he has allowed a .373 xwOBA to left-handed hitters and a .323 xwOBA to right-handed hitters. When it comes to BvP, Miguel Cabrera leads the way. He is 24-for-67 with three home runs and ten doubles against Shields in his career.
Projected Lineup (Splits vs. RH Pitching)
| # | Player | Bats | wOBA | xwOBA | ISO | HC% | BB% | K% | GB% | FD Pos. | FD Sal. | DK Pos. | DK Sal. | FDRFT Pos. | FDRFT Sal. |
|---|---|---|---|---|---|---|---|---|---|---|---|---|---|---|---|
| 1 | Ian Kinsler | RIGHT | 0.292 | 0.308 | 0.136 | 34.9% | 8.9% | 13.9% | 35.8% | 2B | $3,000 | 2B | $3,800 | N/A | N/A |
| 2 | Alex Presley | LEFT | 0.327 | 0.300 | 0.090 | 31.5% | 6.0% | 17.9% | 47.2% | OF | $2,500 | OF | $3,500 | N/A | N/A |
| 3 | Miguel Cabrera | RIGHT | 0.292 | 0.380 | 0.150 | 44.1% | 9.3% | 20.3% | 40.6% | 1B | $2,800 | 1B | $3,100 | N/A | N/A |
| 4 | Nick Castellanos | RIGHT | 0.307 | 0.347 | 0.169 | 44.3% | 6.5% | 23.9% | 37.1% | 3B | $3,300 | 3B | $3,500 | N/A | N/A |
| 5 | Jeimer Candelario | SWITCH | 0.296 | 0.270 | 0.125 | 28.6% | 9.3% | 24.1% | 45.7% | 3B | $2,600 | 3B | $3,000 | N/A | N/A |
| 6 | Tyler Collins | LEFT | 0.286 | 0.292 | 0.140 | 39.0% | 11.7% | 32.1% | 32.9% | OF | $2,100 | OF | $2,800 | N/A | N/A |
| 7 | James McCann | RIGHT | 0.289 | 0.308 | 0.118 | 40.7% | 6.5% | 27.4% | 36.8% | C | $2,300 | C | $2,800 | N/A | N/A |
| 8 | JaCoby Jones | RIGHT | 0.234 | 0.228 | 0.082 | 28.6% | 10.1% | 37.7% | 55.9% | OF | $2,000 | OF | $2,800 | N/A | N/A |
| 9 | Jose Iglesias | RIGHT | 0.300 | 0.267 | 0.128 | 29.4% | 4.3% | 14.7% | 52.4% | SS | $2,700 | SS | $2,800 | N/A | N/A |
Elite Plays – Ian Kinsler, Miguel Cabrera, Nick Castellanos
Secondary Plays – Alex Presley, Jeimer Candelario, Tyler Collins, James McCann
Stackability – YELLOW / GREEN
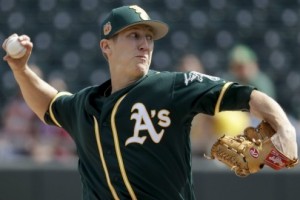
Oakland at Boston – 1:35 PM ET
| Oakland | Boston | ||||||||||||||
 | Daniel Gossett |  | Drew Pomeranz | ||||||||||||
| RIGHT | LEFT | ||||||||||||||
| Vegas Moneyline | Vegas Over/Under | ||||||||||||||
| BOS-210 | 10.0 | ||||||||||||||
| Stats | wOBA | xwOBA | HC% | BB% | K% | GB% | Stats | wOBA | xwOBA | HC% | BB% | K% | GB% | ||
|---|---|---|---|---|---|---|---|---|---|---|---|---|---|---|---|
| SP vs. Left (2016-17) | 0.334 | 0.329 | 26.4% | 8.4% | 14.7% | 49.5% | SP vs. Left (2016-17) | 0.357 | 0.308 | 33.3% | 9.6% | 28.2% | 37.1% | ||
| SP vs. Right (2016-17) | 0.365 | 0.371 | 35.7% | 6.2% | 21.2% | 40.6% | SP vs. Right (2016-17) | 0.294 | 0.308 | 31.9% | 9.2% | 23.3% | 43.9% | ||
Pitcher Grind Down
| Daniel Gossett | |||||||||
 | FanDuel | DraftKings | FantasyDraft | ||||||
| Salary: | $6,700 | Salary: | $6,500 | Salary: | |||||
| Salary Rank: | 14 of 23 | Salary Rank: | 13 of 23 | Salary Rank: | of 23 | ||||
| Stats | Starts | SIERA | ERA | K% | BB% | GB% | HC% | SC% | |
|---|---|---|---|---|---|---|---|---|---|
| 2017 | 14 | 4.56 | 5.02 | 18.5% | 7.1% | 44.5% | 31.6% | 16.8% | |
| L30 | 4 | 4.40 | 4.64 | 24.2% | 11.1% | 43.5% | 35.9% | 17.2% | |
Gossett hasn’t been great in his rookie season, but he’s known as a pitcher that can adapt and continuously improve. He was never considered to be a top pitching prospect, yet here he is making his 15th start of the season. For DFS purposes, he’s one of the easiest fades in the slate, as he squares off against the Red Sox in Fenway Park. Not only is this one of the best hitter’s parks in baseball, but Boston has the second lowest k-rate against right-handed pitching this season.
Quick Breakdown: Gossett should be avoided in both cash games and tournaments.
| Drew Pomeranz | |||||||||
 | FanDuel | DraftKings | FantasyDraft | ||||||
| Salary: | $8,700 | Salary: | $10,400 | Salary: | |||||
| Salary Rank: | 4 of 23 | Salary Rank: | 4 of 23 | Salary Rank: | of 23 | ||||
| Stats | Starts | SIERA | ERA | K% | BB% | GB% | HC% | SC% | |
|---|---|---|---|---|---|---|---|---|---|
| 2016 | 30 | 3.80 | 3.32 | 26.5% | 9.3% | 46.2% | 31.5% | 19.1% | |
| 2017 | 28 | 4.21 | 3.35 | 24.5% | 9.3% | 42.5% | 32.2% | 21.3% | |
| L30 | 6 | 4.60 | 3.31 | 23.3% | 11.0% | 41.3% | 32.3% | 19.4% | |
If you are playing the early slate on a multi-pitcher site, get ready for chalk city at the position. Drew Pomeranz and Luke Weaver are clearly the top plays, which should lead to concentrated ownership, especially given the lack of viable alternatives. Pomeranz has quietly pitched well all season, posting a 4.21 SIERA with a strikeout rate of 25%. We know the A’s have some firepower in their lineup, but they also have one of the highest strikeout rates of any team in baseball. Pomeranz is a large favorite and he should see plenty of run support.
Quick Breakdown: Pomeranz is an elite play in all formats, even though he’ll be popular.
Batter Grind Down
Oakland
The A’s are a boom or bust offense that is playing in a hitter-friendly ballpark. There is certainly a chance that they could hit a couple of home runs, but I’m not banking on it. They draw a difficult matchup against Drew Pomeranz, who has an above-average strikeout rate and who has held both left and right-handed hitters under a .310 xwOBA this season. Jed Lowrie and Khris Davis are intriguing tournament plays, but I will have more exposure to Pomeranz than I will to this offense.
Projected Lineup (Splits vs. LH Pitching)
| # | Player | Bats | wOBA | xwOBA | ISO | HC% | BB% | K% | GB% | FD Pos. | FD Sal. | DK Pos. | DK Sal. | FDRFT Pos. | FDRFT Sal. |
|---|---|---|---|---|---|---|---|---|---|---|---|---|---|---|---|
| 1 | Marcus Semien | RIGHT | 0.294 | 0.279 | 0.108 | 38.5% | 11.9% | 26.2% | 40.4% | SS | $3,900 | SS | $3,800 | N/A | N/A |
| 2 | Chad Pinder | RIGHT | 0.315 | 0.359 | 0.179 | 29.3% | 9.0% | 24.7% | 36.2% | OF | $2,700 | OF/SS | $3,300 | N/A | N/A |
| 3 | Jed Lowrie | SWITCH | 0.317 | 0.329 | 0.136 | 28.7% | 11.2% | 19.2% | 42.5% | 2B | $3,500 | 2B | $3,600 | N/A | N/A |
| 4 | Khris Davis | RIGHT | 0.301 | 0.364 | 0.192 | 49.3% | 15.7% | 31.5% | 41.8% | OF | $4,200 | OF | $4,000 | N/A | N/A |
| 5 | Ryon Healy | RIGHT | 0.388 | 0.335 | 0.241 | 31.1% | 4.1% | 21.5% | 38.9% | 1B | $2,900 | 1B/3B | $3,500 | N/A | N/A |
| 6 | Matt Olson | LEFT | 0.374 | 0.344 | 0.290 | 40.9% | 11.4% | 25.7% | 45.5% | 1B | $3,700 | 1B/OF | $4,400 | N/A | N/A |
| 7 | Matt Chapman | RIGHT | 0.332 | 0.349 | 0.194 | 37.5% | 10.0% | 32.9% | 22.5% | 3B | $3,100 | 3B | $2,500 | N/A | N/A |
| 8 | Mark Canha | RIGHT | 0.284 | 0.246 | 0.151 | 23.7% | 3.5% | 26.3% | 28.9% | OF | $2,100 | OF | $3,000 | N/A | N/A |
| 9 | Dustin Garneau | RIGHT | 0.285 | 0.279 | 0.200 | 26.3% | 6.6% | 29.5% | 27.0% | C | $2,200 | C | $3,200 | N/A | N/A |
Elite Plays – None
Secondary Plays – Jed Lowrie, Khris Davis
Stackability – ORANGE
Boston
The Red Sox were a disappointment last night. Who could have seen that coming? Well, if you were paying attention all year, then the answer is all of us. They have routinely let us down in good spots. They draw another favorable matchup today at home against Daniel Gossett, who has allowed a .329 xwOBA to left-handed hitters and a .371 xwOBA to right-handed hitters this season. The Red Sox have the highest implied run total on the board. Here we go again.
Projected Lineup (Splits vs. RH Pitching)
| # | Player | Bats | wOBA | xwOBA | ISO | HC% | BB% | K% | GB% | FD Pos. | FD Sal. | DK Pos. | DK Sal. | FDRFT Pos. | FDRFT Sal. |
|---|---|---|---|---|---|---|---|---|---|---|---|---|---|---|---|
| 1 | Xander Bogaerts | RIGHT | 0.316 | 0.265 | 0.140 | 29.7% | 7.8% | 19.9% | 47.0% | SS | $3,300 | SS | $4,200 | N/A | N/A |
| 2 | Dustin Pedroia | RIGHT | 0.338 | 0.317 | 0.102 | 25.7% | 9.4% | 10.2% | 48.3% | 2B | $3,500 | 2B | $4,200 | N/A | N/A |
| 3 | Andrew Benintendi | LEFT | 0.349 | 0.345 | 0.182 | 36.5% | 9.9% | 16.5% | 37.4% | OF | $4,000 | OF | $5,300 | N/A | N/A |
| 4 | Mookie Betts | RIGHT | 0.324 | 0.328 | 0.179 | 35.2% | 9.8% | 11.6% | 40.2% | OF | $4,600 | OF | $5,500 | N/A | N/A |
| 5 | Mitch Moreland | LEFT | 0.330 | 0.375 | 0.201 | 38.8% | 10.1% | 21.3% | 41.0% | 1B | $3,000 | 1B | $3,700 | N/A | N/A |
| 6 | Hanley Ramirez | RIGHT | 0.328 | 0.356 | 0.179 | 35.0% | 8.4% | 20.6% | 41.8% | 1B | $2,900 | 1B | $3,500 | N/A | N/A |
| 7 | Rafael Devers | LEFT | 0.328 | 0.296 | 0.212 | 33.7% | 8.1% | 22.0% | 51.2% | 3B | $3,300 | 3B | $3,800 | N/A | N/A |
| 8 | Christian Vazquez | RIGHT | 0.317 | 0.269 | 0.098 | 27.0% | 5.4% | 19.8% | 46.6% | C | $2,800 | C | $3,500 | N/A | N/A |
| 9 | Jackie Bradley Jr. | LEFT | 0.307 | 0.317 | 0.169 | 37.1% | 8.4% | 25.0% | 42.0% | OF | $3,100 | OF | $3,500 | N/A | N/A |
Elite Plays – Andrew Benintendi, Mookie Betts, Mitch Moreland
Secondary Plays – Xander Bogaerts, Dustin Pedroia, Hanley Ramirez
Stackability – YELLOW / GREEN
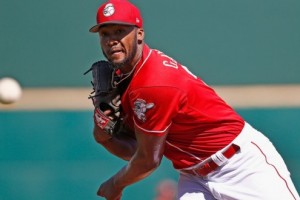
Cincinnati at St. Louis – 1:45 PM ET
| Cincinnati | St. Louis | ||||||||||||||
 | Amir Garrett |  | Luke Weaver | ||||||||||||
| LEFT | RIGHT | ||||||||||||||
| Vegas Moneyline | Vegas Over/Under | ||||||||||||||
| STL-200 | 9.0 | ||||||||||||||
| Stats | wOBA | xwOBA | HC% | BB% | K% | GB% | Stats | wOBA | xwOBA | HC% | BB% | K% | GB% | ||
|---|---|---|---|---|---|---|---|---|---|---|---|---|---|---|---|
| SP vs. Left (2016-17) | 0.388 | 0.330 | 35.3% | 5.8% | 28.9% | 50.0% | SP vs. Left (2016-17) | 0.221 | 0.225 | 18.2% | 4.4% | 30.4% | 51.2% | ||
| SP vs. Right (2016-17) | 0.389 | 0.372 | 43.3% | 12.0% | 16.7% | 40.6% | SP vs. Right (2016-17) | 0.321 | 0.284 | 30.5% | 8.2% | 31.6% | 56.9% | ||
Pitcher Grind Down
| Amir Garrett | |||||||||
 | FanDuel | DraftKings | FantasyDraft | ||||||
| Salary: | $6,700 | Salary: | $5,600 | Salary: | |||||
| Salary Rank: | 14 of 23 | Salary Rank: | 22 of 23 | Salary Rank: | of 23 | ||||
| Stats | Starts | SIERA | ERA | K% | BB% | GB% | HC% | SC% | |
|---|---|---|---|---|---|---|---|---|---|
| 2017 | 13 | 5.09 | 7.39 | 19.0% | 10.9% | 42.3% | 41.9% | 12.1% | |
| L30 | 1 | 4.40 | 7.20 | 23.8% | 9.5% | 42.9% | 35.7% | 14.3% | |
I read an article about Garrett the other day. It said that when he was struggling earlier in the season, he was dealing with an injury that didn’t allow him to fully turn in his delivery. This led to a drop in his velocity and ultimately to his bad performances. While I’m not fully buying into that, I did like the fact that he was throwing 95+ MPH in his last start. I also like that he struck out ten batters in his last Triple-A start before being called up to the majors again. He’s a pitcher to monitor moving forward and is actually my third favorite target in the three-game early slate.
Quick Breakdown: I’m going to eat the chalk with Pomeranz and Weaver, but Garrett is at least somewhat appealing in GPPs.
| Luke Weaver | |||||||||
 | FanDuel | DraftKings | FantasyDraft | ||||||
| Salary: | $9,200 | Salary: | $10,900 | Salary: | |||||
| Salary Rank: | 2 of 23 | Salary Rank: | 1 of 23 | Salary Rank: | of 23 | ||||
| Stats | Starts | SIERA | ERA | K% | BB% | GB% | HC% | SC% | |
|---|---|---|---|---|---|---|---|---|---|
| 2016 | 8 | 3.55 | 5.70 | 27.0% | 7.2% | 30.7% | 32.4% | 17.6% | |
| 2017 | 6 | 2.99 | 2.16 | 31.1% | 6.6% | 54.5% | 25.2% | 16.5% | |
| L30 | 4 | 2.57 | 1.32 | 34.6% | 5.6% | 56.5% | 25.4% | 17.5% | |
Weaver has been terrific in his six starts this season, posting a 2.99 SIERA with a strikeout rate of 31% and a walk rate of 7%. I love high ground ball pitchers that also have a high strikeout rate because they can rack up fantasy points and get out of trouble when needed. I keep playing Weaver in every start hoping that his run doesn’t come to an end. I may be looking at it the wrong way though. This might not be some hot streak; this might be who he is. Weaver is an elite play in all formats today against the Reds.
Quick Breakdown: I’m drinking the Weaver Kool-Aid. It’s delicious and it provides great health benefits (more money in your pockets).
Batter Grind Down
Cincinnati
The Reds are playing in a pitcher-friendly ballpark and they are facing a pitcher with a 31% strikeout rate and a 55% ground ball rate. I know we are still dealing with a small six game sample, but I want no part of hitters against Luke Weaver. On the season, he has held both left and right-handed hitters under a .285 xwOBA and under a 31% hard contact rate.
Projected Lineup (Splits vs. RH Pitching)
| # | Player | Bats | wOBA | xwOBA | ISO | HC% | BB% | K% | GB% | FD Pos. | FD Sal. | DK Pos. | DK Sal. | FDRFT Pos. | FDRFT Sal. |
|---|---|---|---|---|---|---|---|---|---|---|---|---|---|---|---|
| 1 | Jesse Winker | LEFT | 0.418 | 0.360 | 0.226 | 36.7% | 16.2% | 17.6% | 53.1% | OF | $2,300 | OF | $3,300 | N/A | N/A |
| 2 | Zack Cozart | RIGHT | 0.376 | 0.320 | 0.224 | 29.3% | 12.7% | 16.1% | 38.6% | SS | $3,500 | SS | $4,200 | N/A | N/A |
| 3 | Joey Votto | LEFT | 0.426 | 0.431 | 0.256 | 38.4% | 19.0% | 10.4% | 38.7% | 1B | $4,000 | 1B | $5,100 | N/A | N/A |
| 4 | Scooter Gennett | LEFT | 0.393 | 0.336 | 0.258 | 37.5% | 6.6% | 20.8% | 39.8% | 2B | $3,000 | 2B | $3,700 | N/A | N/A |
| 5 | Eugenio Suarez | RIGHT | 0.362 | 0.355 | 0.202 | 31.4% | 13.2% | 21.4% | 38.9% | 3B | $3,600 | 3B | $3,600 | N/A | N/A |
| 6 | Scott Schebler | LEFT | 0.335 | 0.358 | 0.258 | 40.1% | 10.5% | 24.2% | 43.7% | OF | $3,000 | OF | $3,600 | N/A | N/A |
| 7 | Adam Duvall | RIGHT | 0.315 | 0.284 | 0.231 | 33.0% | 5.0% | 27.3% | 31.3% | OF | $2,900 | OF | $3,700 | N/A | N/A |
| 8 | Tucker Barnhart | SWITCH | 0.324 | 0.336 | 0.129 | 34.8% | 10.3% | 16.2% | 43.7% | C | $3,300 | C | $3,000 | N/A | N/A |
| 9 | Amir Garrett | LEFT | 0.082 | 0.129 | 0.067 | 0.0% | 0.0% | 27.8% | 50.0% | P | $6,700 | P | $5,600 | N/A | N/A |
Elite Plays – None
Secondary Plays – Jesse Winker
Stackability – RED
St. Louis
I’m interested to see how Amir Garrett pitches down the stretch of the regular season (especially if he can maintain the velocity from his last start), but for now, I will continue to target right-handed hitters against him. On the season, he has allowed a .372 xwOBA, a 43% hard contact rate, and a 12% walk rate to batters from the right side of the plate. This should bode well for a right-handed heavy Cardinals’ offense that will likely get overlooked with the Red Sox, Tigers, and White Sox all in such favorable matchups..
Projected Lineup (Splits vs. LH Pitching)
| # | Player | Bats | wOBA | xwOBA | ISO | HC% | BB% | K% | GB% | FD Pos. | FD Sal. | DK Pos. | DK Sal. | FDRFT Pos. | FDRFT Sal. |
|---|---|---|---|---|---|---|---|---|---|---|---|---|---|---|---|
| 1 | Matt Carpenter | LEFT | 0.300 | 0.369 | 0.121 | 36.8% | 15.3% | 21.0% | 36.5% | 1B | $4,100 | 1B | $4,200 | N/A | N/A |
| 2 | Tommy Pham | RIGHT | 0.390 | 0.368 | 0.259 | 36.4% | 14.6% | 20.4% | 52.3% | OF | $3,600 | OF | $4,900 | N/A | N/A |
| 3 | Paul DeJong | RIGHT | 0.393 | 0.272 | 0.333 | 36.2% | 6.5% | 32.5% | 40.4% | SS | $3,400 | 2B/SS | $4,400 | N/A | N/A |
| 4 | Jose Martinez | RIGHT | 0.545 | 0.535 | 0.491 | 41.9% | 13.1% | 16.4% | 32.6% | OF | $2,800 | 1B/OF | $4,700 | N/A | N/A |
| 5 | Yadier Molina | RIGHT | 0.367 | 0.424 | 0.293 | 46.7% | 4.5% | 10.9% | 33.3% | C | $3,500 | C | $3,800 | N/A | N/A |
| 6 | Stephen Piscotty | RIGHT | 0.317 | 0.380 | 0.100 | 45.7% | 15.1% | 19.2% | 47.8% | OF | $2,300 | OF | $3,500 | N/A | N/A |
| 7 | Harrison Bader | RIGHT | 0.661 | 0.492 | 0.533 | 76.9% | 0.0% | 13.3% | 46.2% | OF | $2,200 | OF | $3,100 | N/A | N/A |
| 8 | Kolten Wong | LEFT | 0.327 | 0.317 | 0.076 | 30.2% | 11.7% | 19.5% | 57.1% | 2B | $3,500 | 2B | $3,500 | N/A | N/A |
| 9 | Luke Weaver | RIGHT | 0.219 | 0.000 | 50.0% | 0.0% | 50.0% | 100.0% | P | $9,200 | P | $10,900 | N/A | N/A |
Elite Plays – Tommy Pham, Jose Martinez, Yadier Molina
Secondary Plays – Matt Carpenter, Paul DeJong, Harrison Bader
Stackability – YELLOW / GREEN
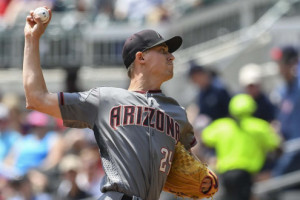
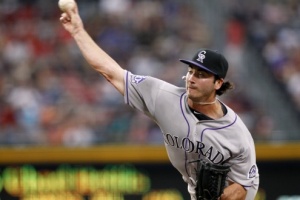
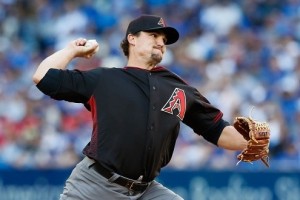
Colorado at Arizona – 3:40 PM ET
| Colorado | Arizona | ||||||||||||||
 | Chad Bettis |  | Zack Godley | ||||||||||||
| RIGHT | RIGHT | ||||||||||||||
| Vegas Moneyline | Vegas Over/Under | ||||||||||||||
| ARI-165 | 9.5 | ||||||||||||||
| Stats | wOBA | xwOBA | HC% | BB% | K% | GB% | Stats | wOBA | xwOBA | HC% | BB% | K% | GB% | ||
|---|---|---|---|---|---|---|---|---|---|---|---|---|---|---|---|
| SP vs. Left (2016-17) | 0.378 | 0.316 | 32.7% | 3.1% | 16.9% | 42.0% | SP vs. Left (2016-17) | 0.289 | 0.301 | 30.5% | 10.8% | 25.4% | 60.3% | ||
| SP vs. Right (2016-17) | 0.346 | 0.289 | 26.6% | 3.8% | 15.0% | 47.5% | SP vs. Right (2016-17) | 0.272 | 0.268 | 31.4% | 6.6% | 27.6% | 51.1% | ||
Pitcher Grind Down
| Chad Bettis | |||||||||
 | FanDuel | DraftKings | FantasyDraft | ||||||
| Salary: | $6,200 | Salary: | $6,300 | Salary: | |||||
| Salary Rank: | 20 of 23 | Salary Rank: | 15 of 23 | Salary Rank: | of 23 | ||||
| Stats | Starts | SIERA | ERA | K% | BB% | GB% | HC% | SC% | |
|---|---|---|---|---|---|---|---|---|---|
| 2016 | 32 | 4.39 | 4.79 | 17.0% | 7.3% | 51.2% | 30.5% | 17.2% | |
| 2017 | 6 | 4.54 | 4.98 | 15.9% | 3.5% | 45.0% | 29.3% | 18.1% | |
| L30 | 6 | 4.54 | 4.98 | 15.9% | 3.5% | 45.0% | 29.3% | 18.1% | |
Most of you can skip over this game unless you are playing in the all-day slate. Bettis has struggled a bit in his six starts this season, posting a 4.54 SIERA with a strikeout rate of only 16%. He typically doesn’t walk many batters and historically, he’s had a high ground ball rate. The issue is always the strikeouts. I suppose a road start against the Diamondbacks doesn’t help either.
Quick Breakdown: Bettis is an easy fade in all formats.
| Zack Godley | |||||||||
 | FanDuel | DraftKings | FantasyDraft | ||||||
| Salary: | $9,400 | Salary: | $10,500 | Salary: | |||||
| Salary Rank: | 1 of 23 | Salary Rank: | 3 of 23 | Salary Rank: | of 23 | ||||
| Stats | Starts | SIERA | ERA | K% | BB% | GB% | HC% | SC% | |
|---|---|---|---|---|---|---|---|---|---|
| 2016 | 9 | 4.16 | 6.39 | 17.9% | 7.5% | 53.8% | 32.1% | 17.9% | |
| 2017 | 22 | 3.68 | 3.18 | 26.6% | 8.6% | 55.4% | 31.0% | 20.1% | |
| L30 | 6 | 3.81 | 3.86 | 29.3% | 11.3% | 55.3% | 37.5% | 21.6% | |
Godley has been one of my favorite plays in DFS this season. He continues to be under-owned, under-priced, and under-valued. I will keep playing him though, as he owns an above-average strikeout rate (27%) and an elite ground ball rate (55%). He also has a good track record against the Rockies, holding their current roster to a .267 wOBA with 14 strikeouts in 67 plate appearances.
Quick Breakdown: Godley is an excellent tournament play in the all-day slate and I would even consider him cash game viable.
Batter Grind Down
Colorado
The Rockies are playing in a hitter-friendly ballpark, but they draw a difficult matchup against Zack Godley. As mentioned above, he has an above-average strikeout rate and an elite ground ball rate. On the season, he has held both left and right-handed hitters under a .305 xwOBA and under a 32% hard contact rate. We can certainly find better offenses to target in the all-day slate.
Projected Lineup (Splits vs. RH Pitching)
| # | Player | Bats | wOBA | xwOBA | ISO | HC% | BB% | K% | GB% | FD Pos. | FD Sal. | DK Pos. | DK Sal. | FDRFT Pos. | FDRFT Sal. |
|---|---|---|---|---|---|---|---|---|---|---|---|---|---|---|---|
| 1 | Charlie Blackmon | LEFT | 0.429 | 0.370 | 0.301 | 40.8% | 9.4% | 20.6% | 34.8% | OF | $4,300 | OF | $5,000 | N/A | N/A |
| 2 | DJ LeMahieu | RIGHT | 0.323 | 0.318 | 0.073 | 26.8% | 8.3% | 14.0% | 57.6% | 2B | $3,600 | 2B | $4,100 | N/A | N/A |
| 3 | Carlos Gonzalez | LEFT | 0.338 | 0.316 | 0.157 | 29.2% | 12.4% | 19.1% | 45.0% | OF | $3,800 | OF | $4,600 | N/A | N/A |
| 4 | Nolan Arenado | RIGHT | 0.349 | 0.327 | 0.221 | 35.8% | 8.6% | 17.9% | 37.1% | 3B | $4,400 | 3B | $4,900 | N/A | N/A |
| 5 | Gerardo Parra | LEFT | 0.348 | 0.317 | 0.175 | 38.0% | 5.1% | 15.3% | 48.1% | OF | $3,000 | OF | $4,200 | N/A | N/A |
| 6 | Trevor Story | RIGHT | 0.264 | 0.249 | 0.140 | 34.9% | 8.2% | 37.0% | 36.5% | SS | $3,000 | SS | $4,200 | N/A | N/A |
| 7 | Mark Reynolds | RIGHT | 0.376 | 0.332 | 0.248 | 35.4% | 10.3% | 28.7% | 41.5% | 1B | $2,900 | 1B | $4,000 | N/A | N/A |
| 8 | Tony Wolters | LEFT | 0.283 | 0.291 | 0.053 | 19.6% | 14.1% | 18.7% | 52.3% | C | $2,100 | C | $2,100 | N/A | N/A |
| 9 | Chad Bettis | RIGHT | 0.224 | 0.138 | 0.000 | 0.0% | 12.5% | 50.0% | 50.0% | P | $6,200 | P | $6,300 | N/A | N/A |
Elite Plays – None
Secondary Plays – None
Stackability – RED
Arizona
The Diamondbacks aren’t my favorite offense on the board, but there are some intriguing hitters in this lineup. We know that they fare much better at home than they do on the road and they draw a decent matchup against Chad Bettis, who is a low strikeout pitcher that has allowed a 33% hard contact rate to left-handed hitters. My plan is to load up on some of the other offenses, but you can make a case for the Diamondbacks in tournaments.
Projected Lineup (Splits vs. RH Pitching)
| # | Player | Bats | wOBA | xwOBA | ISO | HC% | BB% | K% | GB% | FD Pos. | FD Sal. | DK Pos. | DK Sal. | FDRFT Pos. | FDRFT Sal. |
|---|---|---|---|---|---|---|---|---|---|---|---|---|---|---|---|
| 1 | David Peralta | LEFT | 0.353 | 0.312 | 0.161 | 34.6% | 7.0% | 16.1% | 52.9% | OF | $3,300 | OF | $4,200 | N/A | N/A |
| 2 | Chris Iannetta | RIGHT | 0.338 | 0.312 | 0.265 | 41.2% | 10.9% | 33.9% | 33.3% | C | $2,600 | C | $3,600 | N/A | N/A |
| 3 | Jake Lamb | LEFT | 0.387 | 0.374 | 0.267 | 36.3% | 13.9% | 21.2% | 37.1% | 3B | $2,800 | 3B | $4,700 | N/A | N/A |
| 4 | Paul Goldschmidt | RIGHT | 0.420 | 0.398 | 0.289 | 44.4% | 14.0% | 23.1% | 46.9% | 1B | $4,200 | 1B | $5,500 | N/A | N/A |
| 5 | J.D. Martinez | RIGHT | 0.381 | 0.394 | 0.334 | 45.8% | 10.4% | 27.5% | 41.4% | OF | $4,700 | OF | $5,700 | N/A | N/A |
| 6 | A.J. Pollock | RIGHT | 0.315 | 0.314 | 0.156 | 36.8% | 8.1% | 18.9% | 44.6% | OF | $3,400 | OF | $4,400 | N/A | N/A |
| 7 | Daniel Descalso | LEFT | 0.345 | 0.328 | 0.181 | 40.5% | 11.9% | 22.7% | 37.0% | 2B | $2,800 | 2B/OF | $3,600 | N/A | N/A |
| 8 | Ketel Marte | SWITCH | 0.352 | 0.326 | 0.154 | 22.7% | 9.8% | 16.5% | 38.9% | SS | $2,700 | SS | $3,700 | N/A | N/A |
| 9 | Zack Godley | RIGHT | 0.054 | 0.073 | 0.000 | 12.5% | 2.8% | 52.8% | 55.6% | P | $9,400 | P | $10,500 | N/A | N/A |
Elite Plays – None
Secondary Plays – David Peralta, Paul Goldschmidt, Jake Lamb, J.D. Martinez
Stackability – YELLOW
Atlanta at Washington – 7:05 PM ET
| Atlanta | Washington | ||||||||||||||
 | Mike Foltynewicz |  | Tanner Roark | ||||||||||||
| RIGHT | RIGHT | ||||||||||||||
| Vegas Moneyline | Vegas Over/Under | ||||||||||||||
| WAS-175 | 8.5 | ||||||||||||||
| Stats | wOBA | xwOBA | HC% | BB% | K% | GB% | Stats | wOBA | xwOBA | HC% | BB% | K% | GB% | ||
|---|---|---|---|---|---|---|---|---|---|---|---|---|---|---|---|
| SP vs. Left (2016-17) | 0.375 | 0.348 | 33.2% | 10.1% | 19.2% | 32.0% | SP vs. Left (2016-17) | 0.356 | 0.343 | 29.8% | 10.3% | 19.1% | 40.8% | ||
| SP vs. Right (2016-17) | 0.309 | 0.305 | 23.1% | 7.2% | 22.3% | 46.5% | SP vs. Right (2016-17) | 0.264 | 0.281 | 24.1% | 6.1% | 23.3% | 54.9% | ||
Pitcher Grind Down
| Mike Foltynewicz | |||||||||
 | FanDuel | DraftKings | FantasyDraft | ||||||
| Salary: | $7,200 | Salary: | $6,800 | Salary: | $13,600 | ||||
| Salary Rank: | 12 of 23 | Salary Rank: | 12 of 23 | Salary Rank: | 8 of 23 | ||||
| Stats | Starts | SIERA | ERA | K% | BB% | GB% | HC% | SC% | |
|---|---|---|---|---|---|---|---|---|---|
| 2016 | 22 | 4.13 | 4.31 | 21.1% | 6.7% | 41.2% | 29.8% | 20.4% | |
| 2017 | 27 | 4.58 | 4.74 | 20.8% | 8.6% | 39.2% | 28.1% | 15.9% | |
| L30 | 5 | 4.78 | 6.84 | 19.5% | 9.8% | 42.2% | 24.4% | 22.1% | |
Foltynewicz has cooled off over the last few months. His numbers as a whole don’t look that appealing. In 27 starts, he has a 4.58 SIERA with an average strikeout rate and a walk rate of 9%. He is typically good at limiting hard contact, but that’s not so easy in a road start against the Nationals. Even without Bryce Harper, their offense hasn’t skipped a beat. On the season, they are ranked fifth in team wOBA and tenth in strikeout rate against right-handed pitching.
Quick Breakdown: As a sizable underdog on the road against a talented offense, Foltynewicz is an easy fade in all formats.
| Tanner Roark | |||||||||
 | FanDuel | DraftKings | FantasyDraft | ||||||
| Salary: | $8,600 | Salary: | $10,200 | Salary: | $19,600 | ||||
| Salary Rank: | 5 of 23 | Salary Rank: | 5 of 23 | Salary Rank: | 2 of 23 | ||||
| Stats | Starts | SIERA | ERA | K% | BB% | GB% | HC% | SC% | |
|---|---|---|---|---|---|---|---|---|---|
| 2016 | 33 | 4.32 | 2.83 | 20.1% | 8.5% | 48.7% | 24.3% | 23.1% | |
| 2017 | 27 | 4.36 | 4.48 | 21.2% | 8.2% | 47.8% | 27.0% | 16.3% | |
| L30 | 5 | 3.22 | 3.41 | 27.8% | 4.0% | 50.0% | 22.4% | 20.0% | |
I haven’t used Roark very often this season, but tonight might be the right time to finally take the plunge. As far as pitching options go, they are few and far between in this slate. There really isn’t a clear number one. Given Roark’s recent form, he deserves to be in the conversation. In his last five starts, he has a 3.22 SIERA with a strikeout rate of 28% and a walk rate of 4%. The Braves may not have a high strikeout rate, but they have struggled against right-handed pitching all season. If Roark can pitch around Freddie Freeman, I like his chances to pitch seven innings and pick up a win, which can’t be said about many pitchers taking the mound tonight.
Quick Breakdown: Roark is a viable play in all formats, although we will get to my favorite pitcher here shortly.
Batter Grind Down
Atlanta
The Braves draw a fairly difficult matchup against Tanner Roark and they are facing him in a pitcher-friendly ballpark. While Roark has struggled with left-handed hitters this season (.343 xwOBA allowed), he has held batters from both sides of the plate under a 30% hard contact rate. Outside of Freddie Freeman (.434 xwOBA against right-handed pitching), the Braves don’t offer much in this matchup.
Projected Lineup (Splits vs. RH Pitching)
| # | Player | Bats | wOBA | xwOBA | ISO | HC% | BB% | K% | GB% | FD Pos. | FD Sal. | DK Pos. | DK Sal. | FDRFT Pos. | FDRFT Sal. |
|---|---|---|---|---|---|---|---|---|---|---|---|---|---|---|---|
| 1 | Ender Inciarte | LEFT | 0.333 | 0.288 | 0.112 | 24.1% | 6.6% | 14.4% | 42.4% | OF | $3,700 | OF | $3,700 | CF | $7,200 |
| 2 | Ozzie Albies | SWITCH | 0.305 | 0.285 | 0.119 | 33.0% | 7.4% | 19.0% | 43.0% | 2B | $3,700 | 2B | $3,400 | 2B | $6,600 |
| 3 | Freddie Freeman | LEFT | 0.443 | 0.434 | 0.309 | 37.6% | 14.6% | 15.0% | 34.4% | 1B | $4,200 | 1B/3B | $4,900 | 1B | $9,600 |
| 4 | Matt Kemp | RIGHT | 0.344 | 0.345 | 0.210 | 35.6% | 4.1% | 23.0% | 48.0% | OF | $2,600 | OF | $3,400 | LF | $6,600 |
| 5 | Nick Markakis | LEFT | 0.328 | 0.342 | 0.113 | 35.4% | 11.7% | 17.0% | 45.9% | OF | $3,200 | OF | $3,300 | RF | $6,400 |
| 6 | Tyler Flowers | RIGHT | 0.361 | 0.343 | 0.176 | 39.9% | 6.6% | 22.6% | 39.3% | C | $2,900 | C | $3,100 | C | $6,000 |
| 7 | Rio Ruiz | LEFT | 0.242 | 0.314 | 0.088 | 28.4% | 8.8% | 25.4% | 64.9% | 3B | $2,200 | 3B | $2,800 | 3B | $5,400 |
| 8 | Dansby Swanson | RIGHT | 0.273 | 0.292 | 0.092 | 28.1% | 11.2% | 22.1% | 50.4% | SS | $3,300 | SS | $3,300 | SS | $6,600 |
| 9 | Mike Foltynewicz | RIGHT | 0.050 | 0.109 | 0.000 | 10.0% | 0.0% | 50.0% | 46.2% | P | $7,200 | P | $6,800 | P | $13,600 |
Elite Plays – None
Secondary Plays – Freddie Freeman
Stackability – RED
Washington
The Nationals draw a favorable matchup tonight against Mike Foltynewicz, who has not been in the best of form recently. While I like their offense as a whole, they don’t really have the right personnel to attack Foltynewicz, who has allowed a .348 xwOBA and a 33% hard contact rate to left-handed hitters this season. Right-handed batters haven’t had nearly as much success against him (.305 xwOBA and a 23% hard contact rate) and the Nationals will likely have five or six righties in their lineup tonight. The only righty that I will be targeting here is Trea Turner, who has the rare speed/power combo at shortstop.
Projected Lineup (Splits vs. RH Pitching)
| # | Player | Bats | wOBA | xwOBA | ISO | HC% | BB% | K% | GB% | FD Pos. | FD Sal. | DK Pos. | DK Sal. | FDRFT Pos. | FDRFT Sal. |
|---|---|---|---|---|---|---|---|---|---|---|---|---|---|---|---|
| 1 | Trea Turner | RIGHT | 0.359 | 0.324 | 0.197 | 26.5% | 6.5% | 17.5% | 50.9% | SS | $4,200 | SS | $5,500 | IF/OF | $10,800 |
| 2 | Howie Kendrick | RIGHT | 0.366 | 0.308 | 0.147 | 28.2% | 5.5% | 21.9% | 63.6% | OF | $3,500 | 2B/OF | $4,400 | IF/OF | $8,700 |
| 3 | Daniel Murphy | LEFT | 0.385 | 0.368 | 0.229 | 35.1% | 9.1% | 11.2% | 33.2% | 2B | $3,800 | 2B | $4,600 | 2B | $8,800 |
| 4 | Ryan Zimmerman | RIGHT | 0.370 | 0.364 | 0.235 | 38.2% | 7.6% | 23.0% | 47.4% | 1B | $3,200 | 1B | $4,000 | 1B | $7,800 |
| 5 | Anthony Rendon | RIGHT | 0.379 | 0.357 | 0.214 | 33.8% | 12.8% | 14.6% | 35.0% | 3B | $3,500 | 3B | $4,800 | 3B | $9,300 |
| 6 | Matt Wieters | SWITCH | 0.268 | 0.295 | 0.113 | 29.8% | 7.2% | 19.0% | 41.6% | C | $2,600 | C | $2,600 | C | $5,100 |
| 7 | Jayson Werth | RIGHT | 0.325 | 0.323 | 0.185 | 28.8% | 10.5% | 23.2% | 42.4% | OF | $2,600 | OF | $3,100 | LF | $6,000 |
| 8 | Michael Taylor | RIGHT | 0.334 | 0.291 | 0.224 | 34.3% | 7.0% | 31.8% | 42.6% | OF | $3,500 | OF | $4,300 | CF | $8,400 |
| 9 | Tanner Roark | RIGHT | 0.111 | 0.131 | 0.025 | 12.5% | 2.1% | 31.3% | 75.0% | P | $8,600 | P | $10,200 | P | $19,600 |