MLB Grind Down: Tuesday, June 20th

Jump to Page 1 2 3
The RotoGrinders MLB Grind Down will give you an in-depth analysis into the upcoming MLB schedule. This article will break down the numbers for every single game and give you analysis on which trends you can exploit. While matchups are a major factor in daily fantasy baseball, there are plenty of other factors to consider such as injuries, weather, and salaries.
The analysis should point you in the right direction, but it is still up to you to decipher the information and make your own selections. No sport has more variance than baseball. The best choice is not always the right choice but following the trends will win you money over time.
Note: As always, if you want to try a new DFS site, be sure to click through a RotoGrinders link and use our DraftKings promo code, FanDuel promo code, and FantasyDraft promo code to receive the best perks in the industry.
Stackability Rating System:
GREEN – A viable full stack in cash games and GPPs.
YELLOW – A viable mini-stack in cash games and full stack in GPPs.
ORANGE – A viable stack in large field GPPs.
RED – Not a recommended stack for cash games or GPPs.
Cleveland at Baltimore – 7:05 PM ET
| Cleveland | Baltimore | ||||||||||||||
 | Josh Tomlin |  | Chris Tillman | ||||||||||||
| RIGHT | RIGHT | ||||||||||||||
| Vegas Moneyline | Vegas Over/Under | ||||||||||||||
| CLE-130 | 11.0 | ||||||||||||||
| Stats | wOBA | xwOBA | HC% | BB% | K% | GB% | Stats | wOBA | xwOBA | HC% | BB% | K% | GB% | ||
|---|---|---|---|---|---|---|---|---|---|---|---|---|---|---|---|
| SP vs. Left (2016-17) | 0.302 | 0.321 | 37.6% | 2.2% | 15.5% | 46.8% | SP vs. Left (2016-17) | 0.342 | 0.338 | 30.0% | 12.0% | 20.1% | 43.5% | ||
| SP vs. Right (2016-17) | 0.360 | 0.347 | 32.3% | 2.8% | 17.2% | 39.8% | SP vs. Right (2016-17) | 0.334 | 0.345 | 33.3% | 7.4% | 17.3% | 40.2% | ||
Pitcher Grind Down
| Josh Tomlin | |||||||||
 | FanDuel | DraftKings | FantasyDraft | ||||||
| Salary: | $7,500 | Salary: | $6,300 | Salary: | $12,400 | ||||
| Salary Rank: | 15 of 30 | Salary Rank: | 15 of 30 | Salary Rank: | 15 of 30 | ||||
| Stats | Starts | SIERA | ERA | K% | BB% | GB% | HC% | SC% | |
|---|---|---|---|---|---|---|---|---|---|
| 2016 | 29 | 4.24 | 4.40 | 16.3% | 2.8% | 43.8% | 33.9% | 16.4% | |
| 2017 | 13 | 4.25 | 5.83 | 16.8% | 2.0% | 40.8% | 36.5% | 13.1% | |
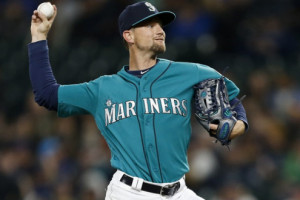
After Corey Kluber pitched a complete game shutout with 11 strikeouts against the Orioles last night, Baltimore will look to bounce back in a much better matchup against Tomlin. In 13 starts this season, Tomlin owns a 4.25 SIERA with a strikeout rate below 17%. He doesn’t walk many batters, but he’s a fly-ball pitcher that allows a lot of hard contact to right-handed hitters. That does not bode well for a matchup against the likes of Adam Jones, Manny Machado, and Mark Trumbo.
Quick Breakdown: In full slates, there are a lot of easy fades at the pitcher position. Tomlin is one of them.
| Chris Tillman | |||||||||
 | FanDuel | DraftKings | FantasyDraft | ||||||
| Salary: | $6,900 | Salary: | $5,100 | Salary: | $10,000 | ||||
| Salary Rank: | 23 of 30 | Salary Rank: | 26 of 30 | Salary Rank: | 26 of 30 | ||||
| Stats | Starts | SIERA | ERA | K% | BB% | GB% | HC% | SC% | |
|---|---|---|---|---|---|---|---|---|---|
| 2016 | 30 | 4.61 | 3.77 | 19.6% | 9.2% | 41.2% | 31.5% | 18.3% | |
| 2017 | 8 | 5.49 | 8.07 | 14.4% | 10.5% | 43.3% | 33.3% | 22.2% | |
Tillman is having his worst season as a professional. In eight starts, he owns a 5.49 SIERA with a strikeout rate under 15% and a walk rate of 10.5%. He is giving up more hard contact this season and the lack of strikeouts has led to a lot of trouble for the veteran right-hander. With these two pitchers on the mound tonight, Vegas has the over/under set at 11.0 runs, which is incredibly high for a game being played in Baltimore.
Quick Breakdown: Tillman should be avoided in both cash games and tournaments.
Batter Grind Down
Cleveland
The Indians see a favorable ballpark shift playing in Camden Yards and also draw an exploitable matchup against Chris Tillman. As I mentioned earlier, Tillman’s strikeouts are down and his walks are up this season, which is great news if you are considering an Indians’ stack. In the last two seasons combined, Tillman has allowed a .338 xwOBA to lefties and a .345 xwOBA to righties. The Indians have one of the most talented offenses in baseball and there are a lot of reasons to like them tonight in Baltimore.
Projected Lineup (Splits vs. RH Pitching)
| # | Player | Bats | wOBA | xwOBA | ISO | HC% | BB% | K% | GB% | FD Pos. | FD Sal. | DK Pos. | DK Sal. | FDRFT Pos. | FDRFT Sal. |
|---|---|---|---|---|---|---|---|---|---|---|---|---|---|---|---|
| 1 | Francisco Lindor | SWITCH | 0.344 | 0.343 | 0.166 | 27.0% | 9.0% | 12.7% | 45.8% | SS | $3,300 | SS | $4,400 | SS | $8,400 |
| 2 | Jason Kipnis | LEFT | 0.343 | 0.345 | 0.196 | 38.2% | 9.2% | 19.5% | 37.4% | 2B | $3,300 | 2B | $3,900 | 2B | $7,800 |
| 3 | Jose Ramirez | SWITCH | 0.363 | 0.340 | 0.174 | 28.0% | 7.5% | 9.7% | 38.0% | 3B | $4,300 | 2B/3B | $4,900 | IF/OF | $9,600 |
| 4 | Edwin Encarnacion | RIGHT | 0.363 | 0.381 | 0.252 | 37.6% | 10.9% | 20.6% | 38.2% | 1B | $4,000 | 1B | $4,700 | 1B | $9,300 |
| 5 | Carlos Santana | SWITCH | 0.374 | 0.398 | 0.264 | 37.5% | 15.1% | 16.9% | 35.8% | 1B | $3,400 | 1B | $4,100 | 1B | $8,000 |
| 6 | Lonnie Chisenhall | LEFT | 0.346 | 0.314 | 0.199 | 29.2% | 5.3% | 16.5% | 34.3% | OF | $2,700 | OF | $4,000 | RF | $7,800 |
| 7 | Yan Gomes | RIGHT | 0.223 | 0.267 | 0.139 | 30.0% | 5.1% | 26.3% | 39.1% | C | $2,500 | C | $3,300 | C | $6,600 |
| 8 | Bradley Zimmer | LEFT | 0.396 | 0.396 | 0.296 | 41.7% | 12.9% | 29.0% | 42.9% | OF | $3,000 | OF | $4,400 | CF | $8,400 |
| 9 | Austin Jackson | RIGHT | 0.320 | 0.331 | 0.118 | 32.1% | 9.2% | 19.5% | 36.2% | OF | $2,600 | OF | $3,500 | CF | $6,900 |
Elite Plays – Francisco Lindor, Jason Kipnis, Edwin Encarnacion
Secondary Plays – Jose Ramirez, Carlos Santana, Lonnie Chisenhall
Stackability – GREEN
Baltimore
The Orioles were blanked by Corey Kluber last night, but I’m expecting a much different result in their matchup against Josh Tomlin. He is a great example of why we need to look at splits by handedness because he isn’t your typical right-handed pitcher. He has some serious reverse-splits, holding lefties to a .321 xwOBA while allowing a .347 xwOBA to righties. Seth Smith is still a fine play here, but most of my exposure to this offense will come in the form of a right-handed stack.
Projected Lineup (Splits vs. RH Pitching)
| # | Player | Bats | wOBA | xwOBA | ISO | HC% | BB% | K% | GB% | FD Pos. | FD Sal. | DK Pos. | DK Sal. | FDRFT Pos. | FDRFT Sal. |
|---|---|---|---|---|---|---|---|---|---|---|---|---|---|---|---|
| 1 | Seth Smith | LEFT | 0.337 | 0.368 | 0.173 | 33.2% | 11.0% | 21.2% | 45.9% | OF | $3,200 | OF | $3,700 | LF | $7,200 |
| 2 | Adam Jones | RIGHT | 0.337 | 0.339 | 0.195 | 32.2% | 5.3% | 16.2% | 43.5% | OF | $3,300 | OF | $4,300 | CF | $8,400 |
| 3 | Manny Machado | RIGHT | 0.340 | 0.354 | 0.237 | 35.4% | 6.7% | 19.4% | 37.7% | 3B | $3,700 | 3B | $3,900 | 3B | $7,600 |
| 4 | Mark Trumbo | RIGHT | 0.371 | 0.377 | 0.259 | 36.9% | 8.6% | 23.4% | 39.5% | OF | $3,900 | OF | $4,000 | IF/OF | $7,600 |
| 5 | Trey Mancini | RIGHT | 0.411 | 0.376 | 0.272 | 36.5% | 7.8% | 26.7% | 48.6% | OF | $3,500 | 1B/OF | $4,000 | 1B | $7,800 |
| 6 | Jonathan Schoop | RIGHT | 0.340 | 0.312 | 0.203 | 29.2% | 3.4% | 19.9% | 42.3% | 2B | $3,800 | 2B | $3,900 | 2B | $7,800 |
| 7 | Welington Castillo | RIGHT | 0.307 | 0.297 | 0.142 | 33.2% | 6.2% | 26.6% | 41.2% | C | $3,400 | C | $3,900 | C | $7,800 |
| 8 | Hyun-Soo Kim | LEFT | 0.353 | 0.347 | 0.115 | 28.8% | 9.2% | 14.4% | 51.0% | OF | $2,200 | OF | $3,300 | IF/OF | $6,600 |
| 9 | Ruben Tejada | RIGHT | 0.152 | 0.241 | 0.042 | 15.8% | 5.7% | 20.8% | 41.7% | SS | $2,000 | 3B/SS | $3,600 | SS | $7,200 |
Elite Plays – Adam Jones, Manny Machado, Mark Trumbo
Secondary Plays – Seth Smith, Trey Mancini, Jonathan Schoop
Stackability – YELLOW / GREEN
St. Louis at Philadelphia – 7:05 PM ET
| St. Louis | Philadelphia | ||||||||||||||
 | Mike Leake |  | Jeremy Hellickson | ||||||||||||
| RIGHT | RIGHT | ||||||||||||||
| Vegas Moneyline | Vegas Over/Under | ||||||||||||||
| STL-138 | 9.5 | ||||||||||||||
| Stats | wOBA | xwOBA | HC% | BB% | K% | GB% | Stats | wOBA | xwOBA | HC% | BB% | K% | GB% | ||
|---|---|---|---|---|---|---|---|---|---|---|---|---|---|---|---|
| SP vs. Left (2016-17) | 0.319 | 0.328 | 28.8% | 5.5% | 15.0% | 56.8% | SP vs. Left (2016-17) | 0.322 | 0.353 | 27.9% | 8.8% | 14.6% | 32.5% | ||
| SP vs. Right (2016-17) | 0.304 | 0.310 | 30.5% | 3.0% | 18.5% | 51.6% | SP vs. Right (2016-17) | 0.310 | 0.317 | 26.6% | 3.8% | 19.2% | 44.3% | ||
Pitcher Grind Down
| Mike Leake | |||||||||
 | FanDuel | DraftKings | FantasyDraft | ||||||
| Salary: | $8,000 | Salary: | $7,700 | Salary: | $15,200 | ||||
| Salary Rank: | 9 of 30 | Salary Rank: | 7 of 30 | Salary Rank: | 7 of 30 | ||||
| Stats | Starts | SIERA | ERA | K% | BB% | GB% | HC% | SC% | |
|---|---|---|---|---|---|---|---|---|---|
| 2016 | 30 | 3.92 | 4.69 | 16.5% | 4.0% | 53.7% | 30.6% | 17.3% | |
| 2017 | 13 | 3.98 | 3.14 | 17.5% | 4.6% | 54.9% | 27.6% | 17.9% | |
Leake has a low ERA (3.14) this season, even though he has allowed 17 earned runs in his last four outings. He isn’t a high strikeout pitcher, so for him to be successful, he needs to induce a lot of ground balls and a lot of soft contact. From a DFS perspective, that’s not exactly the type of pitcher that we want to rely on. Leake’s high ground ball rate is needed in this home run-friendly ballpark, but the over/under for the game is set a whopping 9.5 runs. In a full slate, we should be able to find better pitching options.
Quick Breakdown: Leake is pitching in a bad ballpark and has limited strikeout upside.
| Jeremy Hellickson | |||||||||
 | FanDuel | DraftKings | FantasyDraft | ||||||
| Salary: | $6,600 | Salary: | $5,200 | Salary: | $10,400 | ||||
| Salary Rank: | 24 of 30 | Salary Rank: | 25 of 30 | Salary Rank: | 25 of 30 | ||||
| Stats | Starts | SIERA | ERA | K% | BB% | GB% | HC% | SC% | |
|---|---|---|---|---|---|---|---|---|---|
| 2016 | 32 | 4.15 | 3.71 | 20.0% | 5.8% | 40.7% | 25.9% | 20.8% | |
| 2017 | 14 | 5.87 | 4.91 | 10.2% | 6.9% | 34.7% | 29.9% | 19.9% | |
Hellickson is lucky to have an ERA just under 5.00 this season. He is striking out 10% of batters, while only inducing a ground ball rate of 35%. Basically, he is giving up a ton of fly balls and his home ballpark is one of the best in baseball for home runs. That’s not a great combination. The Cardinals may not hit a lot of home runs as a team, but they also strikeout at a low rate against right-handed pitching.
Quick Breakdown: Hellickson is one of my least favorite pitching options on the board tonight.
Batter Grind Down
St. Louis
The Cardinals see a sizable ballpark shift in their favor tonight playing in Citizens Bank Park. They also draw a terrific matchup against Jeremy Hellickson, who has a strikeout rate compared to most of the pitchers you will find in your local softball league. Speaking of softballs, that’s what the baseball is going to look like for these Cardinals’ hitters. In the last two seasons, Hellickson has allowed a .353 xwOBA to lefties with a very low 32% ground ball rate. I will take ALL of the Matt Carpenter and Dexter Fowler shares that I can get my hands on tonight.
Projected Lineup (Splits vs. RH Pitching)
| # | Player | Bats | wOBA | xwOBA | ISO | HC% | BB% | K% | GB% | FD Pos. | FD Sal. | DK Pos. | DK Sal. | FDRFT Pos. | FDRFT Sal. |
|---|---|---|---|---|---|---|---|---|---|---|---|---|---|---|---|
| 1 | Matt Carpenter | LEFT | 0.388 | 0.418 | 0.263 | 46.4% | 15.2% | 19.3% | 27.2% | 1B | $4,000 | 1B | $4,500 | 1B | $8,800 |
| 2 | Dexter Fowler | SWITCH | 0.366 | 0.351 | 0.202 | 31.9% | 13.8% | 23.9% | 36.3% | OF | $3,400 | OF | $4,700 | CF | $9,200 |
| 3 | Stephen Piscotty | RIGHT | 0.329 | 0.349 | 0.157 | 32.6% | 8.1% | 20.9% | 45.7% | OF | $3,500 | OF | $4,000 | RF | $7,800 |
| 4 | Jedd Gyorko | RIGHT | 0.354 | 0.338 | 0.257 | 34.7% | 7.8% | 24.3% | 42.8% | 3B | $2,800 | 3B | $4,000 | 3B | $7,600 |
| 5 | Yadier Molina | RIGHT | 0.326 | 0.331 | 0.119 | 31.7% | 6.0% | 11.7% | 48.0% | C | $2,700 | C | $3,500 | C | $6,800 |
| 6 | Aledmys Diaz | RIGHT | 0.356 | 0.310 | 0.209 | 29.6% | 6.5% | 12.8% | 44.8% | SS | $3,000 | SS | $3,700 | SS | $7,200 |
| 7 | Tommy Pham | RIGHT | 0.347 | 0.347 | 0.195 | 42.3% | 10.5% | 30.9% | 54.1% | OF | $2,800 | OF | $4,300 | CF | $8,400 |
| 8 | Paul DeJong | RIGHT | 0.299 | 0.294 | 0.190 | 28.6% | 0.0% | 33.3% | 39.3% | 2B | $2,300 | 2B | $3,700 | 3B | $7,200 |
| 9 | Mike Leake | RIGHT | 0.140 | 0.225 | 0.038 | 15.0% | 1.8% | 28.1% | 38.9% | P | $8,000 | P | $7,700 | P | $15,200 |
Elite Plays – Matt Carpenter, Dexter Fowler
Secondary Plays – Stephen Piscotty, Jedd Gyorko, Yadier Molina, Aledmys Diaz
Stackability – YELLOW / GREEN
Philadelphia
Even though Mike Leake has struggled a bit in his last four starts, he’s not a pitcher that I like to target hitters against. His ground ball rate to both left and right-handed hitters is above 51% and he is very good at limiting hard contact. This is a great ballpark for home run production, but it’s hard to hit home runs when you aren’t getting the ball off the ground. In a full 15 game slate, most of the Phillies’ hitters are deep tournament fliers at best. The one value play that stands out here is Odubel Herrera, who has four multi-hit games in his last eight.
Projected Lineup (Splits vs. RH Pitching)
| # | Player | Bats | wOBA | xwOBA | ISO | HC% | BB% | K% | GB% | FD Pos. | FD Sal. | DK Pos. | DK Sal. | FDRFT Pos. | FDRFT Sal. |
|---|---|---|---|---|---|---|---|---|---|---|---|---|---|---|---|
| 1 | Odubel Herrera | LEFT | 0.336 | 0.311 | 0.154 | 29.6% | 8.1% | 20.3% | 42.7% | OF | $2,700 | OF | $3,100 | IF/OF | $6,000 |
| 2 | Howie Kendrick | RIGHT | 0.318 | 0.331 | 0.136 | 34.4% | 7.1% | 18.7% | 59.6% | OF | $2,800 | OF | $3,600 | IF/OF | $7,200 |
| 3 | Aaron Altherr | RIGHT | 0.305 | 0.294 | 0.142 | 33.2% | 8.7% | 31.1% | 46.8% | OF | $3,200 | OF | $4,100 | LF | $8,000 |
| 4 | Tommy Joseph | RIGHT | 0.327 | 0.326 | 0.200 | 38.0% | 5.5% | 22.9% | 42.0% | 1B | $3,300 | 1B | $3,200 | 1B | $6,400 |
| 5 | Maikel Franco | RIGHT | 0.289 | 0.320 | 0.147 | 29.3% | 6.6% | 16.5% | 45.3% | 3B | $3,000 | 3B | $3,300 | 3B | $6,400 |
| 6 | Michael Saunders | LEFT | 0.316 | 0.316 | 0.187 | 36.4% | 10.0% | 26.7% | 39.1% | OF | $2,300 | OF | $2,500 | RF | $4,800 |
| 7 | Andrew Knapp | SWITCH | 0.350 | 0.331 | 0.188 | 39.6% | 12.5% | 27.5% | 60.4% | C | $2,400 | C | $3,000 | C | $6,000 |
| 8 | Freddy Galvis | SWITCH | 0.303 | 0.275 | 0.174 | 27.9% | 5.8% | 21.4% | 40.1% | SS | $2,400 | SS | $2,700 | SS | $5,200 |
| 9 | Jeremy Hellickson | RIGHT | 0.200 | 0.187 | 0.070 | 7.0% | 8.7% | 29.0% | 76.5% | P | $6,600 | P | $5,200 | P | $10,400 |
Elite Plays – None
Secondary Plays – Odubel Herrera
Stackability – RED
LA Angels at NY Yankees – 7:05 PM ET
| LA Angels | NY Yankees | ||||||||||||||
 | Parker Bridwell |  | Michael Pineda | ||||||||||||
| RIGHT | RIGHT | ||||||||||||||
| Vegas Moneyline | Vegas Over/Under | ||||||||||||||
| NYY-265 | 10.0 | ||||||||||||||
| Stats | wOBA | xwOBA | HC% | BB% | K% | GB% | Stats | wOBA | xwOBA | HC% | BB% | K% | GB% | ||
|---|---|---|---|---|---|---|---|---|---|---|---|---|---|---|---|
| SP vs. Left (2016-17) | 0.379 | 0.315 | 30.4% | 3.6% | 14.3% | 52.4% | SP vs. Left (2016-17) | 0.332 | 0.302 | 33.7% | 8.3% | 27.4% | 47.2% | ||
| SP vs. Right (2016-17) | 0.453 | 0.461 | 55.0% | 3.9% | 15.4% | 35.0% | SP vs. Right (2016-17) | 0.320 | 0.299 | 30.7% | 5.2% | 25.5% | 48.5% | ||
Pitcher Grind Down
| Parker Bridwell | |||||||||
 | FanDuel | DraftKings | FantasyDraft | ||||||
| Salary: | $5,500 | Salary: | $4,600 | Salary: | $9,200 | ||||
| Salary Rank: | 30 of 30 | Salary Rank: | 30 of 30 | Salary Rank: | 30 of 30 | ||||
| Stats | Starts | SIERA | ERA | K% | BB% | GB% | HC% | SC% | |
|---|---|---|---|---|---|---|---|---|---|
| 2016 | 0 | 4.53 | 13.50 | 20.0% | 6.7% | 20.0% | 54.6% | 9.1% | |
| 2017 | 1 | 4.16 | 2.79 | 12.8% | 2.6% | 51.6% | 37.5% | 12.5% | |
Bridwell is making his second start of the season and in his career. In five Triple-A starts earlier this year, he posted a 3.89 FIP with a strikeout rate of 21%. Those numbers don’t jump off the page and in the first few starts of a call-up, I like to lean on Vegas. They clearly aren’t expecting a lot from Bridwell, as he is a huge underdog in a game that features an over/under of 10.0 runs. The Yankees have the highest implied run total on the board.
Quick Breakdown: Bridwell is an easy fade in all formats tonight, even though he’s the cheapest pitcher on the board.
| Michael Pineda | |||||||||
 | FanDuel | DraftKings | FantasyDraft | ||||||
| Salary: | $8,900 | Salary: | $10,600 | Salary: | $20,700 | ||||
| Salary Rank: | 3 of 30 | Salary Rank: | 2 of 30 | Salary Rank: | 2 of 30 | ||||
| Stats | Starts | SIERA | ERA | K% | BB% | GB% | HC% | SC% | |
|---|---|---|---|---|---|---|---|---|---|
| 2016 | 32 | 3.40 | 4.82 | 27.4% | 7.0% | 45.8% | 32.7% | 17.2% | |
| 2017 | 13 | 3.60 | 3.71 | 23.9% | 5.6% | 52.7% | 30.2% | 18.2% | |
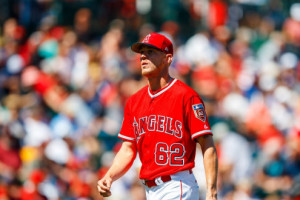
Pineda is one of the most frustrating pitchers in all of baseball. He looks like a Cy Young candidate at times and then looks like Jered Weaver at other times. He’s had good numbers as a whole this season, posting a 3.60 SIERA with a strikeout rate of 24% and a ground ball rate of 53%. My guess is that people will be scared to go back to the well tonight, as the Angels just lit him up in Los Angeles and now he has to face them at home in a much better ballpark for hitters. My plan is to be overweight on Pineda regardless, but especially if his ownership projection is low. He is the best bet in the slate to pick up a win, as he is currently listed as a -265 favorite.
Quick Breakdown: Chris Sale is the obvious cash game target, but Pineda is my favorite tournament play in the slate.
Batter Grind Down
LA Angels
The Angels knocked Michael Pineda around last week and will look to do the same tonight. While we can lean on past results every now and then, I tend to trust the larger sample. I see a matchup against a pitcher that has a 24% strikeout rate, a 53% ground ball rate, and a 30% hard contact rate. I also see a matchup against a pitcher that has held both left and right-handed hitters under a .305 xwOBA in the last two seasons. Kole Calhoun is a viable one-off target with the short porch in right field, but he’s the only hitter that I’m giving consideration to in this lineup.
Projected Lineup (Splits vs. RH Pitching)
| # | Player | Bats | wOBA | xwOBA | ISO | HC% | BB% | K% | GB% | FD Pos. | FD Sal. | DK Pos. | DK Sal. | FDRFT Pos. | FDRFT Sal. |
|---|---|---|---|---|---|---|---|---|---|---|---|---|---|---|---|
| 1 | Cameron Maybin | RIGHT | 0.350 | 0.305 | 0.122 | 24.5% | 11.3% | 17.1% | 61.8% | OF | $3,600 | OF | $3,700 | CF | $7,200 |
| 2 | Kole Calhoun | LEFT | 0.324 | 0.339 | 0.149 | 34.5% | 10.0% | 18.7% | 39.5% | OF | $3,600 | OF | $3,400 | RF | $6,600 |
| 3 | Albert Pujols | RIGHT | 0.319 | 0.357 | 0.172 | 35.9% | 7.8% | 13.1% | 44.2% | 1B | $3,000 | 1B | $3,500 | 1B | $6,900 |
| 4 | Yunel Escobar | RIGHT | 0.307 | 0.319 | 0.090 | 27.4% | 6.8% | 12.1% | 59.0% | 3B | $2,700 | 3B | $3,100 | 3B | $6,000 |
| 5 | Luis Valbuena | LEFT | 0.333 | 0.328 | 0.193 | 37.3% | 13.9% | 24.1% | 37.9% | 3B | $2,600 | 1B/3B | $3,300 | 3B | $6,600 |
| 6 | Andrelton Simmons | RIGHT | 0.314 | 0.317 | 0.106 | 28.3% | 5.9% | 8.5% | 53.3% | SS | $3,300 | SS | $4,100 | SS | $8,000 |
| 7 | Eric Young | SWITCH | 0.406 | 0.293 | 0.240 | 23.1% | 1.8% | 21.1% | 51.4% | OF | $3,300 | OF | $3,400 | CF | $6,800 |
| 8 | Martin Maldonado | RIGHT | 0.288 | 0.293 | 0.143 | 28.1% | 9.3% | 22.1% | 46.9% | C | $2,100 | C | $2,400 | C | $4,800 |
| 9 | Danny Espinosa | SWITCH | 0.279 | 0.281 | 0.137 | 31.6% | 9.6% | 31.1% | 38.9% | 2B | $2,600 | 2B | $2,800 | 2B | $5,400 |
Elite Plays – None
Secondary Plays – Kole Calhoun
Stackability – RED
NY Yankees
The Yankees’ stacks will be out in full force tonight and rightly so. They are facing a rookie pitcher that is only making his second career major league start. Parker Bridwell has had a below-average ground ball rate in most of his time in the minor leagues and we know the Yankees feast on subpar pitching. On the season, they are ranked first in team wOBA against right-handed pitching and most of the damage came against bad pitchers. The entire lineup is in play tonight, but my favorite hitters are in the one through six spots in the lineup.
Projected Lineup (Splits vs. RH Pitching)
| # | Player | Bats | wOBA | xwOBA | ISO | HC% | BB% | K% | GB% | FD Pos. | FD Sal. | DK Pos. | DK Sal. | FDRFT Pos. | FDRFT Sal. |
|---|---|---|---|---|---|---|---|---|---|---|---|---|---|---|---|
| 1 | Brett Gardner | LEFT | 0.344 | 0.326 | 0.149 | 30.7% | 12.2% | 17.7% | 47.7% | OF | $3,900 | OF | $4,100 | LF | $8,100 |
| 2 | Aaron Hicks | SWITCH | 0.342 | 0.311 | 0.168 | 26.5% | 12.6% | 18.1% | 46.1% | OF | $3,400 | OF | $4,400 | CF | $8,700 |
| 3 | Aaron Judge | RIGHT | 0.415 | 0.415 | 0.320 | 49.4% | 12.5% | 33.4% | 38.0% | OF | $4,700 | OF | $5,400 | RF | $10,500 |
| 4 | Matt Holliday | RIGHT | 0.352 | 0.361 | 0.212 | 35.7% | 9.8% | 20.1% | 49.8% | 1B | $3,700 | 1B | $4,400 | IF/OF | $8,700 |
| 5 | Starlin Castro | RIGHT | 0.336 | 0.311 | 0.181 | 31.8% | 3.6% | 18.9% | 49.2% | 2B | $3,400 | 2B | $4,500 | 2B | $8,700 |
| 6 | Gary Sanchez | RIGHT | 0.433 | 0.390 | 0.316 | 38.3% | 9.0% | 22.1% | 47.8% | C | $3,900 | C | $4,900 | C | $9,600 |
| 7 | Didi Gregorius | LEFT | 0.313 | 0.263 | 0.178 | 24.4% | 3.1% | 15.6% | 41.6% | SS | $3,300 | SS | $4,500 | SS | $8,700 |
| 8 | Chase Headley | SWITCH | 0.328 | 0.327 | 0.153 | 32.0% | 11.6% | 24.9% | 43.8% | 3B | $3,000 | 3B | $4,000 | 3B | $7,600 |
| 9 | Chris Carter | RIGHT | 0.334 | 0.347 | 0.242 | 39.3% | 11.6% | 34.4% | 29.9% | 1B | $2,300 | 1B | $3,800 | 1B | $7,600 |
Elite Plays – Brett Gardner, Aaron Judge, Matt Holliday, Gary Sanchez
Secondary Plays – Aaron Hicks, Starlin Castro, Didi Gregorius
Stackability – GREEN
Cincinnati at Tampa Bay – 7:10 PM ET
| Cincinnati | Tampa Bay | ||||||||||||||
 | Amir Garrett |  | Alex Cobb | ||||||||||||
| LEFT | RIGHT | ||||||||||||||
| Vegas Moneyline | Vegas Over/Under | ||||||||||||||
| TB -145 | 9.0 | ||||||||||||||
| Stats | wOBA | xwOBA | HC% | BB% | K% | GB% | Stats | wOBA | xwOBA | HC% | BB% | K% | GB% | ||
|---|---|---|---|---|---|---|---|---|---|---|---|---|---|---|---|
| SP vs. Left (2016-17) | 0.339 | 0.300 | 32.1% | 2.4% | 31.0% | 53.6% | SP vs. Left (2016-17) | 0.369 | 0.349 | 37.4% | 8.6% | 16.4% | 40.0% | ||
| SP vs. Right (2016-17) | 0.386 | 0.367 | 42.0% | 11.9% | 16.3% | 40.3% | SP vs. Right (2016-17) | 0.336 | 0.320 | 37.4% | 5.1% | 15.8% | 52.3% | ||
Pitcher Grind Down
| Amir Garrett | |||||||||
 | FanDuel | DraftKings | FantasyDraft | ||||||
| Salary: | $7,200 | Salary: | $5,400 | Salary: | $10,800 | ||||
| Salary Rank: | 19 of 30 | Salary Rank: | 23 of 30 | Salary Rank: | 22 of 30 | ||||
| Stats | Starts | SIERA | ERA | K% | BB% | GB% | HC% | SC% | |
|---|---|---|---|---|---|---|---|---|---|
| 2017 | 11 | 4.97 | 6.91 | 18.9% | 10.3% | 42.5% | 40.4% | 12.9% | |
Garrett went from being a popular value play earlier in the year to being a pitcher that we auto-stack against. In 11 starts overall, he has a 4.97 SIERA with a strikeout rate of 19%, a walk rate of 10%, and a hard contact rate of 40%. He has been fairly tough on left-handed hitters, but has been obliterated by righties to the tun of a .367 xwOBA and a 42% hard contact rate. Until he faces a lineup with nine left-handed hitters in it (which is never going to happen), we should continue to avoid Garrett.
Quick Breakdown: Garrett’s production has dropped off the map. Continue avoiding him in all formats.
| Alex Cobb | |||||||||
 | FanDuel | DraftKings | FantasyDraft | ||||||
| Salary: | $7,900 | Salary: | $7,100 | Salary: | $14,100 | ||||
| Salary Rank: | 10 of 30 | Salary Rank: | 9 of 30 | Salary Rank: | 9 of 30 | ||||
| Stats | Starts | SIERA | ERA | K% | BB% | GB% | HC% | SC% | |
|---|---|---|---|---|---|---|---|---|---|
| 2016 | 5 | 4.50 | 8.59 | 15.4% | 6.7% | 52.5% | 29.6% | 17.3% | |
| 2017 | 14 | 4.73 | 4.17 | 16.2% | 6.8% | 45.1% | 39.6% | 13.2% | |
Cobb just hasn’t been able to regain that form he had prior to Tommy John surgery. He didn’t look great last season and through 14 starts this season, he has a 4.73 SIERA with a strikeout rate of only 16%. When you combine a low strikeout rate with a 40% hard contact rate, you can see why he has struggled so badly. Many people may not realize this, but the Reds are actually a top eight offense against right-handed pitching. They are also a high contact team, which limits the opposing pitcher’s upside.
Quick Breakdown: Cobb may be a favorite here, but he has more risk than potential reward at this stage of his career.
Batter Grind Down
Cincinnati
The Reds aren’t an offense that we typically target away from home, but Alex Cobb has allowed a 37% hard contact rate to both left and right-handed hitters in the last two seasons. This isn’t a great ballpark for offensive production and I don’t love the idea of a full Reds’ stack, but we can certainly look at a few of their hitters as one-off targets. Scooter Gennett has been seeing the ball well recently, Joey Votto has some of the best numbers in baseball against right-handed pitching, and Scott Schebler continues to rake and nobody seems to notice.
Projected Lineup (Splits vs. RH Pitching)
| # | Player | Bats | wOBA | xwOBA | ISO | HC% | BB% | K% | GB% | FD Pos. | FD Sal. | DK Pos. | DK Sal. | FDRFT Pos. | FDRFT Sal. |
|---|---|---|---|---|---|---|---|---|---|---|---|---|---|---|---|
| 1 | Billy Hamilton | SWITCH | 0.302 | 0.252 | 0.078 | 18.5% | 8.9% | 20.1% | 47.5% | OF | $2,800 | OF | $4,100 | CF | $8,000 |
| 2 | Scooter Gennett | LEFT | 0.326 | 0.292 | 0.175 | 31.3% | 5.4% | 20.1% | 42.9% | 2B | $2,400 | 2B/OF | $3,700 | 2B | $7,200 |
| 3 | Joey Votto | LEFT | 0.423 | 0.436 | 0.257 | 40.1% | 17.3% | 14.3% | 37.2% | 1B | $4,200 | 1B | $4,400 | 1B | $8,400 |
| 4 | Adam Duvall | RIGHT | 0.332 | 0.326 | 0.253 | 36.6% | 5.8% | 27.0% | 33.7% | OF | $3,400 | OF | $3,700 | IF/OF | $7,200 |
| 5 | Scott Schebler | LEFT | 0.341 | 0.335 | 0.215 | 35.9% | 7.9% | 21.4% | 49.3% | OF | $3,000 | OF | $3,600 | RF | $7,200 |
| 6 | Eugenio Suarez | RIGHT | 0.316 | 0.315 | 0.155 | 33.2% | 8.2% | 23.6% | 40.9% | 3B | $3,200 | 3B | $3,600 | 3B | $7,200 |
| 7 | Jose Peraza | RIGHT | 0.309 | 0.297 | 0.093 | 19.6% | 1.8% | 13.7% | 43.7% | 2B | $2,300 | 2B | $3,400 | 2B | $6,800 |
| 8 | Devin Mesoraco | RIGHT | 0.298 | 0.297 | 0.198 | 22.1% | 8.4% | 18.9% | 41.2% | C | $2,500 | C | $3,300 | C | $6,600 |
| 9 | Jesse Winker | LEFT | 0.617 | 0.407 | 0.500 | 0.0% | 0.0% | 50.0% | 0.0% | OF | $2,000 | OF | $2,800 | LF | $5,400 |
Elite Plays – Scott Schebler
Secondary Plays – Billy Hamilton, Scooter Gennett, Joey Votto, Adam Duvall
Stackability – ORANGE / YELLOW
Tampa Bay
The Rays have a high run projection considering the fact that they are playing in a pitcher-friendly ballpark, but it’s actually the 14th highest in the slate. Everyone will be overlooking Tampa Bay, despite having one of the best matchups on the board. Amir Garrett has not been able to figure out right-handed hitters, allowing a .367 xwOBA with a 42% hard contact rate and a 12% walk rate this season. The Rays struggle as a whole against southpaws, but maybe this is a matchup that can get them going. They are a sneaky stack for tournaments and we can look to Evan Longoria and Trevor Plouffe ($2,100 on FanDuel) in all formats.
Projected Lineup (Splits vs. LH Pitching)
| # | Player | Bats | wOBA | xwOBA | ISO | HC% | BB% | K% | GB% | FD Pos. | FD Sal. | DK Pos. | DK Sal. | FDRFT Pos. | FDRFT Sal. |
|---|---|---|---|---|---|---|---|---|---|---|---|---|---|---|---|
| 1 | Steve Souza | RIGHT | 0.285 | 0.277 | 0.128 | 31.2% | 8.0% | 34.4% | 41.8% | OF | $3,700 | OF | $4,200 | RF | $8,100 |
| 2 | Corey Dickerson | LEFT | 0.316 | 0.287 | 0.133 | 32.1% | 3.9% | 27.1% | 51.4% | OF | $3,900 | OF | $4,600 | LF | $8,800 |
| 3 | Evan Longoria | RIGHT | 0.296 | 0.343 | 0.184 | 37.2% | 10.0% | 21.1% | 37.8% | 3B | $3,600 | 3B | $3,700 | 3B | $7,200 |
| 4 | Logan Morrison | LEFT | 0.309 | 0.315 | 0.157 | 28.7% | 11.4% | 25.0% | 46.0% | 1B | $3,900 | 1B | $4,400 | 1B | $8,700 |
| 5 | Tim Beckham | RIGHT | 0.323 | 0.294 | 0.131 | 36.2% | 8.4% | 31.5% | 51.5% | SS | $3,000 | SS | $3,800 | SS | $7,500 |
| 6 | Trevor Plouffe | RIGHT | 0.325 | 0.347 | 0.167 | 38.3% | 9.2% | 23.9% | 45.7% | 3B | $2,100 | 3B | $3,500 | 3B | $6,900 |
| 7 | Daniel Robertson | RIGHT | 0.347 | 0.288 | 0.113 | 21.2% | 6.9% | 3.4% | 64.0% | OF | $2,500 | OF | $2,900 | LF | $5,600 |
| 8 | Derek Norris | RIGHT | 0.286 | 0.322 | 0.177 | 41.9% | 9.3% | 20.9% | 29.8% | C | $2,500 | C | $2,600 | C | $5,100 |
| 9 | Peter Bourjos | RIGHT | 0.306 | 0.253 | 0.093 | 27.6% | 5.8% | 22.6% | 46.4% | OF | $2,300 | OF | $2,900 | CF | $5,700 |
Elite Plays – Evan Longoria, Trevor Plouffe (FD)
Secondary Plays – Steve Souza, Logan Morrison, Tim Beckham, Trevor Plouffe (DK & FDRFT)
Stackability – YELLOW
Washington at Miami – 7:10 PM ET
| Washington | Miami | ||||||||||||||
 | Gio Gonzalez |  | Edinson Volquez | ||||||||||||
| LEFT | RIGHT | ||||||||||||||
| Vegas Moneyline | Vegas Over/Under | ||||||||||||||
| WAS-105 | 9.0 | ||||||||||||||
| Stats | wOBA | xwOBA | HC% | BB% | K% | GB% | Stats | wOBA | xwOBA | HC% | BB% | K% | GB% | ||
|---|---|---|---|---|---|---|---|---|---|---|---|---|---|---|---|
| SP vs. Left (2016-17) | 0.265 | 0.307 | 26.2% | 7.5% | 21.3% | 55.8% | SP vs. Left (2016-17) | 0.349 | 0.369 | 35.5% | 11.7% | 17.1% | 45.9% | ||
| SP vs. Right (2016-17) | 0.325 | 0.317 | 33.9% | 8.9% | 22.5% | 43.8% | SP vs. Right (2016-17) | 0.321 | 0.313 | 28.2% | 7.9% | 18.8% | 55.7% | ||
Pitcher Grind Down
| Gio Gonzalez | |||||||||
 | FanDuel | DraftKings | FantasyDraft | ||||||
| Salary: | $8,800 | Salary: | $9,600 | Salary: | $18,400 | ||||
| Salary Rank: | 4 of 30 | Salary Rank: | 4 of 30 | Salary Rank: | 4 of 30 | ||||
| Stats | Starts | SIERA | ERA | K% | BB% | GB% | HC% | SC% | |
|---|---|---|---|---|---|---|---|---|---|
| 2016 | 32 | 3.96 | 4.57 | 22.4% | 7.7% | 47.6% | 32.7% | 18.1% | |
| 2017 | 14 | 4.61 | 2.89 | 21.9% | 10.5% | 43.8% | 31.3% | 22.2% | |
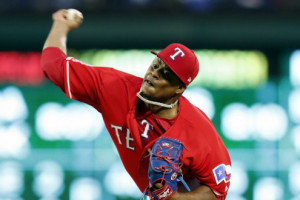
Gonzalez has a 2.89 ERA, but as I said with Ervin Santana and Wade Miley, it’s unsustainable with the way that he is pitching. You can only skirt by with a .267 BABIP and an 85% LOB% for so long, eventually it is going to catch up to you. Everything other than his ERA suggests that Gonzalez is a worse pitcher than he was a year ago. In 14 starts this season, he has a 4.61 SIERA with a walk rate of 10.5%. I said to fade Tanner Roark against the Marlins last night and I’m going to recommend fading Gonzalez against them tonight.
Quick Breakdown: I would much rather go back to Michael Pineda at this price point. Don’t be fooled by Gio’s low ERA.
| Edinson Volquez | |||||||||
 | FanDuel | DraftKings | FantasyDraft | ||||||
| Salary: | $7,700 | Salary: | $7,200 | Salary: | $14,400 | ||||
| Salary Rank: | 13 of 30 | Salary Rank: | 8 of 30 | Salary Rank: | 8 of 30 | ||||
| Stats | Starts | SIERA | ERA | K% | BB% | GB% | HC% | SC% | |
|---|---|---|---|---|---|---|---|---|---|
| 2016 | 34 | 4.72 | 5.37 | 16.3% | 8.9% | 51.2% | 31.7% | 19.5% | |
| 2017 | 13 | 4.81 | 3.72 | 22.2% | 12.8% | 48.4% | 33.2% | 19.9% | |
At this point, it might be better to take out a coin and flip to see whether or not Volquez is going to have a good start or not. He has been incredibly inconsistent this season. After struggling for two months straight, he had that two-start stretch where he had the no-hitter and another eight strikeout game to go with it. He had seemingly found some form until his last start, where he only lasted four innings against the A’s. I’m not a big fan of inconsistency at the pitcher position, especially when the pitcher in question is facing a talented offense like the Nationals.
Quick Breakdown: In a 15 game slate, there is no need to give Volquez consideration in a matchup against the Nationals.
Batter Grind Down
Washington
Paging Bryce Harper and Daniel Murphy. Paging Bryce Harper and Daniel Murphy. Over the last two seasons, Edinson Volquez has allowed a .369 xwOBA, a 36% hard contact rate, and a 12% walk rate to left-handed hitters. You will be hard-pressed to find a better matchup for these two lefties. We can also add Brian Goodwin into the mix, assuming he bats in the two-hole again. Trea Turner is expensive and doesn’t have as good of a matchup as the lefties, but he’s a reverse-splits hitter with a decent stolen base matchup.
Projected Lineup (Splits vs. RH Pitching)
| # | Player | Bats | wOBA | xwOBA | ISO | HC% | BB% | K% | GB% | FD Pos. | FD Sal. | DK Pos. | DK Sal. | FDRFT Pos. | FDRFT Sal. |
|---|---|---|---|---|---|---|---|---|---|---|---|---|---|---|---|
| 1 | Trea Turner | RIGHT | 0.382 | 0.329 | 0.232 | 30.8% | 4.5% | 18.3% | 47.5% | SS | $4,400 | SS | $4,700 | IF/OF | $9,200 |
| 2 | Brian Goodwin | LEFT | 0.317 | 0.264 | 0.224 | 33.3% | 5.7% | 25.7% | 45.7% | OF | $2,500 | OF | $3,600 | RF | $7,200 |
| 3 | Bryce Harper | LEFT | 0.382 | 0.397 | 0.245 | 34.9% | 18.3% | 15.5% | 39.4% | OF | $4,700 | OF | $5,500 | RF | $10,800 |
| 4 | Ryan Zimmerman | RIGHT | 0.331 | 0.341 | 0.198 | 36.4% | 5.7% | 23.0% | 44.7% | 1B | $3,900 | 1B | $4,400 | 1B | $8,700 |
| 5 | Daniel Murphy | LEFT | 0.412 | 0.396 | 0.247 | 38.2% | 6.7% | 8.8% | 35.9% | 2B | $4,000 | 2B | $4,600 | 2B | $8,800 |
| 6 | Anthony Rendon | RIGHT | 0.343 | 0.344 | 0.189 | 34.8% | 9.7% | 17.8% | 37.1% | 3B | $3,500 | 3B | $4,200 | 3B | $8,000 |
| 7 | Matt Wieters | SWITCH | 0.307 | 0.320 | 0.161 | 33.3% | 6.4% | 17.8% | 37.3% | C | $2,500 | C | $3,600 | C | $7,200 |
| 8 | Michael Taylor | RIGHT | 0.284 | 0.273 | 0.167 | 31.6% | 5.2% | 31.6% | 41.5% | OF | $3,000 | OF | $4,200 | CF | $8,000 |
| 9 | Gio Gonzalez | LEFT | 0.206 | 0.189 | 0.033 | 11.6% | 2.7% | 37.0% | 51.5% | P | $8,800 | P | $9,600 | P | $18,400 |
Elite Plays – Bryce Harper, Daniel Murphy
Secondary Plays – Trea Turner, Brian Goodwin, Ryan Zimmerman, Matt Wieters
Stackability – YELLOW
Miami
Targeting left-handed hitters against Gio Gonzalez isn’t a profitable strategy. He limits lefties to a 26% hard contact rate and induces a 56% ground ball rate. Right-handed hitters have had much more success against him though, posting a 34% hard contact rate with a higher walk rate and a much lower ground ball rate. The Marlins may not have a lineup full of right-handed power hitters, but they do have Giancarlo Stanton and Marcell Ozuna, who both own a .409+ xwOBA and a 45%+ hard contact rate against southpaws.
Projected Lineup (Splits vs. LH Pitching)
| # | Player | Bats | wOBA | xwOBA | ISO | HC% | BB% | K% | GB% | FD Pos. | FD Sal. | DK Pos. | DK Sal. | FDRFT Pos. | FDRFT Sal. |
|---|---|---|---|---|---|---|---|---|---|---|---|---|---|---|---|
| 1 | Dee Gordon | LEFT | 0.258 | 0.211 | 0.041 | 12.7% | 1.9% | 14.3% | 63.9% | 2B | $3,200 | 2B | $4,000 | 2B | $7,800 |
| 2 | Giancarlo Stanton | RIGHT | 0.434 | 0.413 | 0.368 | 52.1% | 14.7% | 25.0% | 46.8% | OF | $3,900 | OF | $4,400 | RF | $8,700 |
| 3 | Christian Yelich | LEFT | 0.311 | 0.325 | 0.120 | 28.4% | 6.0% | 20.6% | 63.1% | OF | $3,600 | OF | $4,200 | CF | $8,100 |
| 4 | Marcell Ozuna | RIGHT | 0.377 | 0.409 | 0.244 | 45.1% | 9.2% | 18.9% | 40.6% | OF | $4,000 | OF | $4,300 | LF | $8,400 |
| 5 | J.T. Realmuto | RIGHT | 0.317 | 0.309 | 0.180 | 28.4% | 8.7% | 20.8% | 44.1% | C | $3,000 | C | $3,600 | C | $7,200 |
| 6 | Justin Bour | LEFT | 0.410 | 0.351 | 0.301 | 36.2% | 7.6% | 32.9% | 46.8% | 1B | $3,500 | 1B | $4,400 | 1B | $8,400 |
| 7 | JT Riddle | LEFT | 0.273 | 0.217 | 0.086 | 24.0% | 0.0% | 30.6% | 62.5% | SS | $2,600 | SS | $2,600 | SS | $5,100 |
| 8 | Christian Colon | RIGHT | 0.258 | 0.229 | 0.075 | 22.6% | 6.7% | 20.0% | 58.0% | 2B | $2,200 | 2B/3B | $2,500 | 2B | $4,800 |
| 9 | Edinson Volquez | RIGHT | 0.000 | 0.023 | 0.000 | 0.0% | 0.0% | 66.7% | 100.0% | P | $7,700 | P | $7,200 | P | $14,400 |