MLB Grind Down: Sunday, April 30th

Jump to Page 1 2 3
The RotoGrinders MLB Grind Down will give you an in-depth analysis into the upcoming MLB schedule. This article will break down the numbers for every single game and give you analysis on which trends you can exploit. While matchups are a major factor in daily fantasy baseball, there are plenty of other factors to consider such as injuries, weather, and salaries.
The analysis should point you in the right direction, but it is still up to you to decipher the information and make your own selections. No sport has more variance than baseball. The best choice is not always the right choice but following the trends will win you money over time.
Note: As always, if you want to try a new DFS site, be sure to click through a RotoGrinders link and use our DraftKings promo code and FanDuel promo code to receive the best perks in the industry.
Stackability Rating System:
GREEN – A viable full stack in cash games and GPPs.
YELLOW – A viable mini-stack in cash games and full stack in GPPs.
ORANGE – A viable stack in large field GPPs.
RED – Not a recommended stack for cash games or GPPs.
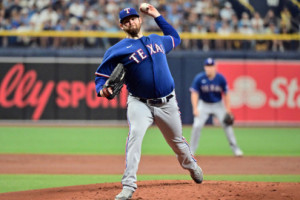
Baltimore at NY Yankees – 1:05 PM ET
| Baltimore | NY Yankees | ||||||||||
 | Wade Miley |  | Jordan Montgomery | ||||||||
| LEFT | LEFT | ||||||||||
| Vegas Moneyline | Vegas Over/Under | ||||||||||
| NYY-119 | 9.0 | ||||||||||
| Stats | wOBA | HC% | BB% | K% | GB% | Stats | wOBA | HC% | BB% | K% | GB% |
|---|---|---|---|---|---|---|---|---|---|---|---|
| SP vs. Left (2016-17) | 0.280 | 36.0% | 9.0% | 21.1% | 53.6% | SP vs. Left (2016-17) | 0.357 | 33.3% | 0.0% | 50.0% | 66.7% |
| SP vs. Right (2016-17) | 0.345 | 33.3% | 7.4% | 20.7% | 45.9% | SP vs. Right (2016-17) | 0.363 | 22.7% | 9.7% | 19.4% | 36.4% |
Pitcher Grind Down
| Wade Miley | |||||||||
 | FanDuel | DraftKings | FantasyDraft | ||||||
| Salary: | $7,800 | Salary: | $8,200 | Salary: | $15,900 | ||||
| Salary Rank: | 7 of 30 | Salary Rank: | 6 of 30 | Salary Rank: | 6 of 30 | ||||
| Stats | Starts | SIERA | ERA | K% | BB% | GB% | HC% | SC% | |
|---|---|---|---|---|---|---|---|---|---|
| 2016 | 30 | 4.21 | 5.37 | 19.3% | 6.9% | 47.3% | 33.3% | 17.3% | |
| 2017 | 4 | 3.58 | 2.08 | 31.4% | 13.7% | 49.1% | 38.2% | 20.0% | |
There is a total of 15 games on the schedule today. The first 10 are part of the main slate on most sites while the last five make up a smaller late slate. When I’m referring to the main (or early) slate, I mean the first 10 games. If I mention the late slate, I’m talking about the final five games. Before we dive in, I need to mention one other thing. I do a brief check of the weather to identify any situations that would alter a game significantly. As long as I don’t identify any major issue, I write each game with the idea that weather won’t be a factor. I encourage you to read the weather report here on RotoGrinders (posted on the forums) and form your own opinion about the risk involved with any games that could be canceled. In my quick forecast, the trouble spots I identified are Cleveland, Detroit, and St. Louis. I’m writing each game with the idea that they play. If you feel different, then adjust accordingly.
Our first game features Wade Miley against the Yankees. Miley has started off the year red-hot with a 2.08 ERA and a 31.4% K rate. The reason you’ll often see last season’s stats quoted in this article is we don’t have a very large sample for 2017 yet. Miley has made four starts total. One was against these Yankees (his worst) while the other three were Toronto, Cincinnati, and Tampa Bay. I’m more inclined to believe Miley is the pitcher we saw last year with a 5.37 ERA, 19.3% K rate and 33.3% hard contact allowed. On a positive note, going back to last season we know that the Yankees are a different offense versus LH pitching. They have a .317 wOBA against RH compared to .310 against LH.
Quick Breakdown: – After yesterday’s offensive outburst, I don’t have much interest in Wade Miley. His price is slightly inflated right now thanks to making three of four starts against poor offensive teams.
| Jordan Montgomery | |||||||||
 | FanDuel | DraftKings | FantasyDraft | ||||||
| Salary: | $6,600 | Salary: | $6,900 | Salary: | $13,800 | ||||
| Salary Rank: | 20 of 30 | Salary Rank: | 15 of 30 | Salary Rank: | 15 of 30 | ||||
| Stats | Starts | SIERA | ERA | K% | BB% | GB% | HC% | SC% | |
|---|---|---|---|---|---|---|---|---|---|
| 2017 | 3 | 3.90 | 3.78 | 22.9% | 8.6% | 38.3% | 23.4% | 12.8% | |
Jordan Montgomery is making his fourth start of the season. He’s clinging to a 3.78 ERA and a 22.9% K rate. If he could pitch to those number over a season that would make him a respectable back-end starter. He’ll face a tough task today against a pretty good Orioles lineup. It’s tough to draw any conclusions from Montgomery’s time in the majors this season. He’s only faced 70 batters total (eight LH). He’s allowing a .357 wOBA to LH and .363 to RH. Of the 62 RH hitters he’s faced he’s allowing a 45% fly ball rate.
Quick Breakdown: – We need a larger sample before we can determine who Jordan Montgomery is. He hasn’t yet faced a major league lineup as good as this Orioles team is. You can certainly get away with stacking the Orioles RH hitters today though given Montgomery’s fly ball tendencies.
Batter Grind Down
Baltimore
The Orioles weren’t a great offense last season versus LH pitching. The numbers below definitely tell that story. If Joey Rickard ends up leading off, he’s a strong play. Manny Machado, Adam Jones, Welington Castillo, and Mark Trumbo are all RH hitters who should be able to take advantage of Montgomery. The Orioles have plenty to offer here but there are also some great hitting spots elsewhere on this slate as well.
Projected Lineup (Splits vs. LH Pitching)
| # | Player | Bats | wOBA | ISO | HC% | BB% | K% | GB% | FD Pos. | FD Sal. | DK Pos. | DK Sal. | FDRFT Pos. | FDRFT Sal. |
|---|---|---|---|---|---|---|---|---|---|---|---|---|---|---|
| 1 | Joey Rickard | RIGHT | 0.354 | 0.172 | 30.6% | 7.4% | 16.0% | 39.1% | OF | $2,000 | OF | $3,000 | RF | $6,000 |
| 2 | Adam Jones | RIGHT | 0.261 | 0.105 | 31.1% | 6.5% | 20.5% | 39.4% | OF | $3,400 | OF | $4,400 | CF | $8,400 |
| 3 | Manny Machado | RIGHT | 0.381 | 0.208 | 39.9% | 9.8% | 13.4% | 39.2% | 3B | $3,300 | 3B | $5,000 | 3B | $9,600 |
| 4 | Mark Trumbo | RIGHT | 0.255 | 0.188 | 37.2% | 5.7% | 27.1% | 41.1% | OF | $2,900 | OF | $4,500 | IF/OF | $8,800 |
| 5 | Chris Davis | LEFT | 0.314 | 0.175 | 32.6% | 10.3% | 33.2% | 33.3% | 1B | $3,400 | 1B | $4,600 | IF/OF | $9,000 |
| 6 | Welington Castillo | RIGHT | 0.351 | 0.217 | 50.5% | 8.0% | 23.3% | 40.8% | C | $3,100 | C | $3,700 | C | $7,200 |
| 7 | Trey Mancini | RIGHT | 0.400 | 0.389 | 26.9% | 2.7% | 27.0% | 57.7% | 1B | $2,900 | 1B/OF | $3,300 | 1B | $6,400 |
| 8 | Jonathan Schoop | RIGHT | 0.295 | 0.159 | 21.9% | 4.9% | 23.6% | 48.4% | 2B | $3,400 | 2B | $3,700 | 2B | $7,200 |
| 9 | J.J. Hardy | RIGHT | 0.312 | 0.157 | 42.2% | 8.5% | 14.8% | 45.9% | SS | $2,200 | SS | $3,100 | SS | $6,000 |
Elite Plays – Manny Machado and Adam Jones
Secondary Plays – Joey Rickard and Welington Castillo
Stackability – GREEN – A viable full stack in cash games and GPPs.
NY Yankees
The Yankees hung 12 runs on the Orioles yesterday as they drove Ubaldo Jimenez out of the game early. That was a slightly different situation with the wind blowing out and a right-hander on the mound. This is still a very potent offense as evidenced by the Vegas total here. Matt Holliday is the top play here as he owns a .350 wOBA against LH pitching. You can certainly get away with using Chase Headley, Aaron Judge, Starlin Castro and even the red-hot Brett Gardner. Miley allowed a .345 wOBA last season to RH batters and 33% hard contact.
Projected Lineup (Splits vs. LH Pitching)
| # | Player | Bats | wOBA | ISO | HC% | BB% | K% | GB% | FD Pos. | FD Sal. | DK Pos. | DK Sal. | FDRFT Pos. | FDRFT Sal. |
|---|---|---|---|---|---|---|---|---|---|---|---|---|---|---|
| 1 | Brett Gardner | LEFT | 0.276 | 0.080 | 23.5% | 7.5% | 18.9% | 53.8% | OF | $2,900 | OF | $3,700 | LF | $7,200 |
| 2 | Chase Headley | SWITCH | 0.304 | 0.088 | 29.3% | 8.5% | 13.2% | 44.2% | 3B | $3,500 | 3B | $3,700 | 3B | $7,200 |
| 3 | Matt Holliday | RIGHT | 0.350 | 0.279 | 43.1% | 9.4% | 15.2% | 47.1% | OF | $2,900 | 1B/OF | $4,000 | IF/OF | $7,800 |
| 4 | Jacoby Ellsbury | LEFT | 0.273 | 0.072 | 25.5% | 5.6% | 16.0% | 43.2% | OF | $3,300 | OF | $3,900 | CF | $7,800 |
| 5 | Starlin Castro | RIGHT | 0.320 | 0.164 | 32.4% | 4.8% | 18.7% | 44.4% | 2B | $3,200 | 2B | $3,600 | 2B | $7,200 |
| 6 | Aaron Judge | RIGHT | 0.340 | 0.240 | 53.9% | 16.7% | 40.0% | 30.8% | OF | $3,700 | OF | $3,800 | RF | $7,600 |
| 7 | Didi Gregorius | LEFT | 0.359 | 0.149 | 22.9% | 2.5% | 7.5% | 38.5% | SS | $2,900 | SS | $3,600 | SS | $7,200 |
| 8 | Chris Carter | RIGHT | 0.362 | 0.315 | 37.6% | 12.9% | 25.9% | 37.6% | 1B | $2,200 | 1B | $3,700 | 1B | $7,200 |
| 9 | Austin Romine | RIGHT | 0.291 | 0.147 | 28.7% | 4.6% | 15.6% | 51.8% | C | $2,400 | C | $2,800 | C | $5,400 |
Elite Plays – Matt Holliday and Aaron Judge
Secondary Plays – Chase Headley, Brett Gardner, and Starlin Castro
Stackability – GREEN – A viable full stack in cash games and GPPs.
Tampa Bay at Toronto – 1:07 PM ET
| Tampa Bay | Toronto | ||||||||||
 | Chris Archer |  | Aaron Sanchez | ||||||||
| RIGHT | RIGHT | ||||||||||
| Vegas Moneyline | Vegas Over/Under | ||||||||||
| TB -104 | 7.5 | ||||||||||
| Stats | wOBA | HC% | BB% | K% | GB% | Stats | wOBA | HC% | BB% | K% | GB% |
|---|---|---|---|---|---|---|---|---|---|---|---|
| SP vs. Left (2016-17) | 0.304 | 33.6% | 8.5% | 27.4% | 46.0% | SP vs. Left (2016-17) | 0.296 | 32.9% | 11.0% | 21.3% | 47.4% |
| SP vs. Right (2016-17) | 0.309 | 33.0% | 7.8% | 26.4% | 46.6% | SP vs. Right (2016-17) | 0.262 | 27.9% | 4.7% | 19.0% | 58.6% |
Pitcher Grind Down
| Chris Archer | |||||||||
 | FanDuel | DraftKings | FantasyDraft | ||||||
| Salary: | $9,100 | Salary: | $10,500 | Salary: | $20,400 | ||||
| Salary Rank: | 3 of 30 | Salary Rank: | 2 of 30 | Salary Rank: | 2 of 30 | ||||
| Stats | Starts | SIERA | ERA | K% | BB% | GB% | HC% | SC% | |
|---|---|---|---|---|---|---|---|---|---|
| 2016 | 33 | 3.50 | 4.02 | 27.4% | 7.9% | 47.8% | 32.8% | 18.0% | |
| 2017 | 5 | 3.95 | 3.94 | 23.4% | 9.5% | 37.8% | 36.3% | 15.4% | |
The second game of the day features a 7.5 over/under as Chris Archer and Aaron Sanchez face off. With the lack of pitching options, both starters are in play here. Archer has struggled a bit this season as his K rate has dropped to 23.4% through four starts. He’s also allowing more hard contact than we would like to see at 33.4%. The good news for Archer is that this Blue Jays offense has not been good against RH pitching this season. They have a 23.4% K rate, .279 wOBA and 77 wRC+. They’ve been heating up over the past few weeks but a talented pitcher like Archer should be able to handle them.
Quick Breakdown: – Archer is my third-ranked pitching option today behind Syndergaard and Keuchel. He’s in play in cash games and tournaments on both single and multi-pitcher sites.
| Aaron Sanchez | |||||||||
 | FanDuel | DraftKings | FantasyDraft | ||||||
| Salary: | $9,100 | Salary: | $8,000 | Salary: | $15,600 | ||||
| Salary Rank: | 3 of 30 | Salary Rank: | 8 of 30 | Salary Rank: | 8 of 30 | ||||
| Stats | Starts | SIERA | ERA | K% | BB% | GB% | HC% | SC% | |
|---|---|---|---|---|---|---|---|---|---|
| 2016 | 30 | 4.01 | 3.00 | 20.4% | 8.0% | 54.4% | 30.3% | 20.7% | |
| 2017 | 2 | 4.50 | 4.38 | 17.3% | 7.7% | 35.9% | 30.8% | 15.4% | |
Aaron Sanchez returns from the disabled list to make a start against the Rays. Sanchez will be on a pitch limit though he will be allowed to throw his curveball without restriction. The Rays are fourth in the MLB in K rate against RH pitching at 25% this season. Sanchez is a groundball pitcher with a 54.4% rate last season. Sanchez already faced this Rays lineup once this season, racking up six Ks through seven innings and allowing one run. He needed 101 pitches to do that though.
Quick Breakdown: – Even on a pitch limit, Sanchez has some upside as an SP2 on DraftKings. He’s being offered at a discount relative to his opening day price of $9,500. If Sanchez can limit the damage with his groundball the Rays should be able to help with some strikeouts. Even in limited action, I could see Sanchez posting a line of 15-20 DraftKings points. That might be enough on a day like today.
Batter Grind Down
Tampa Bay
Given Sanchez’ ability to induce groundballs and avoid home runs, I won’t have a lot of Rays exposure. Evan Longoria hits RH pitching well and could be worth a flyer though. Beyond that, there isn’t much else to love except for maybe Corey Dickerson as he has a .336 wOBA against RH pitching.
Projected Lineup (Splits vs. RH Pitching)
| # | Player | Bats | wOBA | ISO | HC% | BB% | K% | GB% | FD Pos. | FD Sal. | DK Pos. | DK Sal. | FDRFT Pos. | FDRFT Sal. |
|---|---|---|---|---|---|---|---|---|---|---|---|---|---|---|
| 1 | Corey Dickerson | LEFT | 0.336 | 0.263 | 30.8% | 6.5% | 22.7% | 34.0% | OF | $3,100 | OF | $3,200 | LF | $6,400 |
| 2 | Kevin Kiermaier | LEFT | 0.312 | 0.152 | 30.9% | 9.4% | 17.9% | 44.7% | OF | $2,900 | OF | $3,300 | CF | $6,600 |
| 3 | Evan Longoria | RIGHT | 0.355 | 0.253 | 37.1% | 6.3% | 21.8% | 32.6% | 2B | $3,200 | 3B | $4,100 | 3B | $8,100 |
| 4 | Brad Miller | LEFT | 0.338 | 0.245 | 36.1% | 8.6% | 25.0% | 45.3% | SS | $3,100 | 2B | $3,500 | SS | $6,800 |
| 5 | Steve Souza | RIGHT | 0.338 | 0.182 | 31.8% | 8.1% | 31.3% | 40.3% | OF | $3,300 | OF | $3,400 | RF | $6,800 |
| 6 | Logan Morrison | LEFT | 0.322 | 0.195 | 36.3% | 9.5% | 21.4% | 42.5% | 1B | $2,800 | 1B | $3,100 | 1B | $6,000 |
| 7 | Tim Beckham | RIGHT | 0.289 | 0.177 | 40.4% | 4.2% | 30.5% | 44.3% | SS | $2,700 | SS | $2,900 | SS | $5,700 |
| 8 | Shane Peterson | LEFT | 0.390 | 0.217 | 26.7% | 0.0% | 34.8% | 40.0% | OF | $2,200 | OF | $2,100 | LF | $4,200 |
| 9 | Derek Norris | RIGHT | 0.230 | 0.130 | 31.7% | 6.5% | 32.7% | 35.3% | C | $2,700 | C | $5,400 |
Elite Plays – None
Secondary Plays -Corey Dickerson and Evan Longoria
Stackability – ORANGE – A viable stack in large field GPPs.
Toronto
The Jays have not been good at the plate this season. Today they have a tough matchup against Chris Archer. If you insist on going here, stick with the players that have been hitting well lately. That would include Kevin Pillar and Russell Martin. I won’t be going here myself though.
Projected Lineup (Splits vs. RH Pitching)
| # | Player | Bats | wOBA | ISO | HC% | BB% | K% | GB% | FD Pos. | FD Sal. | DK Pos. | DK Sal. | FDRFT Pos. | FDRFT Sal. |
|---|---|---|---|---|---|---|---|---|---|---|---|---|---|---|
| 1 | Kevin Pillar | RIGHT | 0.298 | 0.112 | 26.3% | 4.8% | 15.6% | 49.0% | OF | $3,100 | OF | $3,200 | CF | $6,300 |
| 2 | Ezequiel Carrera | LEFT | 0.288 | 0.107 | 24.1% | 8.2% | 22.4% | 56.5% | OF | $2,700 | OF | $2,700 | RF | $5,200 |
| 3 | Jose Bautista | RIGHT | 0.346 | 0.201 | 39.0% | 17.3% | 22.2% | 38.0% | OF | $3,400 | OF | $4,400 | RF | $8,700 |
| 4 | Kendrys Morales | SWITCH | 0.306 | 0.183 | 41.9% | 8.8% | 19.6% | 49.1% | 1B | $2,800 | 1B | $3,600 | 1B | $7,200 |
| 5 | Justin Smoak | SWITCH | 0.317 | 0.192 | 40.3% | 11.7% | 36.4% | 26.8% | 1B | $2,600 | 1B | $2,900 | 1B | $5,600 |
| 6 | Russell Martin | RIGHT | 0.319 | 0.165 | 29.9% | 11.4% | 27.6% | 47.6% | C | $3,000 | C | $3,500 | C | $6,900 |
| 7 | Chris Coghlan | LEFT | 0.273 | 0.130 | 28.7% | 11.3% | 25.3% | 46.4% | OF | $2,000 | 3B/OF | $2,600 | IF/OF | $5,200 |
| 8 | Devon Travis | RIGHT | 0.325 | 0.157 | 31.1% | 5.7% | 19.9% | 47.2% | 2B | $2,100 | 2B | $3,700 | 2B | $7,200 |
| 9 | Ryan Goins | LEFT | 0.263 | 0.157 | 29.9% | 6.6% | 23.2% | 50.8% | 2B | $2,500 | 2B/SS | $2,300 | 2B | $4,400 |
Elite Plays – None
Secondary Plays – None
Stackability – RED – Not a recommended stack for cash games or GPPs.
Pittsburgh at Miami – 1:10 PM ET
| Pittsburgh | Miami | ||||||||||
 | Chad Kuhl |  | Tom Koehler | ||||||||
| RIGHT | RIGHT | ||||||||||
| Vegas Moneyline | Vegas Over/Under | ||||||||||
| MIA-128 | 8.5 | ||||||||||
| Stats | wOBA | HC% | BB% | K% | GB% | Stats | wOBA | HC% | BB% | K% | GB% |
|---|---|---|---|---|---|---|---|---|---|---|---|
| SP vs. Left (2016-17) | 0.395 | 37.9% | 10.0% | 15.0% | 38.8% | SP vs. Left (2016-17) | 0.346 | 30.5% | 12.7% | 20.4% | 38.7% |
| SP vs. Right (2016-17) | 0.279 | 29.4% | 6.2% | 19.5% | 46.0% | SP vs. Right (2016-17) | 0.322 | 27.0% | 8.6% | 17.4% | 44.9% |
Pitcher Grind Down
| Chad Kuhl | |||||||||
 | FanDuel | DraftKings | FantasyDraft | ||||||
| Salary: | $6,800 | Salary: | $5,700 | Salary: | $11,200 | ||||
| Salary Rank: | 17 of 30 | Salary Rank: | 24 of 30 | Salary Rank: | 24 of 30 | ||||
| Stats | Starts | SIERA | ERA | K% | BB% | GB% | HC% | SC% | |
|---|---|---|---|---|---|---|---|---|---|
| 2016 | 14 | 4.50 | 4.20 | 17.6% | 6.6% | 44.3% | 33.0% | 19.6% | |
| 2017 | 4 | 5.22 | 6.63 | 16.9% | 12.4% | 36.7% | 34.4% | 14.8% | |
Chad Kuhl is sporting a 6.63 ERA through four starts this season. He’s sporting a K rate of 16.6%, a 12.4% BB rate and 34.4% hard contact. He’s been absolutely tagged by LH hitting for a .395 wOBA and 37.9% hard contact. While the Marlins aren’t the most potent offense, they’ve certainly got a couple of left-handers who can do some damage.
Quick Breakdown: – A low K rate and high contact rate against left-handers has me looking elsewhere today. Chad Kuhl can safely be avoided.
| Tom Koehler | |||||||||
 | FanDuel | DraftKings | FantasyDraft | ||||||
| Salary: | $6,800 | Salary: | $6,200 | Salary: | $12,400 | ||||
| Salary Rank: | 17 of 30 | Salary Rank: | 20 of 30 | Salary Rank: | 20 of 30 | ||||
| Stats | Starts | SIERA | ERA | K% | BB% | GB% | HC% | SC% | |
|---|---|---|---|---|---|---|---|---|---|
| 2016 | 33 | 4.85 | 4.33 | 19.0% | 10.7% | 42.2% | 28.6% | 21.0% | |
| 2017 | 4 | 4.68 | 5.14 | 18.9% | 11.1% | 37.7% | 30.2% | 14.3% | |
Tom Koehler has a similar outlook to Chad Kuhl. Koehler will face a Pirates team that doesn’t have much power yet strikes out at a rate of just 16.6% against RH pitching. Nothing really stands out about Koehler. He’s lived around a 18% K rate and 4 ERA for most of his career. If I were looking for a cheap option that provided some safety I might be interested in Koehler. That’s not something that is necessary on this slate though.
Quick Breakdown: – Koehler is unlikely to get blown up by the Pirates offense but he’s also unlikely to rack up enough strikeouts to justify using him as an SP2.
Batter Grind Down
Pittsburgh
If you are looking for a couple of one-off plays, Pirates batting from the left side today aren’t a terrible place to look. Josh Bell owns a .350 wOBA against RH pitching. Andrew McCutchen and John Jaso also grade out fairly well. Koehler had a .346 wOBA against LH hitting last season.
Projected Lineup (Splits vs. RH Pitching)
| # | Player | Bats | wOBA | ISO | HC% | BB% | K% | GB% | FD Pos. | FD Sal. | DK Pos. | DK Sal. | FDRFT Pos. | FDRFT Sal. |
|---|---|---|---|---|---|---|---|---|---|---|---|---|---|---|
| 1 | Josh Harrison | RIGHT | 0.289 | 0.087 | 26.1% | 3.6% | 14.0% | 45.4% | 2B | $3,000 | 2B/3B | $3,500 | 2B | $6,800 |
| 2 | Josh Bell | SWITCH | 0.350 | 0.151 | 32.8% | 14.5% | 15.0% | 49.2% | 1B | $2,700 | 1B | $3,100 | IF/OF | $6,000 |
| 3 | Andrew McCutchen | RIGHT | 0.327 | 0.169 | 35.2% | 9.4% | 21.7% | 35.9% | OF | $3,800 | OF | $4,400 | RF | $8,700 |
| 4 | Gregory Polanco | LEFT | 0.324 | 0.188 | 35.3% | 9.0% | 17.5% | 39.2% | OF | $3,100 | OF | $4,300 | LF | $8,400 |
| 5 | Francisco Cervelli | RIGHT | 0.306 | 0.091 | 26.9% | 13.2% | 18.5% | 54.0% | C | $2,500 | C | $3,000 | C | $6,000 |
| 6 | John Jaso | LEFT | 0.336 | 0.144 | 29.8% | 10.3% | 16.6% | 50.3% | 1B | $2,100 | 1B/OF | $2,900 | 1B | $5,600 |
| 7 | Jordy Mercer | RIGHT | 0.287 | 0.095 | 24.6% | 7.6% | 14.5% | 49.7% | SS | $2,200 | SS | $3,000 | SS | $6,000 |
| 8 | Gift Ngoepe | RIGHT | 2B | $2,100 | SS | $2,400 | SS | $4,800 | ||||||
| 9 | Chad Kuhl | RIGHT | 0.098 | 0.000 | 14.3% | 8.3% | 33.3% | 83.3% | P | $6,800 | P | $5,700 | P | $11,200 |
Elite Plays – Josh Bell
Secondary Plays -Andrew McCutchen and John Jaso
Stackability – ORANGE – A viable stack in large field GPPs.
Miami
Marlins left-handers are in a great spot today. Kuhl allowed 37.8% hard contact last season and a .395 wOBA. Christian Yelich leads the way here with his .382 wOBA, .215 ISO and 41.3% hard contact against RH pitching. Justin Bour should also provide excellent salary relief while Dee Gordon and Giancarlo Stanton could be used to fill out a low-owned Marlins stack.
Projected Lineup (Splits vs. RH Pitching)
| # | Player | Bats | wOBA | ISO | HC% | BB% | K% | GB% | FD Pos. | FD Sal. | DK Pos. | DK Sal. | FDRFT Pos. | FDRFT Sal. |
|---|---|---|---|---|---|---|---|---|---|---|---|---|---|---|
| 1 | Dee Gordon | LEFT | 0.294 | 0.074 | 19.4% | 5.2% | 16.4% | 57.2% | 2B | $3,300 | 2B | $4,400 | 2B | $8,400 |
| 2 | Martin Prado | RIGHT | 0.304 | 0.106 | 25.9% | 5.9% | 11.0% | 49.4% | 3B | $2,900 | 3B | $3,500 | 3B | $6,900 |
| 3 | Christian Yelich | LEFT | 0.382 | 0.215 | 41.8% | 12.3% | 20.3% | 54.8% | OF | $3,900 | OF | $4,500 | LF | $8,700 |
| 4 | Giancarlo Stanton | RIGHT | 0.334 | 0.235 | 39.3% | 9.3% | 29.9% | 38.5% | OF | $4,100 | OF | $4,800 | RF | $9,200 |
| 5 | Marcell Ozuna | RIGHT | 0.326 | 0.176 | 36.7% | 7.2% | 20.0% | 46.4% | OF | $3,200 | OF | $3,700 | CF | $7,200 |
| 6 | Justin Bour | LEFT | 0.343 | 0.224 | 36.1% | 12.4% | 17.1% | 43.6% | 1B | $2,900 | 1B | $3,300 | 1B | $6,600 |
| 7 | J.T. Realmuto | RIGHT | 0.352 | 0.123 | 30.8% | 5.3% | 15.8% | 50.9% | C | $2,900 | C | $3,900 | C | $7,800 |
| 8 | Adeiny Hechavarria | RIGHT | 0.252 | 0.067 | 29.4% | 5.1% | 12.0% | 48.6% | SS | $2,100 | SS | $2,700 | SS | $5,200 |
| 9 | Tom Koehler | RIGHT | 0.066 | 0.000 | 0.0% | 0.0% | 52.3% | 60.0% | P | $6,800 | P | $6,200 | P | $12,400 |
Elite Plays – Christian Yelich
Secondary Plays – Justin Bour and Dee Gordon
Stackability – YELLOW – A viable mini-stack in cash games and full stack in GPPs.
Seattle at Cleveland – 1:10 PM ET
| Seattle | Cleveland | ||||||||||
 | Chase De Jong |  | Josh Tomlin | ||||||||
| RIGHT | RIGHT | ||||||||||
| Vegas Moneyline | Vegas Over/Under | ||||||||||
| CLE-150 | 9.5 | ||||||||||
| Stats | wOBA | HC% | BB% | K% | GB% | Stats | wOBA | HC% | BB% | K% | GB% |
|---|---|---|---|---|---|---|---|---|---|---|---|
| SP vs. Left (2016-17) | 0.349 | 20.0% | 14.3% | 14.3% | 20.0% | SP vs. Left (2016-17) | 0.296 | 37.7% | 2.3% | 14.9% | 47.5% |
| SP vs. Right (2016-17) | 0.286 | 22.2% | 16.7% | 8.3% | 33.3% | SP vs. Right (2016-17) | 0.360 | 32.2% | 3.0% | 17.3% | 42.5% |
Pitcher Grind Down
| Chase De-Jong | |||||||||
 | FanDuel | DraftKings | FantasyDraft | ||||||
| Salary: | $5,500 | Salary: | $4,800 | Salary: | $9,600 | ||||
| Salary Rank: | 29 of 30 | Salary Rank: | 29 of 30 | Salary Rank: | 29 of 30 | ||||
| Stats | Starts | SIERA | ERA | K% | BB% | GB% | HC% | SC% | |
|---|---|---|---|---|---|---|---|---|---|
| 2017 | 0 | 6.75 | 5.79 | 10.5% | 15.8% | 28.6% | 21.4% | 14.3% | |
Chase De Jong is making his first major league start today. The numbers you see above are from 19 batters faced out of the bullpen this season. In the minors, De Jong was closer to a 20% K rate with roughly a 35% ground ball rate. If we use wOBA as a metric, the Indians are the sixth best offense this season against RH pitching at .336. Facing this offense would be a tall task for any major league starter. I don’t have high hopes for De Jong in his first start ever.
Quick Breakdown: – Occasionally, we’ll see a young arm get called up to the majors and produce a great game as the opposing team did not have a scouting report to work with. We’ve already seen De Jong out of the bullpen for a couple of innings this season. He’s not worth the risk in this mathcup.
| Josh Tomlin | |||||||||
 | FanDuel | DraftKings | FantasyDraft | ||||||
| Salary: | $7,000 | Salary: | $5,900 | Salary: | $11,700 | ||||
| Salary Rank: | 16 of 30 | Salary Rank: | 22 of 30 | Salary Rank: | 22 of 30 | ||||
| Stats | Starts | SIERA | ERA | K% | BB% | GB% | HC% | SC% | |
|---|---|---|---|---|---|---|---|---|---|
| 2016 | 29 | 4.24 | 4.40 | 16.3% | 2.8% | 43.8% | 33.9% | 16.4% | |
| 2017 | 4 | 3.46 | 9.33 | 16.1% | 2.3% | 52.2% | 40.0% | 8.6% | |
Josh Tomlin had reverse splits last season allowing a .296 wOBA to LH hitters and a .360 wOBA to RH hitters. He’s not off to a great start this season with a 9.33 ERA. He has been unlucky though as his SIERA says he should be closer to 3.46. The biggest difference between those numbers is Tomlin has stranded just 46.4% of runners this season. He’s also been really unlucky on Batted Balls In Play (BABIP). Even if Tomlin’s luck starts to turn around today, he’s not worth the risk here. Tomlin was a low strikeout arm last year at 16.3% with a high decent groudball rate.
Quick Breakdown: – Tomlin is the type of pitcher that is effective in real life but rarely generates the big fantasy score that we would like to see. He’s not worth using in this matchup.
Batter Grind Down
Seattle
When targeting Mariner bats today keep in mind that Tomlin had reverse splits last season. You can still use the lefties here but righties had more success against Tomlin last season. The Mariners aren’t priced at any kind of discount today as the sites are factoring in Tomlin’s poor performance thus far. Jean Segura should lead off, he owns a .384 wOBA against RH pitching. Taylor Motter, Nelson Cruz and Robinson Cano might be worth a look but this isn’t the best hitting situation on this slate by any means.
Projected Lineup (Splits vs. RH Pitching)
| # | Player | Bats | wOBA | ISO | HC% | BB% | K% | GB% | FD Pos. | FD Sal. | DK Pos. | DK Sal. | FDRFT Pos. | FDRFT Sal. |
|---|---|---|---|---|---|---|---|---|---|---|---|---|---|---|
| 1 | Jean Segura | RIGHT | 0.384 | 0.188 | 29.8% | 5.0% | 12.6% | 52.9% | SS | $3,800 | SS | $4,900 | SS | $9,600 |
| 2 | Ben Gamel | LEFT | 0.188 | 0.026 | 21.4% | 6.8% | 29.5% | 44.0% | OF | $2,100 | OF | $3,700 | RF | $7,200 |
| 3 | Robinson Cano | LEFT | 0.392 | 0.263 | 38.2% | 8.2% | 12.4% | 43.1% | 2B | $4,000 | 2B | $5,200 | 2B | $10,200 |
| 4 | Nelson Cruz | RIGHT | 0.369 | 0.229 | 34.6% | 9.0% | 24.3% | 44.0% | OF | $4,600 | OF | $5,000 | RF | $9,600 |
| 5 | Kyle Seager | LEFT | 0.382 | 0.220 | 39.2% | 12.3% | 14.9% | 34.8% | 3B | $3,900 | 3B | $4,900 | 3B | $9,600 |
| 6 | Guillermo Heredia | SWITCH | 0.336 | 0.095 | 17.1% | 12.0% | 14.0% | 48.5% | OF | $2,400 | OF | $3,400 | LF | $6,800 |
| 7 | Daniel Vogelbach | LEFT | 0.224 | 0.000 | 27.3% | 14.3% | 33.3% | 45.5% | 1B | $2,100 | 1B | $2,800 | 1B | $5,600 |
| 8 | Mike Zunino | RIGHT | 0.306 | 0.215 | 34.6% | 6.8% | 34.4% | 29.2% | C | $2,100 | C | $3,800 | C | $7,600 |
| 9 | Jarrod Dyson | LEFT | 0.299 | 0.095 | 16.6% | 7.6% | 11.1% | 52.4% | OF | $3,300 | OF | $3,800 | CF | $7,600 |
Elite Plays – Jean Segura
Secondary Plays – Nelson Cruz
Stackability – ORANGE – A viable stack in large field GPPs.
Cleveland
The Indians have the highest implied team total on the slate. Because they are facing a rookie pitcher with a high total they are likely to be the highest owned stack today. I can’t say that anyone stacking the Indians is wrong. Francisco Lindor, Jose Ramirez, Michael Brantley, Edwin Encarnacion and Carlos Santana all smash RH pitching. Even Lonnie Chisenhall and Jason Kipnis could be added to an Indians stack here.
Projected Lineup (Splits vs. RH Pitching)
| # | Player | Bats | wOBA | ISO | HC% | BB% | K% | GB% | FD Pos. | FD Sal. | DK Pos. | DK Sal. | FDRFT Pos. | FDRFT Sal. |
|---|---|---|---|---|---|---|---|---|---|---|---|---|---|---|
| 1 | Carlos Santana | SWITCH | 0.383 | 0.272 | 38.5% | 15.4% | 16.1% | 36.6% | 1B | $4,000 | 1B/OF | $4,900 | 1B | $9,600 |
| 2 | Francisco Lindor | SWITCH | 0.358 | 0.160 | 27.8% | 9.3% | 12.1% | 47.9% | SS | $4,000 | SS | $4,800 | SS | $9,300 |
| 3 | Michael Brantley | LEFT | 0.332 | 0.169 | 42.4% | 8.9% | 15.2% | 47.5% | OF | $4,100 | OF | $5,000 | LF | $9,600 |
| 4 | Edwin Encarnacion | RIGHT | 0.366 | 0.260 | 38.1% | 10.7% | 20.8% | 38.4% | 1B | $3,800 | 1B | $5,000 | 1B | $9,900 |
| 5 | Jose Ramirez | SWITCH | 0.364 | 0.170 | 25.7% | 7.4% | 9.5% | 38.4% | 3B | $4,000 | 2B/3B | $4,500 | IF/OF | $8,800 |
| 6 | Jason Kipnis | LEFT | 0.350 | 0.197 | 38.7% | 10.1% | 19.2% | 36.8% | 2B | $3,100 | 2B | $4,900 | 2B | $9,600 |
| 7 | Lonnie Chisenhall | LEFT | 0.340 | 0.169 | 28.0% | 5.1% | 15.7% | 34.7% | OF | $3,000 | OF | $3,600 | IF/OF | $7,200 |
| 8 | Abraham Almonte | SWITCH | 0.297 | 0.107 | 33.0% | 7.4% | 21.5% | 45.6% | OF | $2,700 | OF | $3,600 | RF | $7,200 |
| 9 | Yan Gomes | RIGHT | 0.187 | 0.134 | 29.9% | 3.1% | 26.4% | 40.8% | C | $2,500 | C | $3,300 | C | $6,600 |
Elite Plays – Jose Ramirez, Francisco Lindor, Michael Brantley, Edwin Encarnacion
Secondary Plays – Carlos Santana, Lonnie Chisenhall and Abraham Almonte
Stackability – GREEN – A viable full stack in cash games and GPPs.
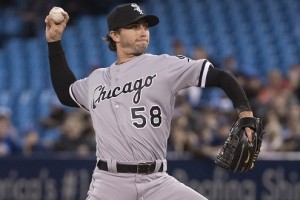
Chicago White Sox at Detroit – 1:10 PM ET
| Chicago White Sox | Detroit | ||||||||||
 | Miguel Gonzalez |  | Jordan Zimmermann | ||||||||
| RIGHT | RIGHT | ||||||||||
| Vegas Moneyline | Vegas Over/Under | ||||||||||
| DET-108 | 8.5 | ||||||||||
| Stats | wOBA | HC% | BB% | K% | GB% | Stats | wOBA | HC% | BB% | K% | GB% |
|---|---|---|---|---|---|---|---|---|---|---|---|
| SP vs. Left (2016-17) | 0.302 | 29.0% | 8.2% | 17.3% | 40.6% | SP vs. Left (2016-17) | 0.306 | 34.1% | 5.3% | 13.6% | 41.6% |
| SP vs. Right (2016-17) | 0.283 | 26.3% | 4.4% | 16.8% | 40.2% | SP vs. Right (2016-17) | 0.388 | 27.9% | 6.6% | 14.3% | 38.4% |
Pitcher Grind Down
| Miguel Gonzalez | |||||||||
 | FanDuel | DraftKings | FantasyDraft | ||||||
| Salary: | $7,100 | Salary: | $7,100 | Salary: | $14,000 | ||||
| Salary Rank: | 15 of 30 | Salary Rank: | 14 of 30 | Salary Rank: | 14 of 30 | ||||
| Stats | Starts | SIERA | ERA | K% | BB% | GB% | HC% | SC% | |
|---|---|---|---|---|---|---|---|---|---|
| 2016 | 23 | 4.61 | 3.73 | 16.8% | 6.2% | 40.1% | 28.6% | 18.1% | |
| 2017 | 4 | 4.31 | 2.00 | 18.5% | 7.4% | 41.8% | 22.5% | 20.0% | |
Despite the total of 8.5 in this game, I don’t hate the idea of using Miguel Gonzalez as an SP2. Through four starts this season, Gonzalez has an ERA of 2 while allowing hard contact at just 22.5%. The Tigers offense has a .330 wOBA against RH pitching this season but they’ll be without Miguel Cabrera today. Gonzalez has already handled the Royals, Yankees and Twins offenses this season. He really only pitched poorly against the Indians and we can’t blame him there.
Quick Breakdown: – My favorite SP2 today is Joe Ross. After Ross, there’s a group of options that can limit damage and possibly squeak out a decent score. Gonzalez is included in that group along with Mike Leake, Jason Hammel and Mike Foltynewicz. See, I told you pitching was kind of ugly after the top options.
| Jordan Zimmermann | |||||||||
 | FanDuel | DraftKings | FantasyDraft | ||||||
| Salary: | $7,700 | Salary: | $5,800 | Salary: | $11,400 | ||||
| Salary Rank: | 8 of 30 | Salary Rank: | 23 of 30 | Salary Rank: | 23 of 30 | ||||
| Stats | Starts | SIERA | ERA | K% | BB% | GB% | HC% | SC% | |
|---|---|---|---|---|---|---|---|---|---|
| 2016 | 18 | 4.81 | 4.87 | 14.7% | 5.8% | 43.1% | 27.3% | 18.5% | |
| 2017 | 4 | 5.61 | 6.35 | 11.0% | 7.0% | 25.6% | 47.5% | 13.8% | |
If Jordan Zimmerman were facing the White Sox two weeks ago, he might have been the top pitching option on the slate. Today, I’m a lot less sure about that. The White Sox own a .276 wOBA against RH pitching this season which is good for 29th in the league. They also strikeout at a 24.2% clip. The problem is they’ve been red-hot lately scoring at least six runs in every game as they’ve rattled off six straight wins.
Jordan Zimmerman has seen his K rate drop to 11% in four starts this season. He’s allowing 47.3% hard contact right now. Ignoring the fact that there’s likely something wrong here and firing up Zimmerman would be a very bold move. I’m not sure I’ve got the courage to do it. He’s been on the decline for a couple of years now.
Quick Breakdown: – A matchup with the White Sox isn’t near as enticing as it was two weeks ago. Jordan Zimmerman also isn’t the pitcher he was two years ago. He’ll draw some interest strictly based on name value but he’s going to need to prove it before he makes it back into any of my lineups.
Batter Grind Down
Chicago White Sox
With so many other premium hitting situations today I doubt I’ll be firing up a lot of White Sox bats. They’ve been on a hot streak the past couple of weeks but this wasn’t a very good offense prior to that. Zimmerman did allow a .306 wOBA to LH and a .308 wOBA to RH last season though. You certainly wouldn’t ‘t be wrong if you used Todd Frazier, Jose Abreu or Tim Anderson today.
Projected Lineup (Splits vs. RH Pitching)
| # | Player | Bats | wOBA | ISO | HC% | BB% | K% | GB% | FD Pos. | FD Sal. | DK Pos. | DK Sal. | FDRFT Pos. | FDRFT Sal. |
|---|---|---|---|---|---|---|---|---|---|---|---|---|---|---|
| 1 | Tim Anderson | RIGHT | 0.291 | 0.143 | 30.0% | 3.0% | 27.0% | 50.4% | SS | $2,900 | SS | $3,500 | SS | $6,900 |
| 2 | Tyler Saladino | RIGHT | 0.295 | 0.129 | 22.2% | 4.3% | 22.8% | 51.5% | 2B | $3,100 | 2B | $3,300 | 2B | $6,600 |
| 3 | Melky Cabrera | SWITCH | 0.332 | 0.149 | 28.1% | 7.9% | 10.2% | 43.8% | OF | $3,100 | OF | $3,900 | LF | $7,800 |
| 4 | Jose Abreu | RIGHT | 0.338 | 0.148 | 30.3% | 6.1% | 17.7% | 45.5% | 1B | $3,200 | 1B | $4,200 | 1B | $8,000 |
| 5 | Todd Frazier | RIGHT | 0.318 | 0.224 | 31.1% | 9.6% | 23.3% | 38.1% | 3B | $3,600 | 3B | $4,400 | 3B | $8,400 |
| 6 | Avisail Garcia | RIGHT | 0.324 | 0.151 | 30.8% | 7.0% | 25.9% | 52.9% | OF | $3,800 | OF | $3,200 | RF | $6,400 |
| 7 | Matt Davidson | RIGHT | 0.422 | 0.400 | 42.9% | 0.0% | 46.2% | 21.4% | 1B | $2,600 | 3B | $3,800 | 3B | $7,500 |
| 8 | Geovany Soto | RIGHT | 0.313 | 0.227 | 45.8% | 9.3% | 26.7% | 34.8% | C | $2,100 | C | $2,500 | C | $4,800 |
| 9 | Leury Garcia | SWITCH | 0.315 | 0.200 | 26.5% | 1.6% | 17.5% | 59.2% | OF | $2,800 | OF | $2,700 | 2B | $5,200 |
Elite Plays – Jose Abreu and tod Frazier
Secondary Plays -Tim Anderson
Stackability – ORANGE – A viable stack in large field GPPs.
Detroit
Based on the fact that I think you can use Miguel Gonzalez today, I wouldn’t say this is a premium spot for Tiger bats. Gonzalez did allow a .302 wOBA to LH batters last season though. If you go here, that’s who you want to target. The bad news is the Tigers don’t have much to offer there. Tyler Collins owns a .324 wOBA against RH pitching. You could also fire up Victor Martinez who hit a home run yesterday. He owns a .340 wOBA against RH pitching.
Projected Lineup (Splits vs. RH Pitching)
| # | Player | Bats | wOBA | ISO | HC% | BB% | K% | GB% | FD Pos. | FD Sal. | DK Pos. | DK Sal. | FDRFT Pos. | FDRFT Sal. |
|---|---|---|---|---|---|---|---|---|---|---|---|---|---|---|
| 1 | Ian Kinsler | RIGHT | 0.350 | 0.181 | 34.8% | 7.2% | 17.0% | 33.8% | 2B | $3,300 | 2B | $4,400 | 2B | $8,700 |
| 2 | Tyler Collins | LEFT | 0.324 | 0.152 | 34.5% | 7.0% | 25.0% | 34.5% | OF | $2,600 | OF | $2,700 | CF | $5,400 |
| 3 | Nick Castellanos | RIGHT | 0.371 | 0.215 | 39.5% | 7.5% | 24.5% | 32.2% | 3B | $3,200 | 3B | $3,700 | 3B | $7,200 |
| 4 | Victor Martinez | SWITCH | 0.340 | 0.179 | 40.5% | 8.0% | 15.2% | 37.4% | C | $2,800 | 1B | $3,600 | 1B | $7,200 |
| 5 | Justin Upton | RIGHT | 0.343 | 0.234 | 39.0% | 8.9% | 28.0% | 40.3% | OF | $3,400 | OF | $4,200 | LF | $8,100 |
| 6 | Alex Avila | LEFT | 0.361 | 0.218 | 40.8% | 17.5% | 36.3% | 42.9% | C | $2,600 | 1B/C | $2,900 | C | $5,600 |
| 7 | Jim Adduci | LEFT | 0.749 | 0.444 | 62.5% | 0.0% | 11.1% | 75.0% | OF | $2,500 | LF | $4,800 | ||
| 8 | James McCann | RIGHT | 0.234 | 0.082 | 29.4% | 6.1% | 27.2% | 42.5% | C | $2,400 | C | $2,800 | C | $5,400 |
| 9 | Jose Iglesias | RIGHT | 0.277 | 0.062 | 14.7% | 5.2% | 10.9% | 55.2% | SS | $2,300 | SS | $2,600 | SS | $5,200 |