MLB Grind Down: Sunday, August 12th

Jump to Page 1 2 3
The RotoGrinders MLB Grind Down will give you an in-depth analysis into the upcoming MLB schedule. This article will break down the numbers for every single game and give you analysis on which trends you can exploit. While matchups are a major factor in daily fantasy baseball, there are plenty of other factors to consider such as injuries, weather, and salaries.
The analysis should point you in the right direction, but it is still up to you to decipher the information and make your own selections. No sport has more variance than baseball. The best choice is not always the right choice but following the trends will win you money over time.
Note: As always, if you want to try a new DFS site, be sure to click through a RotoGrinders link and use our DraftKings promo code, FanDuel promo code, and FantasyDraft promo code to receive the best perks in the industry.
Stackability Rating System:
GREEN – A viable full stack in cash games and GPPs.
YELLOW – A viable mini-stack in cash games and full stack in GPPs.
ORANGE – A viable stack in large field GPPs.
RED – Not a recommended stack for cash games or GPPs.
Implied Run Totals
Ballpark Ratings
Boston at Baltimore – 1:05 PM ET
| Boston | Baltimore | ||||||||||||||
 | Chris Sale |  | Alex Cobb | ||||||||||||
| LEFT | RIGHT | ||||||||||||||
| Vegas Moneyline | Vegas Over/Under | ||||||||||||||
| BOS-290 | 8.5 | ||||||||||||||
| Stats | wOBA | xwOBA | HC% | HR/9 | K% | GB% | Stats | wOBA | xwOBA | HC% | HR/9 | K% | GB% | ||
|---|---|---|---|---|---|---|---|---|---|---|---|---|---|---|---|
| SP vs. Left (2016-17) | 0.196 | 0.196 | 18.9% | 0.00 | 38.8% | 51.0% | SP vs. Left (2016-17) | 0.362 | 0.349 | 33.5% | 1.23 | 17.6% | 42.6% | ||
| SP vs. Right (2016-17) | 0.245 | 0.247 | 27.2% | 0.78 | 37.4% | 44.0% | SP vs. Right (2016-17) | 0.357 | 0.346 | 31.0% | 1.55 | 12.4% | 56.6% | ||
Pitcher Grind Down
| Chris Sale | |||||||||||
 | FanDuel | DraftKings | FantasyDraft | ||||||||
| Salary: | $12,800 | Salary: | $12,500 | Salary: | $23,900 | ||||||
| Salary Rank: | 1 of 30 | Salary Rank: | 1 of 30 | Salary Rank: | 1 of 30 | ||||||
| Stats | Starts | SIERA | ERA | K% | BB% | GB% | HC% | SC% | aFV | SwS% | |
|---|---|---|---|---|---|---|---|---|---|---|---|
| 2017 | 32 | 2.58 | 2.90 | 36.2% | 5.1% | 38.7% | 29.7% | 18.5% | 94.4 | 14.9% | |
| 2018 | 22 | 2.36 | 2.04 | 37.6% | 6.0% | 45.2% | 25.8% | 28.8% | 94.8 | 15.8% | |
| L14 | 1 | 2.23 | 0.00 | 41.7% | 8.3% | 54.5% | 0.0% | 36.4% | 96.9 | 13.0% | |
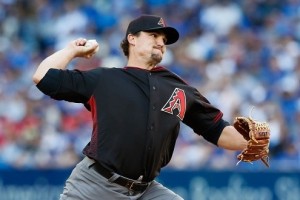
Sale headlines all starting pitchers on Sunday. He’s coming off the disabled list due to shoulder inflammation and his bullpen session on Thursday went well according to reports. The only caveat that I’ve found regarding Sale is by Red Sox beat writer Pete Abraham who tweeted here the following on Saturday:
“Meanwhile Sale will be held at 85 or so tomorrow.”
So the question becomes, do we pay the price for Sale if he is indeed expected to go around 85 pitches? My current lean is that minimal exposure to Sale makes some sense in tournaments because he could still destroy this Orioles team in 85 pitches, but it makes sense to pivot to someone “safer” in cash games. It’s weird to not consider Sale “safe”, but the potential pitch limit and the fact he’s coming off shoulder inflammation is reason enough for me to be a little cautious in his first start off the DL.
Quick Breakdown: Beat writer Pete Abraham reported Sale will be held at “85 or so” pitches. I’m okay with limited tournament exposure to Sale in the event Sale gets a longer leash than reported, but I feel like the safer play is to look elsewhere in cash games and even tournaments. Keep an eye out on Sunday morning whether there are updates to his expected pitch count.
| Alex Cobb | |||||||||||
 | FanDuel | DraftKings | FantasyDraft | ||||||||
| Salary: | $6,700 | Salary: | $4,200 | Salary: | $8,600 | ||||||
| Salary Rank: | 20 of 30 | Salary Rank: | 24 of 30 | Salary Rank: | 24 of 30 | ||||||
| Stats | Starts | SIERA | ERA | K% | BB% | GB% | HC% | SC% | aFV | SwS% | |
|---|---|---|---|---|---|---|---|---|---|---|---|
| 2017 | 29 | 4.48 | 3.66 | 17.3% | 5.9% | 47.8% | 36.9% | 14.9% | 91.7 | 6.7% | |
| 2018 | 21 | 4.58 | 5.55 | 15.0% | 6.0% | 50.0% | 32.2% | 21.4% | 91.9 | 7.4% | |
| L14 | 3 | 4.29 | 2.37 | 14.1% | 3.9% | 54.0% | 25.0% | 32.8% | 91.6 | 9.2% | |
The Red Sox have the lowest K% and the highest team ISO against righties. Alex Cobb has struggled against both sides of the plate and the Red Sox offense is on fire right now. These two teams did play a double-header on Saturday and it was also reported by beat writer Pete Abraham here that Xander Bogaerts may have gotten an x-ray after the night game for an unknown reason, so we may get a watered-down version of this lineup on Sunday. Cobb’s near-minimum price of $4,200 is somewhat interesting in the event several starters rest on Sunday, but that’s a route I don’t envision myself taking.
Quick Breakdown: Cobb faces the toughest team in baseball against right-handed pitching. His near-minimum price on DraftKings is somewhat interesting if the Red Sox rest several starters, but it still feels too risky to roster Cobb in this spot.
Batter Grind Down
Boston
Projected Lineup (Splits vs. RH Pitching)
| # | Player | Bats | xwOBA | ISO | HC% | BB% | K% | GB% | FD Pos. | FD Sal. | DK Pos. | DK Sal. | FDRFT Pos. | FDRFT Sal. |
|---|---|---|---|---|---|---|---|---|---|---|---|---|---|---|
| 1 | Mookie Betts | RIGHT | 0.464 | 0.282 | 45.7% | 10.9% | 13.6% | 34.2% | OF | $5,300 | OF | $6,000 | RF | $11,200 |
| 2 | Andrew Benintendi | LEFT | 0.415 | 0.214 | 31.3% | 13.6% | 13.6% | 37.9% | OF | $4,300 | OF | $5,700 | LF | $10,300 |
| 3 | Mitch Moreland | LEFT | 0.422 | 0.237 | 35.8% | 10.9% | 19.8% | 41.0% | 1B | $3,300 | 1B | $4,800 | 1B | $8,800 |
| 4 | J.D. Martinez | RIGHT | 0.463 | 0.363 | 46.7% | 9.9% | 22.0% | 44.7% | OF | $5,200 | OF | $5,900 | RF | $11,100 |
| 5 | Xander Bogaerts | RIGHT | 0.383 | 0.255 | 38.5% | 6.9% | 17.6% | 47.6% | SS | $3,900 | SS | $5,000 | SS | $9,500 |
| 6 | Rafael Devers | LEFT | 0.334 | 0.215 | 36.6% | 7.8% | 23.7% | 44.0% | 3B | $3,200 | 3B | $4,200 | 3B | $8,200 |
| 7 | Brock Holt | LEFT | 0.324 | 0.096 | 27.7% | 8.0% | 14.6% | 53.5% | 2B | $2,300 | 2B/SS | $3,900 | 2B | $7,600 |
| 8 | Sandy Leon | SWITCH | 0.278 | 0.117 | 30.2% | 3.9% | 25.8% | 43.1% | C | $2,300 | C | $3,200 | C | $6,700 |
| 9 | Jackie Bradley | LEFT | 0.378 | 0.178 | 40.1% | 10.1% | 23.6% | 40.8% | OF | $2,500 | OF | $4,200 | CF | $8,100 |
| Team Averages | 0.385 | 0.217 | 37.0% | 9.1% | 19.4% | 43.0% |
Assuming the Red Sox play their normal lineup and don’t rest their starters, I have a lot of interest in their core group of Mookie Betts, J.D. Martinez and Andrew Benintendi. Cobb is allowing both sides of the plate to hit .300+ against him, so a full stack is definitely in play. Mitch Moreland and Xander Bogaerts (if he’s fine after his reported x-ray) would round out my stack, but if I ran out multiple Red Sox stacks on Sunday, I would include some with Jackie Bradley Jr. (who crushed two homers on Sunday) and Eduardo Nunez (who crushed one too) as ways to differentiate my stack and get exposure to the bottom of this potent lineup.
Elite Plays – Andrew Benintendi, Mookie Betts, J.D. Martinez
Secondary Plays – Xander Bogaerts, Jackie Bradley Jr., Rafael Devers, Mitch Moreland, Eduardo Nunez
Stackability – GREEN
Baltimore
Projected Lineup (Splits vs. LH Pitching)
| # | Player | Bats | xwOBA | ISO | HC% | BB% | K% | GB% | FD Pos. | FD Sal. | DK Pos. | DK Sal. | FDRFT Pos. | FDRFT Sal. |
|---|---|---|---|---|---|---|---|---|---|---|---|---|---|---|
| 1 | Jonathan Villar | SWITCH | 0.379 | 0.293 | 52.4% | 6.5% | 25.8% | 54.8% | 2B | $2,700 | 2B | $3,300 | 2B | $6,700 |
| 2 | Tim Beckham | RIGHT | 0.312 | 0.179 | 38.5% | 12.5% | 26.6% | 42.1% | SS | $3,500 | 3B/SS | $3,500 | SS | $6,300 |
| 3 | Adam Jones | RIGHT | 0.317 | 0.074 | 29.7% | 2.4% | 8.8% | 39.4% | OF | $3,000 | OF | $3,400 | CF | $6,900 |
| 4 | Mark Trumbo | RIGHT | 0.351 | 0.207 | 35.8% | 6.4% | 21.3% | 52.2% | OF | $3,400 | OF | $4,000 | DH | $7,300 |
| 5 | Trey Mancini | RIGHT | 0.288 | 0.107 | 24.4% | 6.8% | 24.1% | 67.8% | OF | $2,900 | 1B/OF | $3,200 | IF/OF | $6,400 |
| 6 | Chris Davis | LEFT | 0.281 | 0.167 | 38.6% | 8.8% | 34.3% | 38.6% | 1B | $2,200 | 1B | $2,900 | IF/OF | $5,900 |
| 7 | Renato Nunez | RIGHT | 0.279 | 0.097 | 25.0% | 5.7% | 34.3% | 30.0% | 3B | $2,400 | 3B | $3,500 | IF/OF | $6,300 |
| 8 | Caleb Joseph | RIGHT | 0.268 | 0.072 | 18.9% | 4.1% | 21.9% | 37.7% | C | $2,400 | C | $2,700 | C | $5,500 |
| 9 | Cedric Mullins | OF | $2,000 | OF | $3,800 | CF | $7,600 | |||||||
| Team Averages | 0.309 | 0.150 | 32.9% | 6.7% | 24.6% | 45.3% |
Chris Sale has been so elite this season and is holding opponents to a .179 average. He has a scary 207 strikeouts in just 141 innings, and I want no part in trying to pick on him. It’s possible Sale comes out a bit rusty, but I’m not going to tempt fate and try to play Orioles. I will note that if Sale is limited to 85 pitches, the Orioles will at least get an at-bat or two against this Red Sox bullpen that just came off a double-header, but that’s still not enough for me to try and target their hitters.
Elite Plays – None
Secondary Plays – None
Stackability – RED
Texas at NY Yankees – 1:05 PM ET
| Texas | NY Yankees | ||||||||||||||
 | Martin Perez |  | CC Sabathia | ||||||||||||
| LEFT | LEFT | ||||||||||||||
| Vegas Moneyline | Vegas Over/Under | ||||||||||||||
| NYY-225 | 9.5 | ||||||||||||||
| Stats | wOBA | xwOBA | HC% | HR/9 | K% | GB% | Stats | wOBA | xwOBA | HC% | HR/9 | K% | GB% | ||
|---|---|---|---|---|---|---|---|---|---|---|---|---|---|---|---|
| SP vs. Left (2016-17) | 0.347 | 0.261 | 29.3% | 0.73 | 12.2% | 62.5% | SP vs. Left (2016-17) | 0.308 | 0.283 | 18.5% | 1.29 | 22.3% | 51.9% | ||
| SP vs. Right (2016-17) | 0.431 | 0.398 | 45.1% | 2.23 | 13.3% | 46.7% | SP vs. Right (2016-17) | 0.323 | 0.315 | 31.3% | 1.27 | 19.5% | 41.6% | ||
Pitcher Grind Down
| Martin Perez | |||||||||||
 | FanDuel | DraftKings | FantasyDraft | ||||||||
| Salary: | $5,800 | Salary: | $4,600 | Salary: | $9,000 | ||||||
| Salary Rank: | 26 of 30 | Salary Rank: | 21 of 30 | Salary Rank: | 21 of 30 | ||||||
| Stats | Starts | SIERA | ERA | K% | BB% | GB% | HC% | SC% | aFV | SwS% | |
|---|---|---|---|---|---|---|---|---|---|---|---|
| 2017 | 32 | 5.04 | 4.82 | 14.2% | 7.8% | 47.3% | 33.3% | 15.2% | 93.1 | 7.3% | |
| 2018 | 10 | 5.19 | 6.15 | 13.1% | 9.1% | 50.0% | 41.8% | 16.0% | 92.2 | 6.3% | |
| L14 | 2 | 4.70 | 3.00 | 14.3% | 7.1% | 53.5% | 31.8% | 22.7% | 92.1 | 8.9% | |
Perez has been awful this season, allowing a 41.8% hard hit rate and a .354 batting average to opponents. The Yankees lead the majors in team wRC+ at 123 and team ISO at .220 against lefties (to put this in context, the next closest team is the Rockies with a .190 team ISO). This is too dangerous of a spot to consider Martin Perez and there’s a reason why the Yankees have one of the highest implied team totals on this slate.
Quick Breakdown: Perez has struggled all season and now faces the best team in baseball against left-handed pitching. Perez is not on my radar.
| CC Sabathia | |||||||||||
 | FanDuel | DraftKings | FantasyDraft | ||||||||
| Salary: | $7,600 | Salary: | $7,700 | Salary: | $15,500 | ||||||
| Salary Rank: | 12 of 30 | Salary Rank: | 9 of 30 | Salary Rank: | 9 of 30 | ||||||
| Stats | Starts | SIERA | ERA | K% | BB% | GB% | HC% | SC% | aFV | SwS% | |
|---|---|---|---|---|---|---|---|---|---|---|---|
| 2017 | 27 | 4.45 | 3.69 | 19.3% | 8.0% | 49.9% | 27.2% | 24.1% | 90.9 | 8.9% | |
| 2018 | 21 | 4.35 | 3.49 | 20.0% | 7.7% | 43.2% | 29.3% | 25.9% | 90.4 | 10.6% | |
| L14 | 3 | 3.71 | 3.38 | 34.4% | 14.1% | 22.6% | 25.0% | 34.4% | 91.0 | 13.1% | |
Sabathia turned back the clock in his last outing against the woeful White Sox and fanned 12 batters over 103 pitches. Sabathia continues to impress this season and remains a useful part of this rotation. He gets by with a 43.2% ground ball rate and generating 25.9% soft contact. He only has a 20.0 K% but the Rangers do have a 23.3 K% against lefties this season, which is the seventh highest in the majors. Many of their best power hitters are also left-handed, so he’s going to hold the platoon-advantage against them. Given his recent form and the positive matchup, I can see Sabathia being viable as an SP2 on this slate.
Quick Breakdown: Sabathia’s ability to limit hard contact and generate ground balls is appealing in this matchup against a Rangers team who can strikeout against lefties. Sabathia is on my list of SP2 options.
Batter Grind Down
Texas
Projected Lineup (Splits vs. LH Pitching)
| # | Player | Bats | xwOBA | ISO | HC% | BB% | K% | GB% | FD Pos. | FD Sal. | DK Pos. | DK Sal. | FDRFT Pos. | FDRFT Sal. |
|---|---|---|---|---|---|---|---|---|---|---|---|---|---|---|
| 1 | Shin-Soo Choo | LEFT | 0.342 | 0.115 | 38.8% | 11.9% | 25.9% | 49.4% | OF | $3,600 | OF | $4,600 | RF | $8,900 |
| 2 | Rougned Odor | LEFT | 0.286 | 0.158 | 41.7% | 8.9% | 22.3% | 44.4% | 2B | $4,100 | 2B | $4,900 | 2B | $8,900 |
| 3 | Elvis Andrus | RIGHT | 0.345 | 0.164 | 34.5% | 6.2% | 4.6% | 48.3% | SS | $3,500 | SS | $4,400 | SS | $8,300 |
| 4 | Adrian Beltre | RIGHT | 0.341 | 0.062 | 46.9% | 8.7% | 20.7% | 45.3% | 3B | $3,100 | 3B | $4,000 | 3B | $7,500 |
| 5 | Jurickson Profar | SWITCH | 0.332 | 0.202 | 32.6% | 11.0% | 10.2% | 39.1% | 1B | $3,800 | 3B/SS | $4,700 | SS | $9,300 |
| 6 | Joey Gallo | LEFT | 0.339 | 0.370 | 43.1% | 9.1% | 41.3% | 24.1% | OF | $3,600 | 1B/OF | $4,500 | 1B | $9,400 |
| 7 | Robinson Chirinos | RIGHT | 0.338 | 0.254 | 47.4% | 14.5% | 34.2% | 34.2% | C | $3,000 | C | $4,300 | C | $8,300 |
| 8 | Willie Calhoun | LEFT | 0.306 | 0.105 | 31.3% | 0.0% | 19.0% | 31.3% | OF | $2,600 | OF | $3,800 | IF/OF | $7,700 |
| 9 | Delino DeShields | RIGHT | 0.276 | 0.090 | 30.3% | 12.5% | 13.5% | 51.5% | OF | $2,000 | OF | $3,500 | CF | $6,700 |
| Team Averages | 0.323 | 0.169 | 38.5% | 9.2% | 21.3% | 40.8% |
You want to attack Sabathia with right-handed batters as he’s been fantastic against lefties this season. Elvis Andrus, Adrian Beltre and Robinson Chirinos profile as the best options. The lefties like Rougned Odor, Shin-Soo Choo and Joey Gallo will likely see depressed ownership because of the lefty-on-lefty matchup and they still can smack one out at any time, but they are more tournament darts, especially with a strong Yankees bullpen behind Sabathia. I’m unlikely to roll out a Rangers stack and more likely to use the Rangers’ bats as final one-offs if they happen to fill a spot on my lineups.
Elite Plays – None
Secondary Plays – Elvis Andrus, Adrian Beltre, Robinson Chirinos
Stackability – RED / ORANGE
NY Yankees
Projected Lineup (Splits vs. LH Pitching)
| # | Player | Bats | xwOBA | ISO | HC% | BB% | K% | GB% | FD Pos. | FD Sal. | DK Pos. | DK Sal. | FDRFT Pos. | FDRFT Sal. |
|---|---|---|---|---|---|---|---|---|---|---|---|---|---|---|
| 1 | Aaron Hicks | SWITCH | 0.425 | 0.337 | 52.1% | 13.0% | 20.4% | 35.7% | OF | $4,400 | OF | $4,700 | CF | $9,000 |
| 2 | Giancarlo Stanton | RIGHT | 0.464 | 0.352 | 59.7% | 10.8% | 25.0% | 37.7% | OF | $4,900 | OF | $5,400 | RF | $10,300 |
| 3 | Didi Gregorius | LEFT | 0.293 | 0.158 | 28.3% | 7.9% | 13.4% | 45.3% | SS | $4,200 | SS | $4,800 | SS | $9,100 |
| 4 | Gleyber Torres | RIGHT | 0.405 | 0.278 | 51.0% | 11.0% | 26.8% | 31.4% | 2B | $4,100 | 2B | $4,600 | 2B | $9,200 |
| 5 | Miguel Andujar | RIGHT | 0.317 | 0.245 | 34.1% | 5.3% | 19.3% | 43.5% | 3B | $4,000 | 3B | $4,500 | 3B | $9,400 |
| 6 | Luke Voit | RIGHT | 0.402 | 0.231 | 50.0% | 7.1% | 21.4% | 50.0% | 1B | $2,000 | 1B | $3,700 | 1B | $7,600 |
| 7 | Brett Gardner | LEFT | 0.292 | 0.076 | 20.8% | 11.4% | 20.0% | 54.4% | OF | $3,600 | OF | $4,200 | LF | $8,400 |
| 8 | Austin Romine | RIGHT | 0.277 | 0.178 | 29.4% | 4.3% | 23.4% | 41.2% | C | $2,600 | C | $3,500 | C | $6,600 |
| 9 | Shane Robinson | RIGHT | 0.224 | 0.000 | 25.0% | 16.7% | 16.7% | 0.0% | OF | $2,500 | OF | $2,800 | CF | $5,900 |
| Team Averages | 0.344 | 0.206 | 38.9% | 9.7% | 20.7% | 37.7% |
Whenever a lefty is on the mound, Giancarlo Stanton becomes a near must-play. I think he’s someone you have to lock in for cash games, and I’m fine with heavy exposure in tournaments as well knowing the industry is going to be high on him. Aaron Hicks, Gleyber Torres and Miguel Andujar will all hold the platoon-advantage and are fine plays as well. If you want to differentiate your Yankees stacks, I’m also fine with some exposure to the bottom of the lineup via Luke Voit and Austin Romine. It’s worth noting that Perez has struggled against left-handed batters too, so I would not just ignore Didi Gregorius and Brett Gardner. They fall behind the righties at the top of the order for me, but I would still want exposure to them in tournaments in my Yankees stacks.
Elite Plays – Aaron Hicks, Giancarlo Stanton, Gleyber Torres
Secondary Plays – Miguel Andujar, Brett Gardner (GPP), Didi Gregorius (GPP), Luke Voit
Stackability – GREEN
Tampa Bay at Toronto – 1:07 PM ET
| Tampa Bay | Toronto | ||||||||||||||
 | Tyler Glasnow |  | Marcus Stroman | ||||||||||||
| RIGHT | RIGHT | ||||||||||||||
| Vegas Moneyline | Vegas Over/Under | ||||||||||||||
| TOR-130 | 8.0 | ||||||||||||||
| Stats | wOBA | xwOBA | HC% | HR/9 | K% | GB% | Stats | wOBA | xwOBA | HC% | HR/9 | K% | GB% | ||
|---|---|---|---|---|---|---|---|---|---|---|---|---|---|---|---|
| SP vs. Left (2016-17) | 0.342 | 0.308 | 19.4% | 1.35 | 29.0% | 58.5% | SP vs. Left (2016-17) | 0.320 | 0.357 | 37.2% | 0.60 | 16.6% | 63.3% | ||
| SP vs. Right (2016-17) | 0.273 | 0.289 | 35.4% | 0.74 | 34.7% | 54.4% | SP vs. Right (2016-17) | 0.319 | 0.307 | 31.7% | 0.96 | 19.8% | 62.1% | ||
Pitcher Grind Down
| Tyler Glasnow | |||||||||||
 | FanDuel | DraftKings | FantasyDraft | ||||||||
| Salary: | $5,900 | Salary: | $8,300 | Salary: | $15,900 | ||||||
| Salary Rank: | 25 of 30 | Salary Rank: | 7 of 30 | Salary Rank: | 8 of 30 | ||||||
| Stats | Starts | SIERA | ERA | K% | BB% | GB% | HC% | SC% | aFV | SwS% | |
|---|---|---|---|---|---|---|---|---|---|---|---|
| 2017 | 13 | 5.62 | 7.69 | 18.4% | 14.4% | 43.2% | 31.5% | 20.2% | 94.6 | 8.3% | |
| 2018 | 2 | 3.28 | 4.14 | 32.1% | 13.1% | 56.3% | 28.1% | 13.0% | 96.7 | 12.1% | |
| L14 | 2 | 2.76 | 1.80 | 39.5% | 13.2% | 66.7% | 38.9% | 16.7% | 97.1 | 13.3% | |
Glasnow has been so filthy since his trade to the Rays. He’s only thrown a combined seven innings over his last two starts as the Rays continue to stretch him out, but he’s fanned 14 batters in that timeframe. He’s thrown 48 and 61 pitches in his two starts so it’s clear the Rays are trying to slowly ramp him up. I haven’t found a reported pitch count for today’s start but if I had to guess, maybe he gets to 75-80 pitches if he doesn’t get into trouble? His price has risen way up to the point where I can’t use him unless he’s going to get a normal starter’s workload, but he’s someone I’m keeping my eye on down the stretch.
Quick Breakdown: Glasnow has been fantastic as the Rays stretch him out but he hasn’t thrown more than 61 pitches and his potential limited pitch count makes it hard to pay up for him.
| Marcus Stroman | |||||||||||
 | FanDuel | DraftKings | FantasyDraft | ||||||||
| Salary: | $7,600 | Salary: | $7,000 | Salary: | $14,000 | ||||||
| Salary Rank: | 12 of 30 | Salary Rank: | 13 of 30 | Salary Rank: | 12 of 30 | ||||||
| Stats | Starts | SIERA | ERA | K% | BB% | GB% | HC% | SC% | aFV | SwS% | |
|---|---|---|---|---|---|---|---|---|---|---|---|
| 2017 | 33 | 3.85 | 3.09 | 19.7% | 7.4% | 62.1% | 31.4% | 20.4% | 93.3 | 10.0% | |
| 2018 | 16 | 3.94 | 5.20 | 18.2% | 8.3% | 62.7% | 34.5% | 21.7% | 92.4 | 9.4% | |
| L14 | 3 | 3.51 | 4.34 | 16.7% | 6.4% | 66.7% | 16.7% | 26.7% | 92.6 | 8.2% | |
Stroman left his last start on Tuesday against the Red Sox after 92 pitches due to a blister. He’s been cleared to make this start on Sunday but I’m also a bit cautious of blister injuries because they can pop back up at any moment. We also aren’t getting any discount on Stroman and this is a fairly neutral matchup. The Rays rank 15th in K% at just 22.1% against righties and have a team wRC+ of 98. There’s nothing special about this matchup that makes me want to take the risk on Stroman.
Quick Breakdown: Stroman says he’s fine despite his blister injury but the price and matchup aren’t appealing enough for me to take a chance on him.
Batter Grind Down
Tampa Bay
Projected Lineup (Splits vs. RH Pitching)
| # | Player | Bats | xwOBA | ISO | HC% | BB% | K% | GB% | FD Pos. | FD Sal. | DK Pos. | DK Sal. | FDRFT Pos. | FDRFT Sal. |
|---|---|---|---|---|---|---|---|---|---|---|---|---|---|---|
| 1 | Mallex Smith | LEFT | 0.295 | 0.123 | 29.8% | 8.9% | 18.4% | 46.2% | OF | $3,500 | OF | $4,900 | CF | $9,000 |
| 2 | Matt Duffy | RIGHT | 0.310 | 0.083 | 28.0% | 5.4% | 15.2% | 52.6% | 3B | $3,100 | 3B | $4,000 | 3B | $7,500 |
| 3 | Jake Bauers | LEFT | 0.373 | 0.248 | 45.2% | 14.9% | 24.1% | 42.3% | 1B | $3,600 | 1B/OF | $4,200 | 1B | $8,000 |
| 4 | Joey Wendle | LEFT | 0.321 | 0.124 | 35.8% | 6.1% | 19.2% | 46.7% | 2B | $3,000 | 2B/OF | $4,000 | 2B | $7,400 |
| 5 | Ji-Man Choi | LEFT | 0.351 | 0.188 | 45.5% | 9.1% | 33.8% | 40.9% | 1B | $2,600 | 1B | $3,600 | IF/OF | $7,700 |
| 6 | Kevin Kiermaier | LEFT | 0.265 | 0.104 | 32.0% | 8.1% | 26.3% | 51.5% | OF | $2,500 | OF | $3,600 | CF | $7,400 |
| 7 | Brandon Lowe | LEFT | 0.145 | 0.000 | 0.0% | 16.7% | 16.7% | 25.0% | 2B | $2,200 | 2B/OF | $2,900 | 2B | $5,500 |
| 8 | Willy Adames | RIGHT | 0.278 | 0.127 | 26.0% | 7.2% | 27.0% | 43.1% | SS | $2,600 | 2B/SS | $3,900 | SS | $7,600 |
| 9 | Michael Perez | LEFT | 0.330 | 0.043 | 35.0% | 7.7% | 15.4% | 30.0% | C | $2,100 | C | $3,000 | C | $5,400 |
| Team Averages | 0.296 | 0.116 | 30.8% | 9.3% | 21.8% | 42.0% |
While I don’t plan on playing Stroman, I also don’t want to pick on him. Stroman is a massive groundball pitcher, generating groundballs 62.7% of the time. He also has a low 0.79 HR/9 ratio so he’s not home run prone either. Jakob Bauers, Ji-Man Choi and Kevin Kiermaier could offer some one-off power, but this isn’t a team or a spot I want heavy exposure to. The Rays might be one of those teams I cross off my list so I can focus on better game environments.
Elite Plays – None
Secondary Plays – Jakob Bauers (GPP), Ji-Man Choi (GPP), Kevin Kiermaier (GPP)
Stackability – RED
Toronto
Projected Lineup (Splits vs. RH Pitching)
| # | Player | Bats | xwOBA | ISO | HC% | BB% | K% | GB% | FD Pos. | FD Sal. | DK Pos. | DK Sal. | FDRFT Pos. | FDRFT Sal. |
|---|---|---|---|---|---|---|---|---|---|---|---|---|---|---|
| 1 | Curtis Granderson | LEFT | 0.344 | 0.190 | 37.1% | 12.0% | 27.5% | 33.7% | OF | $3,100 | OF | $4,000 | RF | $7,200 |
| 2 | Devon Travis | RIGHT | 0.294 | 0.114 | 26.8% | 6.0% | 21.9% | 56.7% | 2B | $2,700 | 2B | $3,600 | 2B | $7,500 |
| 3 | Justin Smoak | SWITCH | 0.413 | 0.267 | 38.2% | 16.0% | 25.6% | 31.8% | 1B | $3,900 | 1B | $4,200 | 1B | $8,000 |
| 4 | Randal Grichuk | RIGHT | 0.358 | 0.268 | 37.0% | 6.0% | 22.9% | 38.4% | OF | $3,300 | OF | $4,300 | RF | $8,200 |
| 5 | Kendrys Morales | SWITCH | 0.430 | 0.202 | 45.4% | 11.6% | 20.9% | 42.1% | 1B | $2,700 | 1B | $3,400 | 1B | $6,900 |
| 6 | Russell Martin | RIGHT | 0.322 | 0.165 | 30.2% | 16.0% | 23.5% | 49.2% | C | $2,500 | C | $3,900 | C | $7,400 |
| 7 | Aledmys Diaz | RIGHT | 0.358 | 0.197 | 34.3% | 3.4% | 10.6% | 43.3% | SS | $3,100 | SS | $4,100 | SS | $8,500 |
| 8 | Kevin Pillar | RIGHT | 0.329 | 0.169 | 34.2% | 3.8% | 20.4% | 37.9% | OF | $2,500 | OF | $3,800 | CF | $7,600 |
| 9 | Luke Maile | RIGHT | 0.267 | 0.075 | 28.6% | 10.3% | 32.4% | 53.2% | C | $2,500 | C | $2,800 | C | $5,500 |
| Team Averages | 0.346 | 0.183 | 34.6% | 9.5% | 22.9% | 42.9% |
Lefties have had more success against Glasnow and he has allowed home runs in back-to-back starts. Curtis Granderson, Justin Smoak and the now-hot Aledmys Diaz are the most interesting options on the Blue Jays. It’s worth noting that Yangervis Solarte hurt his oblique on Saturday and could be looking at a DL stint, which would hurt their lineup. I’ve been impressed enough with Glasnow in his first two starts that I don’t feel great about trying to target batters against him. This is most likely a spot where I’ll pass on rostering Glasnow because of the pitch count, but I won’t go out of my way to roster Blue Jays bats against him either because of how dominant he’s been at times.
Elite Plays – None
Secondary Plays – Aledmys Diaz, Curtis Granderson, Justin Smoak
Stackability – ORANGE
Arizona at Cincinnati – 1:10 PM ET
| Arizona | Cincinnati | ||||||||||||||
 | Zack Godley |  | Luis Castillo | ||||||||||||
| RIGHT | RIGHT | ||||||||||||||
| Vegas Moneyline | Vegas Over/Under | ||||||||||||||
| ARI-105 | 9.0 | ||||||||||||||
| Stats | wOBA | xwOBA | HC% | HR/9 | K% | GB% | Stats | wOBA | xwOBA | HC% | HR/9 | K% | GB% | ||
|---|---|---|---|---|---|---|---|---|---|---|---|---|---|---|---|
| SP vs. Left (2016-17) | 0.333 | 0.346 | 34.2% | 0.71 | 21.0% | 57.1% | SP vs. Left (2016-17) | 0.382 | 0.379 | 43.2% | 1.94 | 21.2% | 39.3% | ||
| SP vs. Right (2016-17) | 0.307 | 0.343 | 37.9% | 0.94 | 26.5% | 43.9% | SP vs. Right (2016-17) | 0.280 | 0.322 | 34.2% | 1.10 | 22.7% | 49.2% | ||
Pitcher Grind Down
| Zack Godley | |||||||||||
 | FanDuel | DraftKings | FantasyDraft | ||||||||
| Salary: | $8,800 | Salary: | $8,700 | Salary: | $17,100 | ||||||
| Salary Rank: | 8 of 30 | Salary Rank: | 5 of 30 | Salary Rank: | 5 of 30 | ||||||
| Stats | Starts | SIERA | ERA | K% | BB% | GB% | HC% | SC% | aFV | SwS% | |
|---|---|---|---|---|---|---|---|---|---|---|---|
| 2017 | 25 | 3.67 | 3.37 | 26.3% | 8.5% | 55.3% | 32.2% | 18.6% | 91.9 | 13.3% | |
| 2018 | 23 | 4.12 | 4.35 | 23.7% | 10.4% | 50.5% | 36.0% | 21.8% | 90.1 | 12.0% | |
| L14 | 3 | 2.85 | 2.70 | 28.8% | 3.8% | 46.9% | 31.4% | 23.5% | 90.8 | 13.3% | |
After a few rough outings in early June, Godley has been fantastic as of late. He hasn’t allowed a homer in eight straight games and has only issued one walk in six of his last seven games. This isn’t a strikeout-friendly matchup as the Reds rank just 20th in K% against righties and the ballpark scares me, but Godley’s recent form is hard to ignore. His matchup would also be enhanced if Joey Votto missed another game, as he was held out on Saturday due to his knee soreness.
Quick Breakdown: I am considering Godley in all formats due to his recent form. The potential absence of Joey Votto would be even better for Godley.
| Luis Castillo | |||||||||||
 | FanDuel | DraftKings | FantasyDraft | ||||||||
| Salary: | $6,800 | Salary: | $7,600 | Salary: | $14,500 | ||||||
| Salary Rank: | 19 of 30 | Salary Rank: | 10 of 30 | Salary Rank: | 11 of 30 | ||||||
| Stats | Starts | SIERA | ERA | K% | BB% | GB% | HC% | SC% | aFV | SwS% | |
|---|---|---|---|---|---|---|---|---|---|---|---|
| 2017 | 15 | 3.63 | 3.12 | 27.3% | 8.9% | 58.8% | 29.7% | 22.1% | 97.5 | 12.7% | |
| 2018 | 23 | 4.08 | 4.91 | 21.9% | 7.6% | 44.4% | 38.6% | 18.3% | 95.5 | 13.9% | |
| L14 | 2 | 3.63 | 1.46 | 25.0% | 6.3% | 42.4% | 33.3% | 21.2% | 96.3 | 12.6% | |
I’ll admit I’m torn on Luis Castillo. His strikeout upside is tantalizing and the Diamondbacks have the 8th highest K% against righties at 23.6%. This is also an awful ballpark for power. Castillo has shown wide splits against lefties this year, where they are hitting .301 with a .902 OPS against him. 12 of his 20 home runs have been by lefties and he continues to struggle against them. The good news is that the Diamondbacks don’t have too many good lefties. He’ll likely face around four lefties (David Peralta, Eduardo Escobar, Ketel Marte, Alex Avila) so the risk is real here, but Castillo offers strikeout upside if he can navigate around them. I do have interest in Castillo as an SP2 on this slate, but my exposure to him will depend on the Diamondbacks’ lineup and I’m only considering him in tournaments.
Quick Breakdown: Castillo’s struggles against lefties continue but given the matchup, I do have interest in Castillo as an SP2 in tournaments.
Batter Grind Down
Arizona
Projected Lineup (Splits vs. RH Pitching)
| # | Player | Bats | xwOBA | ISO | HC% | BB% | K% | GB% | FD Pos. | FD Sal. | DK Pos. | DK Sal. | FDRFT Pos. | FDRFT Sal. |
|---|---|---|---|---|---|---|---|---|---|---|---|---|---|---|
| 1 | David Peralta | LEFT | 0.382 | 0.249 | 48.7% | 7.5% | 18.5% | 48.9% | OF | $3,800 | OF | $5,300 | RF | $9,400 |
| 2 | Paul Goldschmidt | RIGHT | 0.378 | 0.216 | 44.4% | 12.7% | 27.6% | 41.5% | 1B | $4,000 | 1B | $4,700 | 1B | $8,900 |
| 3 | A.J. Pollock | RIGHT | 0.376 | 0.235 | 44.9% | 7.6% | 21.7% | 40.2% | OF | $3,400 | OF | $4,600 | CF | $9,200 |
| 4 | Eduardo Escobar | SWITCH | 0.364 | 0.284 | 40.9% | 7.2% | 21.4% | 27.4% | 3B | $3,800 | 3B/SS | $4,300 | 3B | $8,200 |
| 5 | Steven Souza | RIGHT | 0.278 | 0.112 | 31.8% | 9.0% | 23.0% | 37.9% | OF | $2,900 | OF | $4,300 | RF | $8,600 |
| 6 | Ketel Marte | SWITCH | 0.308 | 0.128 | 30.1% | 8.2% | 14.2% | 53.4% | 2B | $3,200 | 2B/SS | $4,200 | SS | $8,100 |
| 7 | Nick Ahmed | RIGHT | 0.308 | 0.188 | 37.8% | 7.5% | 20.8% | 39.7% | SS | $3,000 | SS | $4,100 | SS | $8,200 |
| 8 | Alex Avila | LEFT | 0.352 | 0.162 | 54.8% | 15.6% | 39.7% | 41.9% | C | $2,200 | C | $3,400 | C | $6,500 |
| 9 | Zack Godley | RIGHT | 0.117 | 0.000 | 0.0% | 7.4% | 55.6% | 60.0% | P | $8,800 | P | $8,700 | P | $17,100 |
| Team Averages | 0.318 | 0.175 | 37.0% | 9.2% | 26.9% | 43.4% |
The left-handed batters are my primary targets against Castillo. David Peralta is an elite option, while Eduardo Escobar, Ketel Marte and Alex Avila are fine one-offs if you want to take a shot on their power in this park. It’s weird not to want to consider the righties like Paul Goldschmidt, A.J. Pollock and Steven Souza, but Castillo has been solid against right-handed batters this season. I’d thrown them into a Diamondbacks stack, but the lefties remain my priority here given his wide splits.
Elite Plays – David Peralta
Secondary Plays – Alex Avila, Eduardo Escobar, Ketel Marte, (The right-handed batters of Paul Goldschmidt, A.J. Pollock and Steven Souza are secondary plays for me but would be part of my Diamondback stacks)
Stackability – YELLOW
Cincinnati
Projected Lineup (Splits vs. RH Pitching)
| # | Player | Bats | xwOBA | ISO | HC% | BB% | K% | GB% | FD Pos. | FD Sal. | DK Pos. | DK Sal. | FDRFT Pos. | FDRFT Sal. |
|---|---|---|---|---|---|---|---|---|---|---|---|---|---|---|
| 1 | Jose Peraza | RIGHT | 0.299 | 0.111 | 30.9% | 5.9% | 12.3% | 36.7% | SS | $2,500 | SS | $3,900 | SS | $7,700 |
| 2 | Joey Votto | LEFT | 0.454 | 0.158 | 38.7% | 19.0% | 13.5% | 34.6% | 1B | $3,500 | 1B | $4,400 | 1B | $8,500 |
| 3 | Scooter Gennett | LEFT | 0.344 | 0.181 | 38.4% | 7.8% | 18.1% | 39.6% | 2B | $3,200 | 2B | $4,200 | 2B | $8,300 |
| 4 | Eugenio Suarez | RIGHT | 0.376 | 0.253 | 48.1% | 8.6% | 22.9% | 35.7% | 3B | $3,700 | 3B | $4,600 | 3B | $9,300 |
| 5 | Mason Williams | LEFT | 0.299 | 0.111 | 43.3% | 2.6% | 20.5% | 53.8% | OF | $2,100 | OF | $3,200 | CF | $6,500 |
| 6 | Tucker Barnhart | SWITCH | 0.335 | 0.105 | 39.2% | 10.2% | 16.2% | 41.7% | C | $2,000 | C | $3,200 | C | $6,300 |
| 7 | Phillip Ervin | RIGHT | 0.321 | 0.100 | 32.1% | 7.3% | 24.4% | 32.1% | OF | $2,200 | OF | $4,000 | RF | $7,700 |
| 8 | Luis Castillo | RIGHT | 0.166 | 0.037 | 16.7% | 6.7% | 33.3% | 81.3% | P | $6,800 | P | $7,600 | P | $14,500 |
| 9 | Billy Hamilton | SWITCH | 0.249 | 0.064 | 18.9% | 9.5% | 23.7% | 44.1% | OF | $2,300 | OF | $3,600 | CF | $7,400 |
| Team Averages | 0.316 | 0.124 | 34.0% | 8.6% | 20.5% | 44.4% |
The Reds have a higher implied team total than I would’ve expected against a pitcher like Godley who is on a roll, but I suspect that may be more due to the ballpark than anything else. I am more likely to play Godley than stack the Reds. Eugenio Suarez and Scooter Gennett are viable one-offs if you want to chase their power upside in this ballpark. A $2,500 Jose Peraza on FanDuel is also fine with me if you need a punt shortstop batting leadoff. Even if Joey Votto cracks the lineup I am not touching him at this point. He’s clearly trying to play hurt and I can’t use a first base spot on a guy who hasn’t homered since July 9th.
Elite Plays – None
Secondary Plays – Scooter Gennett, Jose Peraza (FD), Eugenio Suarez
Stackability – RED / ORANGE
Minnesota at Detroit – 1:10 PM ET
| Minnesota | Detroit | ||||||||||||||
 | Kohl Stewart |  | Matt Boyd | ||||||||||||
| RIGHT | LEFT | ||||||||||||||
| Vegas Moneyline | Vegas Over/Under | ||||||||||||||
| DET-115 | 9.0 | ||||||||||||||
| Stats | wOBA | xwOBA | HC% | HR/9 | K% | GB% | Stats | wOBA | xwOBA | HC% | HR/9 | K% | GB% | ||
|---|---|---|---|---|---|---|---|---|---|---|---|---|---|---|---|
| SP vs. Left (2016-17) | SP vs. Left (2016-17) | 0.294 | 0.267 | 42.2% | 1.20 | 25.0% | 34.9% | ||||||||
| SP vs. Right (2016-17) | SP vs. Right (2016-17) | 0.292 | 0.300 | 36.1% | 0.97 | 20.8% | 31.3% | ||||||||
Pitcher Grind Down
| Kohl Stewart | |||||||||||
| FanDuel | DraftKings | FantasyDraft | |||||||||
| Salary: | $5,500 | Salary: | $5,000 | Salary: | $10,300 | ||||||
| Salary Rank: | 27 of 30 | Salary Rank: | 19 of 30 | Salary Rank: | 19 of 30 | ||||||
| Stats | Starts | SIERA | ERA | K% | BB% | GB% | HC% | SC% | aFV | SwS% | |
|---|---|---|---|---|---|---|---|---|---|---|---|
Former #4 draft pick Kohl Stewart finally gets his chance to make his major league debut. Stewart was drafted back in 2013 but has toiled in the minors since then. Still only 23 years old, Kohl has bounced around Double-A and Triple-A this season. He’s nowhere close to a Top-100 prospect and wasn’t even selected in last year’s Rule 5 draft, so expectations shouldn’t be too high for this debut. He’s been hit around in the minors and has allowed 129 hits through 108.2 innings, but he’s also struck out 101 batters. I have some minor GPP interest in Stewart as an SP2 simply because of his cheap price tag and matchup against a weak Tigers offense. The Tigers are middle-of-the-road in terms of K% against righties but have the third lowest team ISO, so they just don’t bring much power. If I’m dumpster diving all the way at the bottom, I’m more likely to take a shot on someone like Wei-Yin Chen than on Stewart.
Quick Breakdown: Stewart was once a top prospect but hasn’t lived up to his expectations. He gets a nice matchup against a Tigers team that lacks power, but his minor league numbers are unimpressive and he’s too risky to take a chance on.
| Matt Boyd | |||||||||||
 | FanDuel | DraftKings | FantasyDraft | ||||||||
| Salary: | $7,400 | Salary: | $6,800 | Salary: | $13,900 | ||||||
| Salary Rank: | 15 of 30 | Salary Rank: | 15 of 30 | Salary Rank: | 13 of 30 | ||||||
| Stats | Starts | SIERA | ERA | K% | BB% | GB% | HC% | SC% | aFV | SwS% | |
|---|---|---|---|---|---|---|---|---|---|---|---|
| 2017 | 25 | 4.94 | 5.27 | 18.2% | 8.8% | 38.1% | 34.6% | 21.0% | 92.0 | 10.0% | |
| 2018 | 22 | 4.34 | 4.33 | 21.8% | 7.8% | 32.2% | 37.5% | 19.9% | 89.8 | 10.0% | |
| L14 | 2 | 4.54 | 2.70 | 21.6% | 3.9% | 21.1% | 36.8% | 18.4% | 91.1 | 8.8% | |
At first glance it’s easy to overlook Matt Boyd. But once you take notice of the matchup, Boyd starts to look appealing. The Twins have the fourth highest K% against left-handed pitching at 24.1%. The Twins also just lost Logan Morrison for the year and are running thin on talent. Boyd has a respectable 21.8 K% and has done well to limit the walks and home runs this season. The price is nice enough where I’m considering Boyd in all formats on two-pitcher sites.
Quick Breakdown: Boyd gets to face a Twins team that has struggled against lefties, making him an interesting SP2 in all formats.
Batter Grind Down
Minnesota
Projected Lineup (Splits vs. LH Pitching)
| # | Player | Bats | xwOBA | ISO | HC% | BB% | K% | GB% | FD Pos. | FD Sal. | DK Pos. | DK Sal. | FDRFT Pos. | FDRFT Sal. |
|---|---|---|---|---|---|---|---|---|---|---|---|---|---|---|
| 1 | Joe Mauer | LEFT | 0.334 | 0.069 | 39.1% | 8.2% | 18.6% | 55.1% | 1B | $2,200 | 1B | $3,100 | 1B | $5,600 |
| 2 | Eddie Rosario | LEFT | 0.277 | 0.134 | 33.3% | 3.8% | 19.2% | 44.1% | OF | $3,000 | OF | $4,100 | LF | $8,100 |
| 3 | Jorge Polanco | SWITCH | 0.214 | 0.047 | 46.9% | 0.0% | 23.3% | 35.5% | SS | $2,600 | SS | $3,800 | SS | $7,700 |
| 4 | Miguel Sano | RIGHT | 0.198 | 0.095 | 26.1% | 10.4% | 41.7% | 39.1% | 3B | $2,400 | 1B/3B | $4,100 | IF/OF | $8,400 |
| 5 | Logan Forsythe | RIGHT | 0.281 | 0.067 | 41.2% | 8.2% | 22.4% | 42.6% | 2B | $2,200 | 2B/3B | $3,400 | 2B | $6,600 |
| 6 | Max Kepler | LEFT | 0.350 | 0.221 | 39.8% | 10.1% | 20.9% | 34.1% | OF | $2,400 | OF | $3,500 | RF | $6,700 |
| 7 | Mitch Garver | RIGHT | 0.288 | 0.071 | 28.3% | 11.4% | 21.5% | 37.7% | C | $2,100 | C | $3,300 | C | $6,700 |
| 8 | Ehire Adrianza | SWITCH | 0.242 | 0.109 | 24.4% | 8.3% | 27.8% | 44.2% | SS | $2,000 | SS | $2,800 | SS | $5,900 |
| 9 | Johnny Field | RIGHT | 0.323 | 0.210 | 41.9% | 4.6% | 29.2% | 38.1% | OF | $2,000 | OF | $3,000 | RF | $5,700 |
| Team Averages | 0.279 | 0.114 | 35.7% | 7.2% | 25.0% | 41.2% |
Miguel Sano against a lefty is always going to be interesting, but Sano has struggled in his career against Boyd. He’s a career 3-for-20 with one home run and 13 strikeouts. You can still target Sano for his power in this spot, but those numbers are a bit concerning. Outside of Sano, Eddie Rosario and Logan Forsythe are a bit interesting, but their prices are a bit high for my liking in a matchup that isn’t especially appealing. I find myself gravitating more towards playing Boyd than trying to pick on him with Twins bats.
Elite Plays – None
Secondary Plays – Logan Forsythe, Eddie Rosario (GPP), Miguel Sano (GPP)
Stackability – RED
Detroit
Projected Lineup (Splits vs. RH Pitching)
| # | Player | Bats | xwOBA | ISO | HC% | BB% | K% | GB% | FD Pos. | FD Sal. | DK Pos. | DK Sal. | FDRFT Pos. | FDRFT Sal. |
|---|---|---|---|---|---|---|---|---|---|---|---|---|---|---|
| 1 | Mike Gerber | LEFT | 0.268 | 0.056 | 16.7% | 10.0% | 30.0% | 25.0% | OF | $2,000 | OF | $3,900 | RF | $7,800 |
| 2 | Jose Iglesias | RIGHT | 0.264 | 0.099 | 25.7% | 3.4% | 11.3% | 45.7% | SS | $2,300 | SS | $3,600 | SS | $7,500 |
| 3 | Nick Castellanos | RIGHT | 0.368 | 0.183 | 47.4% | 5.6% | 24.9% | 33.9% | OF | $3,100 | OF | $4,000 | IF/OF | $7,400 |
| 4 | Jeimer Candelario | SWITCH | 0.291 | 0.181 | 33.7% | 11.0% | 25.2% | 38.0% | 3B | $3,100 | 3B | $3,900 | 3B | $7,200 |
| 5 | Victor Martinez | SWITCH | 0.334 | 0.075 | 39.7% | 7.2% | 9.7% | 38.0% | C | $2,100 | 1B | $2,900 | 1B | $5,900 |
| 6 | Niko Goodrum | SWITCH | 0.309 | 0.212 | 37.1% | 7.6% | 30.9% | 39.1% | 2B | $2,300 | 2B/OF | $3,800 | 1B | $7,500 |
| 7 | Jim Adduci | LEFT | 0.259 | 0.167 | 30.3% | 4.0% | 30.0% | 45.5% | OF | $2,200 | 1B | $3,600 | LF | $7,300 |
| 8 | James McCann | RIGHT | 0.271 | 0.085 | 35.9% | 5.8% | 22.8% | 39.1% | C | $2,200 | C | $2,900 | C | $5,700 |
| 9 | JaCoby Jones | RIGHT | 0.295 | 0.160 | 29.7% | 4.9% | 31.1% | 40.0% | OF | $2,200 | OF | $3,500 | CF | $6,900 |
| Team Averages | 0.295 | 0.135 | 32.9% | 6.6% | 24.0% | 38.3% |
The Tigers have a decent implied team run total, but it’s mainly because opposing pitcher Kohl Stewart will be making his debut and he hasn’t flashed good numbers in the minors. As much as I’d love to try and pick on the rookie, this Tigers offense is awful. They have the lowest team OPS in the majors and an awful team wRC+ of 74. I suppose you could take a few shots on guys like Nick Castellanos, Jeimer Candelario and Niko Goodrum and just hope they abuse the rookie. I’m going to list their stackability as Orange/Red solely because they are facing a pitcher who profiles as a poor major leaguer, and there is some merit to just throwing out a low-owned Tigers stack if you’re running a ton of lineups in case they get to Stewart. But that’s only something I would do if I were running out a ton of lineups.
Elite Plays – None
Secondary Plays – Jeimer Candelario, Nick Castellanos, Niko Goodrum
Stackability – ORANGE / RED
Note: Unless noted, all statistics in the Grind Down are from the 2018 season.