MLB Grind Down: Wednesday, June 22nd
The RotoGrinders MLB Grind Down will give you an in-depth analysis into the upcoming MLB schedule. This article will break down the numbers for every single game and give you analysis on which trends you can exploit. While matchups are a major factor in daily fantasy baseball, there are plenty of other factors to consider such as injuries, weather, and salaries.
The analysis should point you in the right direction, but it is still up to you to decipher the information and make your own selections. No sport has more variance than baseball. The best choice is not always the right choice but following the trends will win you money over time.
Note: As always, if you want to try a new DFS site, be sure to click through a RotoGrinders link and use our DraftKings promo code and FanDuel promo code to receive the best perks in the industry.
Atlanta at Miami – 12:10 PM ET
| Atlanta | Miami |
 | |  | |
| RIGHT | LEFT |
| Vegas Moneyline | Vegas Over/Under |
| MIA -170 | 8.5 |
| Stats | wOBA | HR All. | K% | BB% | Stats | wOBA | HR All. | K% | BB% |
| SP vs. Left | 0.359 | 1 | 22.8% | 10.5% | SP vs. Left | 0.344 | 1 | 18.0% | 9.8% |
| SP vs. Right | 0.306 | 1 | 26.2% | 11.9% | SP vs. Right | 0.306 | 12 | 22.3% | 8.8% |
Pitcher Grind Down
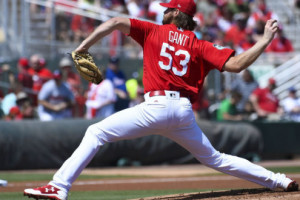
| John Gant |
 | FanDuel | DraftKings |
| Salary: | $6,000 | Salary: | $4,500 |
| FPPG: | 13.2 | FPPG: | 6.8 |
| Pitcher Rating: | 45.1 | Pitcher Rank: | 24 |
| Statistics | Starts | PitchPS | SIERA | ERA | K% | BB% | SS% | GB% | FB% | HH% |
| L30 Days | 2 | 96.0 | 4.73 | 2.63 | 21.1% | 12.3% | 9.2% | 42.9% | 40.0% | 21.1% |
| 2016 | 2 | 96.0 | 4.08 | 4.37 | 24.2% | 11.1% | 9.3% | 40.0% | 40.0% | 31.8% |
We have two slates on tap today. The first day game is between the Braves and Marlins. Gant will be on the mound for Atlanta. This will be his third career major league start and he comes into the game as a sizable underdog on the road. He has shown some decent strikeout upside, but we want to see a bigger sample size before targeting him in DFS.
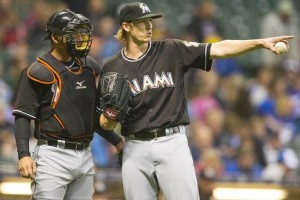
| Adam Conley |
 | FanDuel | DraftKings |
| Salary: | $8,500 | Salary: | $7,600 |
| FPPG: | 27.1 | FPPG: | 13.7 |
| Pitcher Rating: | 65.8 | Pitcher Rank: | 11 |
| Statistics | Starts | PitchPS | SIERA | ERA | K% | BB% | SS% | GB% | FB% | HH% |
| L30 Days | 6 | 100.3 | 4.98 | 4.64 | 19.1% | 11.8% | 8.1% | 41.7% | 39.6% | 23.0% |
| 2016 | 14 | 92.2 | 4.45 | 3.94 | 21.8% | 10.3% | 9.5% | 39.7% | 38.8% | 27.7% |
| 2015 | 11 | 100.2 | 3.98 | 3.76 | 21.0% | 7.5% | 10.1% | 40.6% | 40.6% | 21.7% |
Conley is an interesting play in the early-only slate because he really opens up a lot of salary cap space. I wouldn’t think of using him as an SP1, but if you want to drop down and target him as an SP2, I certainly don’t mind it. The Braves are ranked dead last in both team wOBA and team ISO against left-handed pitching this season and Conley has a strikeout rate of 21.8%. Run support should also be in his favor, as he is a sizable favorite at home.
Batter Grind Down
Atlanta
The Braves were unable to get anything going against last night, but they quickly put up a couple of runs once the Marlins turned to their bullpen. They draw a decent matchup today against , but there isn’t a ton to love here from a DFS perspective. The Braves struggle as a team against left-handed pitching and they are facing Conley in a pitcher-friendly ballpark.
- Braves Offense (2016)
Team wOBA vs. LHP — 0.260 (30 of 30)
Team ISO vs. LHP — 0.081 (30 of 30)
Team K% vs. LHP — 22.9% (20 of 30)
Runs Per Game — 3.36 (29 of 30)
Projected Run Total — 3.84 (24 of 30)
Projected Lineup
| # | Player | Bats | wOBA vs. LHP | ISO vs. LHP | wOBA L14 | FD Position | FD Salary | DK Position | DK Salary |
| 1 | | LEFT | 0.215 | 0.077 | 0.388 | 2B | $2,700 | 2B/OF | $2,300 |
| 2 | | LEFT | 0.243 | 0.050 | 0.332 | OF | $3,300 | OF | $3,200 |
| 3 | | LEFT | 0.324 | 0.132 | 0.537 | 1B | $3,400 | 1B | $4,200 |
| 4 | | RIGHT | 0.307 | 0.132 | 0.243 | OF | $2,700 | OF | $3,000 |
| 5 | | LEFT | 0.272 | 0.049 | 0.290 | OF | $2,600 | OF | $3,000 |
| 6 | | RIGHT | 0.309 | 0.103 | 0.341 | C | $2,500 | C | $3,100 |
| 7 | Chase d’Arnaud | RIGHT | 0.322 | 0.119 | 0.266 | 2B | $2,600 | 2B/3B | $3,000 |
| 8 | | SWITCH | 0.236 | 0.052 | 0.425 | SS | $2,300 | SS | $2,500 |
| 9 | | RIGHT | 0.000 | 0.000 | 0.000 | P | $6,000 | P | $4,500 |
| | Team Averages | — | 0.248 | 0.079 | 0.314 | — | — | — | — |
Elite Plays – NONE
Secondary Plays –
Stackability – NONE
Miami
The Marlins were a bit of a disappointment last night against , but they have a chance to redeem themselves today against , who is still inexperienced at the major league level. Give a small edge to the batters that can hit from the left side of the plate.
- Marlins Offense (2016)
Team wOBA vs. RHP — 0.319 (11 of 30)
Team ISO vs. RHP — 0.136 (26 of 30)
Team K% vs. RHP — 18.7% (6 of 30)
Runs Per Game — 4.16 (19 of 30)
Projected Run Total — 4.66 (7 of 30)
Projected Lineup
| # | Player | Bats | wOBA vs. RHP | ISO vs. RHP | wOBA L14 | FD Position | FD Salary | DK Position | DK Salary |
| 1 | | LEFT | 0.264 | 0.036 | 0.466 | OF | $2,900 | OF | $3,600 |
| 2 | | RIGHT | 0.272 | 0.083 | 0.305 | SS | $2,400 | SS | $3,100 |
| 3 | | LEFT | 0.370 | 0.155 | 0.340 | OF | $3,600 | OF | $4,500 |
| 4 | | RIGHT | 0.309 | 0.144 | 0.430 | OF | $3,800 | OF | $4,800 |
| 5 | | LEFT | 0.359 | 0.249 | 0.411 | 1B | $2,900 | 1B | $3,600 |
| 6 | | LEFT | 0.374 | 0.199 | 0.280 | 2B | $2,900 | 2B | $3,600 |
| 7 | Chris Johnson | RIGHT | 0.249 | 0.099 | 0.273 | 1B | $2,200 | 1B | $2,400 |
| 8 | | RIGHT | 0.194 | 0.089 | 0.390 | C | $2,200 | C | $2,000 |
| 9 | | LEFT | 0.104 | 0.000 | 0.000 | P | $8,500 | P | $7,600 |
| | Team Averages | — | 0.277 | 0.117 | 0.322 | — | — | — | — |
Elite Plays –
Secondary Plays – , , ,
Stackability – GPP
Colorado at NY Yankees – 1:05 PM ET
| Colorado | NY Yankees |
 | |  | |
| RIGHT | LEFT |
| Vegas Moneyline | Vegas Over/Under |
| NYY -145 | 8.5 |
| Stats | wOBA | HR All. | K% | BB% | Stats | wOBA | HR All. | K% | BB% |
| SP vs. Left | 0.319 | 6 | 25.8% | 7.8% | SP vs. Left | 0.259 | 4 | 28.7% | 7.3% |
| SP vs. Right | 0.330 | 6 | 23.6% | 6.8% | SP vs. Right | 0.340 | 26 | 17.3% | 7.8% |
Pitcher Grind Down
| Jon Gray |
 | FanDuel | DraftKings |
| Salary: | $8,100 | Salary: | $10,000 |
| FPPG: | 32.8 | FPPG: | 17.5 |
| Pitcher Rating: | 59.7 | Pitcher Rank: | 16 |
| Statistics | Starts | PitchPS | SIERA | ERA | K% | BB% | SS% | GB% | FB% | HH% |
| L30 Days | 5 | 96.0 | 3.54 | 2.43 | 25.2% | 6.9% | 13.1% | 48.3% | 34.5% | 35.2% |
| 2016 | 11 | 93.5 | 3.33 | 4.55 | 26.8% | 7.1% | 12.4% | 49.1% | 28.1% | 31.4% |
| 2015 | 9 | 75.8 | 3.89 | 5.53 | 21.6% | 7.6% | 10.1% | 42.4% | 32.8% | 36.4% |
Gray has all the tools to be an ace in the major leagues, he just hasn’t had any luck on his side. His ERA on the season is a full run higher than his SIERA. His peripheral statistics all look good, as he has a 3.33 SIERA with a strikeout rate of 26.8%. The good news for him today is that he doesn’t have to pitch in Coors Field. The bad news is that Yankee Stadium isn’t all that much better for pitchers. He seems a bit overpriced as an underdog on the road.
| CC Sabathia |
 | FanDuel | DraftKings |
| Salary: | $7,600 | Salary: | $8,500 |
| FPPG: | 34.2 | FPPG: | 17.8 |
| Pitcher Rating: | 56.8 | Pitcher Rank: | 18 |
| Statistics | Starts | PitchPS | SIERA | ERA | K% | BB% | SS% | GB% | FB% | HH% |
| L30 Days | 5 | 99.6 | 4.42 | 0.87 | 21.6% | 10.4% | 9.0% | 46.9% | 37.0% | 23.2% |
| 2016 | 11 | 95.5 | 4.48 | 2.20 | 20.4% | 9.9% | 9.1% | 46.2% | 35.7% | 23.1% |
| 2015 | 29 | 93.2 | 4.08 | 4.73 | 18.9% | 6.9% | 9.1% | 45.9% | 32.4% | 29.1% |
Sabathia continues to pitch out of trouble, which has led to a 2.20 ERA this season. It’s only a matter of time before regression hits, as he currently has a 4.48 SIERA with a walk rate of 9.9%. The Rockies may not be an elite offense away from Coors Field, but they certainly have some quality hitters in their lineup. Rather than targeting Sabathia and crossing my fingers, I will be looking elsewhere at pitcher in the early slate.
Batter Grind Down
Colorado
is one of the easiest pitchers to breakdown in terms of the matchup. He is very good against left-handed hitters and very bad against right-handed hitters. Over the last two seasons, he has allowed a .340 wOBA and 26 home runs to batters from the right side of the plate.
- Rockies Offense (2016)
Team wOBA vs. LHP — 0.327 (9 of 30)
Team ISO vs. LHP — 0.180 (6 of 30)
Team K% vs. LHP — 23.7% (22 of 30)
Runs Per Game — 5.01 (4 of 30)
Projected Run Total — 3.99 (19 of 30)
Projected Lineup
| # | Player | Bats | wOBA vs. LHP | ISO vs. LHP | wOBA L14 | FD Position | FD Salary | DK Position | DK Salary |
| 1 | | LEFT | 0.319 | 0.127 | 0.319 | OF | $3,800 | OF | $3,600 |
| 2 | | RIGHT | 0.355 | 0.107 | 0.477 | 2B | $3,300 | 2B | $3,900 |
| 3 | | RIGHT | 0.352 | 0.221 | 0.335 | 3B | $3,900 | 3B | $3,700 |
| 4 | | LEFT | 0.257 | 0.153 | 0.386 | OF | $3,800 | OF | $3,600 |
| 5 | | RIGHT | 0.357 | 0.234 | 0.367 | SS | $3,000 | SS | $3,900 |
| 6 | | RIGHT | 0.406 | 0.266 | 0.332 | OF | $3,000 | OF | $2,800 |
| 7 | | RIGHT | 0.317 | 0.153 | 0.378 | 1B | $3,300 | 1B | $3,400 |
| 8 | | RIGHT | 0.322 | 0.144 | 0.311 | C | $2,500 | C | $2,300 |
| 9 | | RIGHT | 0.231 | 0.024 | 0.115 | OF | $2,000 | OF | $2,000 |
| | Team Averages | — | 0.324 | 0.159 | 0.336 | — | — | — | — |
Elite Plays – , (FD)
Secondary Plays – , (DK),
Stackability – GPP
NY Yankees
The Yankees don’t have the best matchup on paper, but they come into the game with the ninth highest run projection of the 30 teams in action today. may be a great pitcher eventually, but he has allowed a .319 wOBA to left-handed hitters and a .330 wOBA to right-handed hitters over the last two seasons.
- Yankees Offense (2016)
Team wOBA vs. RHP — 0.304 (23 of 30)
Team ISO vs. RHP — 0.149 (18 of 30)
Team K% vs. RHP — 18.8% (7 of 30)
Runs Per Game — 4.10 (21 of 30)
Projected Run Total — 4.51 (9 of 30)
Projected Lineup
| # | Player | Bats | wOBA vs. RHP | ISO vs. RHP | wOBA L14 | FD Position | FD Salary | DK Position | DK Salary |
| 1 | | LEFT | 0.313 | 0.109 | 0.292 | OF | $3,500 | OF | $3,100 |
| 2 | | LEFT | 0.333 | 0.149 | 0.332 | OF | $3,700 | OF | $3,300 |
| 3 | | SWITCH | 0.357 | 0.217 | 0.459 | OF | $3,800 | OF | $3,900 |
| 4 | | RIGHT | 0.333 | 0.209 | 0.292 | 3B | $3,500 | 1B/3B | $3,000 |
| 5 | | LEFT | 0.328 | 0.211 | 0.326 | C | $3,300 | C | $3,100 |
| 6 | | RIGHT | 0.287 | 0.130 | 0.248 | 2B | $3,000 | 2B | $2,400 |
| 7 | | LEFT | 0.302 | 0.123 | 0.413 | SS | $2,900 | SS | $3,000 |
| 8 | | SWITCH | 0.304 | 0.105 | 0.376 | 3B | $2,700 | 3B | $2,400 |
| 9 | | LEFT | 0.289 | 0.111 | 0.222 | 1B | $2,100 | 1B | $2,400 |
| | Team Averages | — | 0.316 | 0.152 | 0.329 | — | — | — | — |
Elite Plays –
Secondary Plays – , ,
Stackability – GPP
Kansas City at NY Mets – 1:10 PM ET
| Kansas City | NY Mets |
 | |  | |
| LEFT | RIGHT |
| Vegas Moneyline | Vegas Over/Under |
| NYM -185 | 6.5 |
| Stats | wOBA | HR All. | K% | BB% | Stats | wOBA | HR All. | K% | BB% |
| SP vs. Left | 0.252 | 0 | 27.9% | 5.7% | SP vs. Left | 0.293 | 12 | 26.3% | 5.5% |
| SP vs. Right | 0.337 | 24 | 18.7% | 8.7% | SP vs. Right | 0.242 | 11 | 31.7% | 3.7% |
Pitcher Grind Down
| Danny Duffy |
 | FanDuel | DraftKings |
| Salary: | $7,400 | Salary: | $7,400 |
| FPPG: | 13.8 | FPPG: | 7.9 |
| Pitcher Rating: | 63.5 | Pitcher Rank: | 14 |
| Statistics | Starts | PitchPS | SIERA | ERA | K% | BB% | SS% | GB% | FB% | HH% |
| L30 Days | 6 | 78.3 | 3.19 | 3.55 | 28.2% | 3.8% | 14.7% | 30.1% | 51.8% | 32.6% |
| 2016 | 7 | 112.3 | 3.03 | 3.17 | 29.0% | 5.5% | 16.4% | 34.1% | 45.9% | 29.5% |
| 2015 | 24 | 98.3 | 4.63 | 4.08 | 17.4% | 9.0% | 8.4% | 38.8% | 36.5% | 29.5% |
Duffy has been terrific this season, posting a 3.03 SIERA with a strikeout rate of 29% and a walk rate of only 5.5%. He went from being a spot starter to being one of the better pitchers in the Royals’ rotation. I don’t love the fact that he is such a large underdog today, but that has more to do with the opposing pitcher than it does his matchup against the Mets. On the season, New York is ranked 27th in team wOBA and 30th in team K% against left-handed pitching. Duffy is a sneaky GPP play that should get overlooked by the masses.
| Noah Syndergaard |
 | FanDuel | DraftKings |
| Salary: | $10,900 | Salary: | $13,000 |
| FPPG: | 43.1 | FPPG: | 24.7 |
| Pitcher Rating: | 94.4 | Pitcher Rank: | 1 |
| Statistics | Starts | PitchPS | SIERA | ERA | K% | BB% | SS% | GB% | FB% | HH% |
| L30 Days | 5 | 96.6 | 2.27 | 1.42 | 32.5% | 2.4% | 15.7% | 48.1% | 26.6% | 30.5% |
| 2016 | 13 | 97.5 | 2.38 | 1.91 | 31.9% | 3.6% | 15.1% | 53.4% | 26.4% | 27.7% |
| 2015 | 24 | 99.2 | 2.95 | 3.24 | 27.5% | 5.1% | 12.2% | 46.5% | 33.6% | 24.6% |
Syndergaard was scratched from his start yesterday, but it was not due to an injury of any kind. The Mets just decided to push his start back a day, so we can target him with complete confidence in DFS. He has been one of the best pitchers in baseball this season, posting a 2.38 SIERA with a strikeout rate of 31.9% and a walk rate of 3.6%. The Royals used to be a team that we wanted to avoid taking pitchers against, but that hasn’t been the case this season. I have Syndergaard ranked as the top pitching option available today.
Batter Grind Down
Kansas City
The Royals come into today’s game with the lowest team total on the board. They do not hit for a lot of power and they are facing a superhero (Thor) in a pitcher-friendly ballpark. Over the last two seasons, has held both left and right-handed hitters under a .295 wOBA.
- Royals Offense (2016)
Team wOBA vs. RHP — 0.314 (14 of 30)
Team ISO vs. RHP — 0.133 (28 of 30)
Team K% vs. RHP — 19.9% (12 of 30)
Runs Per Game — 4.09 (23 of 30)
Projected Run Total — 2.76 (30 of 30)
Projected Lineup
| # | Player | Bats | wOBA vs. RHP | ISO vs. RHP | wOBA L14 | FD Position | FD Salary | DK Position | DK Salary |
| 1 | | RIGHT | 0.342 | 0.146 | 0.377 | 2B | $3,400 | 2B/OF | $3,600 |
| 2 | | RIGHT | 0.263 | 0.060 | 0.193 | SS | $2,700 | SS | $2,400 |
| 3 | | LEFT | 0.387 | 0.189 | 0.364 | 1B | $3,300 | 1B | $4,200 |
| 4 | | RIGHT | 0.321 | 0.127 | 0.259 | OF | $3,300 | OF | $3,200 |
| 5 | | RIGHT | 0.348 | 0.210 | 0.513 | C | $3,100 | C | $4,400 |
| 6 | | RIGHT | 0.334 | 0.181 | 0.416 | OF | $3,200 | OF | $3,000 |
| 7 | | RIGHT | 0.298 | 0.115 | 0.340 | 3B | $2,400 | 3B | $2,700 |
| 8 | | RIGHT | 0.332 | 0.250 | 0.260 | OF | $2,000 | OF | $2,300 |
| 9 | | LEFT | | | | P | $7,400 | P | $7,400 |
| | Team Averages | — | 0.328 | 0.160 | 0.340 | — | — | — | — |
Elite Plays – NONE
Secondary Plays – NONE
Stackability – NONE
NY Mets
The Mets may be large favorites today, but they still have one of the lowest implied run totals on the board. They do not hit left-handed pitching well as a team and they draw a difficult matchup against , who has held both left and right-handed hitters under a .320 wOBA this season.
- Mets Offense (2016)
Team wOBA vs. LHP — 0.301 (27 of 30)
Team ISO vs. LHP — 0.151 (18 of 30)
Team K% vs. LHP — 25.4% (30 of 30)
Runs Per Game — 3.68 (28 of 30)
Projected Run Total — 3.74 (26 of 30)
Projected Lineup
| # | Player | Bats | wOBA vs. LHP | ISO vs. LHP | wOBA L14 | FD Position | FD Salary | DK Position | DK Salary |
| 1 | | LEFT | 0.258 | 0.129 | 0.387 | OF | $3,400 | OF | $3,500 |
| 2 | | SWITCH | 0.316 | 0.130 | 0.305 | SS | $3,000 | SS | $3,200 |
| 3 | | RIGHT | 0.356 | 0.242 | 0.354 | OF | $4,000 | OF | $4,000 |
| 4 | | SWITCH | 0.319 | 0.155 | 0.253 | 2B | $3,200 | 2B | $2,800 |
| 5 | | RIGHT | 0.372 | 0.231 | 0.352 | 3B | $2,000 | 3B | $3,400 |
| 6 | Travis D’Arnaud | RIGHT | 0.445 | 0.320 | | C | $2,000 | C | $3,700 |
| 7 | | LEFT | 0.462 | 0.300 | 0.366 | 3B | $2,000 | 2B | $2,000 |
| 8 | | LEFT | 0.270 | 0.104 | 0.296 | 1B | $2,400 | 1B | $2,400 |
| 9 | | RIGHT | 0.144 | 0.000 | 0.242 | P | $10,900 | P | $13,000 |
| | Team Averages | — | 0.327 | 0.179 | 0.319 | — | — | — | — |
Elite Plays – NONE
Secondary Plays – ,
Stackability – NONE
LA Angels at Houston – 2:10 PM ET
| LA Angels | Houston |
 | |  | |
| RIGHT | RIGHT |
| Vegas Moneyline | Vegas Over/Under |
| HOU -145 | 8.0 |
| Stats | wOBA | HR All. | K% | BB% | Stats | wOBA | HR All. | K% | BB% |
| SP vs. Left | 0.309 | 16 | 19.9% | 6.4% | SP vs. Left | 0.274 | 3 | 29.7% | 8.7% |
| SP vs. Right | 0.333 | 18 | 24.1% | 4.8% | SP vs. Right | 0.328 | 8 | 21.4% | 11.0% |
Pitcher Grind Down
| Matt Shoemaker |
 | FanDuel | DraftKings |
| Salary: | $8,300 | Salary: | $10,300 |
| FPPG: | 29.1 | FPPG: | 15.5 |
| Pitcher Rating: | 63.8 | Pitcher Rank: | 12 |
| Statistics | Starts | PitchPS | SIERA | ERA | K% | BB% | SS% | GB% | FB% | HH% |
| L30 Days | 6 | 104.7 | 2.29 | 1.83 | 32.7% | 1.2% | 18.5% | 42.3% | 36.0% | 31.5% |
| 2016 | 13 | 91.5 | 3.50 | 4.50 | 24.5% | 4.8% | 14.3% | 37.9% | 37.0% | 32.4% |
| 2015 | 24 | 87.0 | 3.98 | 4.46 | 20.4% | 6.2% | 9.1% | 39.2% | 42.4% | 30.9% |
Shoemaker continues to pitch well for the Angels. After a horrid start to the season, he has really turned it around. Over the last month of play (six starts), he has a 2.29 SIERA with a strikeout rate of 32.7% and a walk rate of 1.2%. With each start, he is proving that he is more than just a flash in the pan. While he isn’t getting a ton of love from the oddsmakers, you have to like his strikeout upside against the Astros. His price is a little high for cash games, but the upside needed for GPPs is there.
| Lance McCullers |
 | FanDuel | DraftKings |
| Salary: | $8,700 | Salary: | $8,200 |
| FPPG: | 35.7 | FPPG: | 17.7 |
| Pitcher Rating: | 78.4 | Pitcher Rank: | 3 |
| Statistics | Starts | PitchPS | SIERA | ERA | K% | BB% | SS% | GB% | FB% | HH% |
| L30 Days | 5 | 101.0 | 3.99 | 3.64 | 28.9% | 14.8% | 13.1% | 62.2% | 20.3% | 26.3% |
| 2016 | 7 | 98.0 | 4.06 | 4.24 | 27.5% | 14.3% | 12.5% | 59.6% | 21.2% | 29.3% |
| 2015 | 22 | 95.9 | 3.57 | 3.22 | 24.8% | 8.3% | 9.8% | 46.5% | 31.8% | 28.9% |
McCullers has pitched well this season other than his walks allowed. He is walking over 14% of the batters that he faces, which drives up his pitch counts and makes him work out of the stretch more often than he’d like. The good news is that the upside has been there, as he has a strikeout rate of 27.5%. He draws a decent matchup today against the Angels, although as a team, they have the lowest strikeout rate against right-handed pitching. I’m just fine with McCullers as an SP2 in the early-only slate, but there are better SP1’s on the board.
Batter Grind Down
LA Angels
Outside of , the Angels haven’t done much of anything offensively this season. In fact, if you take him out of the lineup, they would be right there with the Braves and Phillies for the worst offense in baseball. They draw a difficult matchup against , although he has allowed a .328 wOBA to right-handed hitters over the last two seasons.
- Angels Offense (2016)
Team wOBA vs. RHP — 0.312 (17 of 30)
Team ISO vs. RHP — 0.139 (24 of 30)
Team K% vs. RHP — 15.8% (1 of 30)
Runs Per Game — 4.30 (15 of 30)
Projected Run Total — 3.74 (27 of 30)
Projected Lineup
| # | Player | Bats | wOBA vs. RHP | ISO vs. RHP | wOBA L14 | FD Position | FD Salary | DK Position | DK Salary |
| 1 | | RIGHT | 0.341 | 0.094 | 0.321 | 3B | $2,900 | 3B | $3,300 |
| 2 | | LEFT | 0.334 | 0.172 | 0.314 | OF | $3,500 | OF | $3,600 |
| 3 | | RIGHT | 0.412 | 0.285 | 0.355 | OF | $3,900 | OF | $4,900 |
| 4 | | RIGHT | 0.324 | 0.202 | 0.219 | 1B | $3,300 | 1B | $3,200 |
| 5 | | RIGHT | 0.330 | 0.179 | 0.387 | 1B | $2,500 | 1B | $3,600 |
| 6 | | SWITCH | 0.263 | 0.065 | 0.220 | OF | $2,100 | OF | $2,700 |
| 7 | | RIGHT | 0.288 | 0.077 | 0.205 | SS | $2,300 | SS | $2,400 |
| 8 | | RIGHT | 0.276 | 0.121 | 0.169 | C | $2,200 | C | $2,100 |
| 9 | | RIGHT | 0.335 | 0.137 | 0.435 | SS | $2,700 | SS | $2,300 |
| | Team Averages | — | 0.323 | 0.148 | 0.292 | — | — | — | — |
Elite Plays –
Secondary Plays –
Stackability – NONE
Houston
The Astros have a mediocre run projection today, ranking 13th of the 30 teams in action. They haven’t been great against right-handed pitching this season and they draw a tough matchup against , who has looked more like than himself over the last month of play. The Astros are favorites, but I’m not a huge fan of their bats today.
- Astros Offense (2016)
Team wOBA vs. RHP — 0.312 (17 of 30)
Team ISO vs. RHP — 0.165 (14 of 30)
Team K% vs. RHP — 24.8% (28 of 30)
Runs Per Game — 4.20 (17 of 30)
Projected Run Total — 4.26 (13 of 30)
Projected Lineup
| # | Player | Bats | wOBA vs. RHP | ISO vs. RHP | wOBA L14 | FD Position | FD Salary | DK Position | DK Salary |
| 1 | | RIGHT | 0.339 | 0.174 | 0.260 | OF | $3,900 | OF | $3,700 |
| 2 | | SWITCH | 0.292 | 0.119 | 0.399 | 1B | $3,400 | 1B/3B | $3,400 |
| 3 | | RIGHT | 0.342 | 0.153 | 0.412 | 2B | $4,100 | 2B | $4,400 |
| 4 | | RIGHT | 0.360 | 0.208 | 0.377 | SS | $4,100 | SS | $3,600 |
| 5 | | LEFT | 0.327 | 0.218 | 0.344 | OF | $3,400 | OF | $3,300 |
| 6 | | RIGHT | 0.297 | 0.145 | 0.409 | OF | $3,500 | OF | $3,300 |
| 7 | | LEFT | 0.342 | 0.216 | 0.444 | 3B | $3,200 | 3B | $3,300 |
| 8 | | RIGHT | 0.315 | 0.221 | 0.219 | C | $3,100 | C | $3,300 |
| 9 | | LEFT | 0.328 | 0.201 | 0.286 | C | $2,700 | C | $2,900 |
| | Team Averages | — | 0.327 | 0.184 | 0.350 | — | — | — | — |
Elite Plays – NONE
Secondary Plays – ,
Stackability – NONE
St. Louis at Chicago Cubs – 2:20 PM ET
| St. Louis | Chicago Cubs |
 | |  | |
| RIGHT | RIGHT |
| Vegas Moneyline | Vegas Over/Under |
| CHC -220 | 7.5 |
| Stats | wOBA | HR All. | K% | BB% | Stats | wOBA | HR All. | K% | BB% |
| SP vs. Left | 0.287 | 10 | 19.3% | 8.2% | SP vs. Left | 0.219 | 4 | 29.4% | 7.8% |
| SP vs. Right | 0.312 | 15 | 20.6% | 7.7% | SP vs. Right | 0.230 | 9 | 25.5% | 5.2% |
Pitcher Grind Down
| Michael Wacha |
 | FanDuel | DraftKings |
| Salary: | $7,200 | Salary: | $6,800 |
| FPPG: | 25.3 | FPPG: | 12.8 |
| Pitcher Rating: | 49.7 | Pitcher Rank: | 23 |
| Statistics | Starts | PitchPS | SIERA | ERA | K% | BB% | SS% | GB% | FB% | HH% |
| L30 Days | 5 | 94.8 | 4.42 | 5.46 | 20.6% | 9.5% | 8.7% | 40.7% | 31.4% | 29.6% |
| 2016 | 14 | 95.4 | 4.29 | 4.56 | 20.0% | 8.6% | 8.2% | 45.3% | 29.0% | 29.3% |
| 2015 | 30 | 97.9 | 4.02 | 3.37 | 20.1% | 7.6% | 9.5% | 45.8% | 32.0% | 29.7% |
Wacha is no longer that elite strikeout pitcher that we saw a few years back. Through 14 starts this season, he has a 4.29 SIERA with a strikeout rate of 20%. He is walking too many batters and he isn’t producing enough ground balls. He draws an awful matchup today against the Cubs, who are ranked sixth in team wOBA and tenth in team ISO against right-handed pitching this season. With pitching opposite him, Wacha is an easy fade.
| Jake Arrieta |
 | FanDuel | DraftKings |
| Salary: | $12,100 | Salary: | $12,800 |
| FPPG: | 47.1 | FPPG: | 26.8 |
| Pitcher Rating: | 90.9 | Pitcher Rank: | 2 |
| Statistics | Starts | PitchPS | SIERA | ERA | K% | BB% | SS% | GB% | FB% | HH% |
| L30 Days | 5 | 105.0 | 3.00 | 2.70 | 29.9% | 8.7% | 13.5% | 62.7% | 24.0% | 19.7% |
| 2016 | 14 | 103.0 | 3.25 | 1.74 | 27.8% | 8.5% | 11.4% | 57.5% | 24.8% | 21.9% |
| 2015 | 33 | 104.2 | 2.75 | 1.77 | 27.1% | 5.5% | 11.1% | 56.2% | 22.8% | 22.1% |
Arrieta is having another terrific season, posting a 3.25 SIERA with a strikeout rate of 27.8%. He is walking a few more batters this season, but as long as he continues to rack up the strikeouts, it’s not a big deal in DFS. Arrieta is typically the number one pitching option on the slate, but with in a good matchup at home and Arrieta having to face the Cardinals, he drops down to the second best pitcher available today. The upside is always there, but the Cardinals are one of the best offenses in baseball against right-handed pitching.
Batter Grind Down
St. Louis
The Cardinals may be ranked inside the top ten in team wOBA, team ISO, and team K% against right-handed pitching this season, but they are an easy offense to avoid today. Over the last two seasons, has held both left and right-handed hitters under a .230 wOBA.
- Cardinals Offense (2016)
Team wOBA vs. RHP — 0.347 (2 of 30)
Team ISO vs. RHP — 0.198 (3 of 30)
Team K% vs. RHP — 19.3% (9 of 30)
Runs Per Game — 5.29 (3 of 30)
Projected Run Total — 3.06 (29 of 30)
Projected Lineup
| # | Player | Bats | wOBA vs. RHP | ISO vs. RHP | wOBA L14 | FD Position | FD Salary | DK Position | DK Salary |
| 1 | | LEFT | 0.405 | 0.262 | 0.504 | 2B | $3,000 | 2B/3B | $3,900 |
| 2 | | RIGHT | 0.374 | 0.217 | 0.216 | SS | $2,500 | SS | $2,900 |
| 3 | | RIGHT | 0.355 | 0.167 | 0.362 | OF | $2,200 | OF | $3,000 |
| 4 | | LEFT | 0.332 | 0.200 | 0.259 | 1B | $2,000 | 1B | $3,000 |
| 5 | | RIGHT | 0.340 | 0.162 | 0.348 | OF | $2,300 | OF | $3,300 |
| 6 | | RIGHT | 0.329 | 0.118 | 0.338 | 3B | $2,200 | 3B | $3,300 |
| 7 | | RIGHT | 0.305 | 0.095 | 0.339 | C | $2,000 | C | $2,400 |
| 8 | | LEFT | 0.318 | 0.131 | 0.263 | 2B | $2,000 | 2B | $2,100 |
| 9 | | RIGHT | 0.137 | 0.017 | 0.000 | P | $7,200 | P | $6,800 |
| | Team Averages | — | 0.322 | 0.152 | 0.292 | — | — | — | — |
Elite Plays – NONE
Secondary Plays – NONE
Stackability – NONE
Chicago Cubs
The Cubs draw a mediocre matchup today against . While he hasn’t been as dominant this season, Wacha is still fairly tough on both left and right-handed hitters. With so many favorable matchups to exploit, I will only be using the Cubs in GPPs. There are better cash game targets in games that are expected to be high scoring.
- Cubs Offense (2016)
Team wOBA vs. RHP — 0.334 (6 of 30)
Team ISO vs. RHP — 0.173 (10 of 30)
Team K% vs. RHP — 22.2% (18 of 30)
Runs Per Game — 5.43 (2 of 30)
Projected Run Total — 4.44 (10 of 30)
Projected Lineup
| # | Player | Bats | wOBA vs. RHP | ISO vs. RHP | wOBA L14 | FD Position | FD Salary | DK Position | DK Salary |
| 1 | | LEFT | 0.322 | 0.191 | 0.264 | 3B | $2,400 | 2B/OF | $2,500 |
| 2 | | LEFT | 0.338 | 0.146 | 0.347 | OF | $2,900 | OF | $3,800 |
| 3 | | RIGHT | 0.378 | 0.218 | 0.402 | 3B | $4,300 | 3B/OF | $5,100 |
| 4 | | LEFT | 0.397 | 0.270 | 0.470 | 1B | $4,100 | 1B | $5,400 |
| 5 | | SWITCH | 0.351 | 0.174 | 0.351 | 2B | $3,200 | 2B | $4,300 |
| 6 | | LEFT | 0.319 | 0.153 | 0.223 | C | $2,200 | C | $3,100 |
| 7 | | RIGHT | 0.323 | 0.149 | 0.341 | SS | $2,900 | SS | $3,200 |
| 8 | | RIGHT | 0.275 | 0.135 | 0.415 | SS | $3,100 | 3B/SS | $3,500 |
| 9 | | RIGHT | 0.192 | 0.118 | 0.489 | P | $12,100 | P | $12,800 |
| | Team Averages | — | 0.322 | 0.173 | 0.367 | — | — | — | — |
Elite Plays – NONE
Secondary Plays – , ,
Stackability – NONE
Are you an incentives member? Come check out the MLB Expert Chat from 5:30 – 6:00 PM ET.
Jump to Page 1 2 3
