MLB Grind Down: Saturday, June 24th

Jump to Page 1 2 3
The RotoGrinders MLB Grind Down will give you an in-depth analysis into the upcoming MLB schedule. This article will break down the numbers for every single game and give you analysis on which trends you can exploit. While matchups are a major factor in daily fantasy baseball, there are plenty of other factors to consider such as injuries, weather, and salaries.
The analysis should point you in the right direction, but it is still up to you to decipher the information and make your own selections. No sport has more variance than baseball. The best choice is not always the right choice but following the trends will win you money over time.
Note: As always, if you want to try a new DFS site, be sure to click through a RotoGrinders link and use our DraftKings promo code, FanDuel promo code, and FantasyDraft promo code to receive the best perks in the industry.
Stackability Rating System:
GREEN – A viable full stack in cash games and GPPs.
YELLOW – A viable mini-stack in cash games and full stack in GPPs.
ORANGE – A viable stack in large field GPPs.
RED – Not a recommended stack for cash games or GPPs.
Texas at NY Yankees – 1:05 PM ET
| Texas | NY Yankees | ||||||||||||||
 | Austin Bibens-Dirkx |  | Luis Cessa | ||||||||||||
| RIGHT | RIGHT | ||||||||||||||
| Vegas Moneyline | Vegas Over/Under | ||||||||||||||
| NYY-145 | 11.0 | ||||||||||||||
| Stats | wOBA | xwOBA | HC% | BB% | K% | GB% | Stats | wOBA | xwOBA | HC% | BB% | K% | GB% | ||
|---|---|---|---|---|---|---|---|---|---|---|---|---|---|---|---|
| SP vs. Left (2016-17) | 0.274 | 0.367 | 33.3% | 8.7% | 6.5% | 41.0% | SP vs. Left (2016-17) | 0.327 | 0.337 | 40.2% | 5.6% | 16.8% | 43.8% | ||
| SP vs. Right (2016-17) | 0.269 | 0.325 | 41.0% | 5.7% | 18.9% | 33.3% | SP vs. Right (2016-17) | 0.316 | 0.340 | 29.4% | 4.6% | 15.0% | 43.0% | ||
Pitcher Grind Down
| Austin Bibens-Dirkx | |||||||||
 | FanDuel | DraftKings | FantasyDraft | ||||||
| Salary: | $5,900 | Salary: | $4,800 | Salary: | |||||
| Salary Rank: | 30 of 30 | Salary Rank: | 27 of 30 | Salary Rank: | of 30 | ||||
| Stats | Starts | SIERA | ERA | K% | BB% | GB% | HC% | SC% | |
|---|---|---|---|---|---|---|---|---|---|
| 2017 | 2 | 5.20 | 3.28 | 13.1% | 7.1% | 37.2% | 37.2% | 18.0% | |
Welcome to the MLB Grind Down. We have 15 games on the schedule today but how they are divided depends what site you are playing on. FanDuel has included the Yankees and Rangers with the other two games that start before 4:00 PM to form a Very Early only slate. They are starting their afternoon slate at 4:05. DraftKings left the Yankees and Rangers of everything except their all day slate. They are starting their afternoon slate at 2:100 though.
We’ll go ahead and dive right in. No matter what slate you are playing, you aren’t pitching Austin Bibens-Dirkx against the Yankees. He owns a 41.9% fly ball rate, 37.22% hard contact rate and 13.1% K rate. The Yankees own a 22.3% K rate, .355 wOBA and 121 wRC+ against RH pitching.
Quick Breakdown: If this game is included in the slate you are playing, you’ll want to load up on several Yankees power hitters. Bibens-Dirkx can be ignored in all formats though.
| Luis Cessa | |||||||||
 | FanDuel | DraftKings | FantasyDraft | ||||||
| Salary: | $6,000 | Salary: | $4,600 | Salary: | |||||
| Salary Rank: | 29 of 30 | Salary Rank: | 29 of 30 | Salary Rank: | of 30 | ||||
| Stats | Starts | SIERA | ERA | K% | BB% | GB% | HC% | SC% | |
|---|---|---|---|---|---|---|---|---|---|
| 2016 | 9 | 4.42 | 4.35 | 16.1% | 4.9% | 43.2% | 33.8% | 16.2% | |
| 2017 | 0 | 5.19 | 5.40 | 7.7% | 7.7% | 45.5% | 36.4% | 0.0% | |
Luis Cessa will make a spot start for the Yankees. In nine starts last season, he showed great control with a 4.9% BB rate. He’s never been an elite strikeout arm though with a 16.1% K rate. The Rangers will help in the strikeout department though with a 23.4% K rate, .321 wOBA and 94 wRC+ against RH pitching.
Quick Breakdown: Given that this game is mainly offered only on FanDuel, I don’t see any reason to use Cessa. I would normally classify him as a low-end SP2 but that’s not necessary on FD. You could possibly use Cessa to load up on hitters on FD but he’ll cost you one Yankee bat as you can only have four Yankees total.
Batter Grind Down
Texas
We can attack Cessa with batters from either side of the plate. Luic Cessa is allowing a .327 wOBA to LH and .316 wOBA to RH hitters in his short MLB career. More importantly, he’s allowing 40.1% hard contact to LH hitters. Nomar Mazara and Shin-Soo Choo stand out as the best options here. We’ll call them elite options if you are playing the very early slate. Behind them, Elvis Andrus and Rougned Odor are acceptable plays.
Projected Lineup (Splits vs. RH Pitching)
| # | Player | Bats | wOBA | xwOBA | ISO | HC% | BB% | K% | GB% | FD Pos. | FD Sal. | DK Pos. | DK Sal. | FDRFT Pos. | FDRFT Sal. |
|---|---|---|---|---|---|---|---|---|---|---|---|---|---|---|---|
| 1 | Shin-soo Choo | LEFT | 0.336 | 0.384 | 0.162 | 40.9% | 13.1% | 21.1% | 47.5% | OF | $3,700 | OF | $4,000 | N/A | N/A |
| 2 | Elvis Andrus | RIGHT | 0.337 | 0.317 | 0.140 | 26.9% | 7.8% | 14.3% | 46.5% | SS | $2,900 | SS | $4,500 | N/A | N/A |
| 3 | Nomar Mazara | LEFT | 0.344 | 0.336 | 0.190 | 31.0% | 8.2% | 18.9% | 43.7% | OF | $3,400 | OF | $4,300 | N/A | N/A |
| 4 | Adrian Beltre | RIGHT | 0.355 | 0.363 | 0.200 | 33.9% | 6.5% | 10.9% | 40.1% | 3B | $3,800 | 3B | $4,500 | N/A | N/A |
| 5 | Rougned Odor | LEFT | 0.334 | 0.299 | 0.248 | 34.8% | 3.1% | 22.4% | 39.3% | 2B | $3,400 | 2B | $3,400 | N/A | N/A |
| 6 | Carlos Gomez | RIGHT | 0.323 | 0.301 | 0.183 | 33.5% | 9.1% | 27.7% | 41.9% | OF | $4,000 | OF | $4,300 | N/A | N/A |
| 7 | Jonathan Lucroy | RIGHT | 0.351 | 0.336 | 0.173 | 30.4% | 7.1% | 14.6% | 42.8% | C | $2,800 | C | $3,400 | N/A | N/A |
| 8 | Mike Napoli | RIGHT | 0.323 | 0.329 | 0.236 | 34.4% | 9.5% | 30.0% | 36.9% | 1B | $3,400 | 1B | $4,000 | N/A | N/A |
| 9 | Joey Gallo | LEFT | 0.319 | 0.322 | 0.289 | 41.8% | 12.5% | 38.9% | 27.2% | 1B | $3,000 | 1B/3B | $4,000 | N/A | N/A |
Elite Plays – Nomar Mazara and Shin-Soo Choo
Secondary Plays – Elvis Andrus and Rougned Odor
Stackability – YELLOW – A viable mini-stack in cash games and full stack in GPPs.
NY Yankees
The Yankees have one of the highest implied team totals on the entire. If you are plying the very early slate, this is the top offense. Bibens-Dirkx MLB numbers look impressive with a .274 wOBA vs. LH and .269 vs. RH hitters. The bulk of those numbers were achieved pitching in high leverage spots out of the bullpen. You aren’t going to get away with a 41.2% fy ball rate and 37.2% hard contact rate against this Yankees offense. The preferred options are the Yankees power hitters in Brett Gardner, Aaron Judge and Gary Sanchez. The latter two have a wOBA over .400 against RH pitching. Matt Holliday and just about everyone that makes the lineup today is also viable.
Projected Lineup (Splits vs. RH Pitching)
| # | Player | Bats | wOBA | xwOBA | ISO | HC% | BB% | K% | GB% | FD Pos. | FD Sal. | DK Pos. | DK Sal. | FDRFT Pos. | FDRFT Sal. |
|---|---|---|---|---|---|---|---|---|---|---|---|---|---|---|---|
| 1 | Brett Gardner | LEFT | 0.344 | 0.326 | 0.149 | 30.7% | 12.2% | 17.7% | 47.7% | OF | $3,800 | OF | $4,400 | N/A | N/A |
| 2 | Aaron Hicks | SWITCH | 0.342 | 0.311 | 0.168 | 26.5% | 12.6% | 18.1% | 46.1% | OF | $3,300 | OF | $4,400 | N/A | N/A |
| 3 | Aaron Judge | RIGHT | 0.415 | 0.415 | 0.320 | 49.4% | 12.5% | 33.4% | 38.0% | OF | $4,900 | OF | $5,700 | N/A | N/A |
| 4 | Matt Holliday | RIGHT | 0.352 | 0.361 | 0.212 | 35.7% | 9.8% | 20.1% | 49.8% | 1B | $3,600 | 1B | $4,300 | N/A | N/A |
| 5 | Starlin Castro | RIGHT | 0.336 | 0.311 | 0.181 | 31.8% | 3.6% | 18.9% | 49.2% | 2B | $3,300 | 2B | $3,900 | N/A | N/A |
| 6 | Gary Sanchez | RIGHT | 0.433 | 0.390 | 0.316 | 38.3% | 9.0% | 22.1% | 47.8% | C | $3,800 | C | $5,000 | N/A | N/A |
| 7 | Didi Gregorius | LEFT | 0.313 | 0.263 | 0.178 | 24.4% | 3.1% | 15.6% | 41.6% | SS | $3,100 | SS | $4,000 | N/A | N/A |
| 8 | Chris Carter | RIGHT | 0.334 | 0.347 | 0.242 | 39.3% | 11.6% | 34.4% | 29.9% | 1B | $2,300 | 1B | $3,400 | N/A | N/A |
| 9 | Ronald Torreyes | RIGHT | 0.297 | 0.267 | 0.119 | 20.6% | 3.2% | 10.8% | 51.3% | SS | $2,100 | 3B/SS | $2,900 | N/A | N/A |
Elite Plays – Brett Gardner, Aaron Judge and Gary Sanchez
Secondary Plays – Matt Holliday
Stackability – GREEN – A viable full stack in cash games and GPPs.
Oakland at Chicago White Sox – 2:10 PM ET
| Oakland | Chicago White Sox | ||||||||||||||
 | Daniel Gossett |  | James Shields | ||||||||||||
| RIGHT | RIGHT | ||||||||||||||
| Vegas Moneyline | Vegas Over/Under | ||||||||||||||
| CWS-105 | 10.0 | ||||||||||||||
| Stats | wOBA | xwOBA | HC% | BB% | K% | GB% | Stats | wOBA | xwOBA | HC% | BB% | K% | GB% | ||
|---|---|---|---|---|---|---|---|---|---|---|---|---|---|---|---|
| SP vs. Left (2016-17) | 0.332 | 0.370 | 55.6% | 0.0% | 0.0% | 62.5% | SP vs. Left (2016-17) | 0.368 | 0.350 | 28.0% | 11.6% | 14.5% | 43.4% | ||
| SP vs. Right (2016-17) | 0.615 | 0.515 | 57.1% | 11.1% | 11.1% | 42.9% | SP vs. Right (2016-17) | 0.370 | 0.360 | 38.8% | 9.1% | 19.3% | 35.7% | ||
Pitcher Grind Down
| Daniel Gossett | |||||||||
 | FanDuel | DraftKings | FantasyDraft | ||||||
| Salary: | $6,400 | Salary: | $5,400 | Salary: | $10,800 | ||||
| Salary Rank: | 26 of 30 | Salary Rank: | 22 of 30 | Salary Rank: | 21 of 30 | ||||
| Stats | Starts | SIERA | ERA | K% | BB% | GB% | HC% | SC% | |
|---|---|---|---|---|---|---|---|---|---|
| 2017 | 1 | 5.95 | 16.20 | 5.6% | 5.6% | 53.3% | 56.3% | 18.8% | |
The second game of the day, kicks off the afternoon slate on most sites. The table above is missing one of Gossett’s two starts this season. He was terrible in his first start against Miami allowing six earned runs in just 3.1 innings. He was able to handle the Astros powerful offense in the following start allowing just two earned runs in 6.2 innings. The book on Gossett is still open. In the minor leagues he showed great control with a 46.5% ground ball rate or higher at every stop. The strikeouts dipped to around 21% though as he rose through the ranks.
Quick Breakdown: Gosset comes with more risk than we really need to take on today. The White Sox are usually an offense we pick on with RH pitching as they own a 22.6% K rate, .301 wOBA and 84 wRC+. Gossett isn’t the type of RH pitcher we would ideally want though.
| James Shields | |||||||||
 | FanDuel | DraftKings | FantasyDraft | ||||||
| Salary: | $7,300 | Salary: | $6,200 | Salary: | $12,300 | ||||
| Salary Rank: | 19 of 30 | Salary Rank: | 17 of 30 | Salary Rank: | 17 of 30 | ||||
| Stats | Starts | SIERA | ERA | K% | BB% | GB% | HC% | SC% | |
|---|---|---|---|---|---|---|---|---|---|
| 2016 | 33 | 5.12 | 5.85 | 16.4% | 10.0% | 40.4% | 33.8% | 15.3% | |
| 2017 | 3 | 5.31 | 1.62 | 23.2% | 14.5% | 27.9% | 27.9% | 27.9% | |
James Shields is a tough pitcher to figure out. His 5.31 SIERA through three starts says he’s still the pitcher he was last season in 33 starts. The runs really haven’t been there this year though with a 1.62 ERA. It’s easy to see the reason though. Shields has a 98.2% left on base (LOB) rate this season. That number certainly isn’t going to hold up. He’s also allowing a .203 BABIP which is also going to regress. THe Athletics check in with a 25%K rate, .319 wOBA and 101 wRC+ for RH pitching.
Quick Breakdown: At some point, regression is coming for James Shields and he’s going to allow runs and home runs like he did last season. He’s certainly not a viable pitching option even against an Athletics team that will strikeout. Stacking against Shields or at least grabbing some Athletics power does sound like a good idea though.
Batter Grind Down
Oakland
Shields owns a .368 wOBA vs. LH and .370 wOBA vs. RH hitters the past two seasons. Matt Joyce has a .354 wOBA against RH pitching and usually gets a favorable lineup spot. He’s an excellent option here. You also can’t go wrong with Khris Davis and Yonder Alonso who both hit RH pitching well and generate hard contact at over 35%.
Projected Lineup (Splits vs. RH Pitching)
| # | Player | Bats | wOBA | xwOBA | ISO | HC% | BB% | K% | GB% | FD Pos. | FD Sal. | DK Pos. | DK Sal. | FDRFT Pos. | FDRFT Sal. |
|---|---|---|---|---|---|---|---|---|---|---|---|---|---|---|---|
| 1 | Matt Joyce | LEFT | 0.354 | 0.368 | 0.215 | 37.6% | 18.0% | 22.0% | 41.2% | OF | $3,000 | OF | $3,900 | RF | $7,800 |
| 2 | Matt Olson | LEFT | 0.238 | 0.262 | 0.038 | 22.2% | 25.7% | 22.9% | 38.9% | OF | $2,200 | OF | $2,000 | LF | $3,900 |
| 3 | Jed Lowrie | SWITCH | 0.326 | 0.328 | 0.136 | 32.4% | 8.6% | 16.6% | 35.7% | 2B | $2,600 | 2B | $3,500 | 2B | $6,800 |
| 4 | Khris Davis | RIGHT | 0.346 | 0.363 | 0.275 | 39.7% | 7.3% | 29.2% | 42.6% | OF | $3,900 | OF | $4,100 | LF | $8,100 |
| 5 | Yonder Alonso | LEFT | 0.339 | 0.369 | 0.168 | 34.8% | 10.3% | 16.3% | 38.9% | 1B | $2,900 | 1B | $3,800 | 1B | $7,500 |
| 6 | Ryon Healy | RIGHT | 0.347 | 0.335 | 0.225 | 35.6% | 4.0% | 24.7% | 39.9% | 3B | $3,100 | 1B/3B | $3,600 | 3B | $7,200 |
| 7 | Jaycob Brugman | LEFT | 0.257 | 0.249 | 0.000 | 21.7% | 9.4% | 18.8% | 56.5% | OF | $2,200 | OF | $2,600 | CF | $5,100 |
| 8 | Josh Phegley | RIGHT | 0.266 | 0.299 | 0.135 | 32.9% | 3.9% | 17.5% | 35.4% | C | $2,100 | C | $2,400 | C | $4,800 |
| 9 | Adam Rosales | RIGHT | 0.286 | 0.257 | 0.179 | 31.5% | 5.8% | 31.4% | 34.4% | 2B | $2,300 | SS | $2,400 | 3B | $4,800 |
Elite Plays – Matt Joyce
Secondary Plays – Khris Davis and Yonder Alonso
Stackability – YELLOW – A viable mini-stack in cash games and full stack in GPPs.
Chicago White Sox
The White Sox offer a sneaky value stack against Daniel Gossett. He’s shown some ground ball tendencies but he’s also been plenty hit able at the MLB level. The White Sox offer a sneaky source of value on the early slate. Gossett has only faced 44 MLB hitters but is allowing a .464 wOBA to RH and .214 wOBA to LH hitters. This is a great spot for Jose Abreu, Avisail Garcia and Melky Cabrera.
Projected Lineup (Splits vs. RH Pitching)
| # | Player | Bats | wOBA | xwOBA | ISO | HC% | BB% | K% | GB% | FD Pos. | FD Sal. | DK Pos. | DK Sal. | FDRFT Pos. | FDRFT Sal. |
|---|---|---|---|---|---|---|---|---|---|---|---|---|---|---|---|
| 1 | Alen Hanson | SWITCH | 0.250 | 0.237 | 0.094 | 22.9% | 3.4% | 17.0% | 48.5% | 2B | $2,300 | 2B | $3,500 | 2B | $6,900 |
| 2 | Melky Cabrera | SWITCH | 0.329 | 0.329 | 0.132 | 29.1% | 7.9% | 10.1% | 46.4% | OF | $3,300 | OF | $3,600 | LF | $7,200 |
| 3 | Jose Abreu | RIGHT | 0.340 | 0.345 | 0.165 | 33.5% | 6.0% | 16.9% | 45.8% | 1B | $3,700 | 1B | $4,400 | 1B | $8,700 |
| 4 | Avisail Garcia | RIGHT | 0.326 | 0.330 | 0.165 | 32.4% | 5.9% | 24.5% | 53.4% | OF | $3,500 | OF | $4,200 | RF | $8,000 |
| 5 | Todd Frazier | RIGHT | 0.319 | 0.320 | 0.223 | 31.1% | 10.0% | 22.8% | 38.8% | 3B | $3,500 | 3B | $3,800 | 3B | $7,500 |
| 6 | Matt Davidson | RIGHT | 0.354 | 0.309 | 0.323 | 50.0% | 4.5% | 44.7% | 31.8% | 1B | $3,200 | 1B/3B | $4,000 | 3B | $7,600 |
| 7 | Tim Anderson | RIGHT | 0.294 | 0.274 | 0.150 | 30.8% | 3.0% | 26.9% | 50.7% | SS | $2,800 | SS | $3,500 | SS | $6,900 |
| 8 | Omar Narvaez | LEFT | 0.270 | 0.298 | 0.029 | 14.3% | 10.9% | 12.5% | 42.5% | C | $2,200 | C | $2,500 | C | $4,800 |
| 9 | Yolmer Sanchez | SWITCH | 0.299 | 0.280 | 0.141 | 23.9% | 4.9% | 23.4% | 40.3% | 2B | $2,600 | 2B | $3,500 | 2B | $6,800 |
Elite Plays – Jose Abreu
Secondary Plays – Avisail Garcia and Melky Cabrera
Stackability – GREEN – A viable full stack in cash games and GPPs.
Toronto at Kansas City – 2:15 PM ET
| Toronto | Kansas City | ||||||||||||||
 | Marco Estrada |  | Jason Vargas | ||||||||||||
| RIGHT | LEFT | ||||||||||||||
| Vegas Moneyline | Vegas Over/Under | ||||||||||||||
| KC -101 | 9.0 | ||||||||||||||
| Stats | wOBA | xwOBA | HC% | BB% | K% | GB% | Stats | wOBA | xwOBA | HC% | BB% | K% | GB% | ||
|---|---|---|---|---|---|---|---|---|---|---|---|---|---|---|---|
| SP vs. Left (2016-17) | 0.280 | 0.276 | 27.9% | 8.1% | 24.2% | 35.8% | SP vs. Left (2016-17) | 0.379 | 0.348 | 29.9% | 2.6% | 10.4% | 35.8% | ||
| SP vs. Right (2016-17) | 0.312 | 0.323 | 33.9% | 7.9% | 23.9% | 32.1% | SP vs. Right (2016-17) | 0.239 | 0.255 | 30.7% | 6.5% | 23.1% | 37.1% | ||
Pitcher Grind Down
| Marco Estrada | |||||||||
 | FanDuel | DraftKings | FantasyDraft | ||||||
| Salary: | $8,100 | Salary: | $7,800 | Salary: | $15,200 | ||||
| Salary Rank: | 13 of 30 | Salary Rank: | 11 of 30 | Salary Rank: | 12 of 30 | ||||
| Stats | Starts | SIERA | ERA | K% | BB% | GB% | HC% | SC% | |
|---|---|---|---|---|---|---|---|---|---|
| 2016 | 29 | 4.35 | 3.48 | 22.8% | 9.0% | 33.5% | 31.3% | 21.1% | |
| 2017 | 14 | 3.63 | 4.54 | 26.6% | 5.8% | 34.9% | 30.2% | 15.5% | |
This is the final game of the very early slate and is probably where you are getting your pitcher from. The sites have caught on to the idea that Marco Estrada is a solid pitcher but not quite an ace. He has a 26.6% K rate, 4.54 ERA and 5.8% BB rate through 14 starts this season. He’ll take on a Royals offense that owns a 21.1% K rate, .302 wOBA and 81 wRC+.
Quick Breakdown: Estrada is the best option for all formats on the FanDuel very early slate. He’s a solid SP2 on DK for the early slate that includes seven games. Estrada is a good enough pitcher to handle this Royals offense.
| Jason Vargas | |||||||||
 | FanDuel | DraftKings | FantasyDraft | ||||||
| Salary: | $8,700 | Salary: | $8,300 | Salary: | $16,200 | ||||
| Salary Rank: | 9 of 30 | Salary Rank: | 9 of 30 | Salary Rank: | 9 of 30 | ||||
| Stats | Starts | SIERA | ERA | K% | BB% | GB% | HC% | SC% | |
|---|---|---|---|---|---|---|---|---|---|
| 2016 | 3 | 3.96 | 2.25 | 23.4% | 6.4% | 36.4% | 33.3% | 15.2% | |
| 2017 | 13 | 4.35 | 2.10 | 20.1% | 5.6% | 36.9% | 30.1% | 19.3% | |
Jason Vargas is really two different pitchers. Over the past two seasons he owns a .379 wOBA and 10.4 % K rate vs. LH hitting. Against RH hitting, he checks in at .239 wOBA and 23.1% K rate. Overall, Vargas has been decent this season with a 2.1 ERA and 20.1% K rate. The Blue Jays are not a terrible matchup for Vargas. They will probably only have two LH hitters in the lineup. Overall, they own a 21.6% K rate, .316 wOBA and .94 wRC+ against LH pitching.
Quick Breakdown: Vargas is the second-best best pitcher on the very early slate but likely someone I would only consider in tournaments as an SP2 elsewhere on the larger slates.
Batter Grind Down
Toronto
As I mentioned above, you want to target Vargas with LH hitters as he owns a .379 wOBA and 10% K rate. That really just leaves us with Justin Smoak and Kendrys Morales. Of the two, Morales is the better hitter against LH pitching with a .383 wOBA. You could also consider Josh Donaldson against any LH pitcher as he owns a .408 wOBA.
Projected Lineup (Splits vs. LH Pitching)
| # | Player | Bats | wOBA | xwOBA | ISO | HC% | BB% | K% | GB% | FD Pos. | FD Sal. | DK Pos. | DK Sal. | FDRFT Pos. | FDRFT Sal. |
|---|---|---|---|---|---|---|---|---|---|---|---|---|---|---|---|
| 1 | Jose Bautista | RIGHT | 0.279 | 0.339 | 0.150 | 34.6% | 14.0% | 21.5% | 43.6% | OF | $3,800 | OF | $3,800 | RF | $7,500 |
| 2 | Russell Martin | RIGHT | 0.316 | 0.361 | 0.163 | 45.5% | 16.6% | 29.4% | 42.0% | C | $2,700 | C | $3,700 | C | $7,200 |
| 3 | Josh Donaldson | RIGHT | 0.408 | 0.418 | 0.245 | 39.3% | 19.0% | 14.1% | 33.6% | 3B | $3,800 | 3B | $4,300 | 3B | $8,400 |
| 4 | Justin Smoak | SWITCH | 0.338 | 0.362 | 0.175 | 34.2% | 9.8% | 15.7% | 40.4% | 1B | $3,600 | 1B | $4,900 | 1B | $9,600 |
| 5 | Kendrys Morales | SWITCH | 0.383 | 0.397 | 0.229 | 40.0% | 4.7% | 20.0% | 38.9% | 1B | $3,700 | 1B | $4,100 | 1B | $8,000 |
| 6 | Troy Tulowitzki | RIGHT | 0.304 | 0.317 | 0.146 | 30.4% | 9.8% | 15.0% | 44.3% | SS | $2,700 | SS | $3,400 | SS | $6,800 |
| 7 | Steve Pearce | RIGHT | 0.402 | 0.368 | 0.295 | 45.1% | 11.8% | 23.6% | 36.6% | OF | $2,800 | OF | $3,600 | 1B | $7,200 |
| 8 | Kevin Pillar | RIGHT | 0.335 | 0.308 | 0.164 | 35.8% | 3.7% | 14.7% | 36.4% | OF | $2,700 | OF | $3,400 | CF | $6,600 |
| 9 | Darwin Barney | RIGHT | 0.304 | 0.290 | 0.082 | 25.4% | 8.1% | 18.0% | 41.0% | SS | $2,200 | 2B/3B | $2,300 | 2B | $4,500 |
Elite Plays – None
Secondary Plays – Kendrys Morales and Justin Smoak
Stackability – ORANGE – A viable stack in large field GPPs.
Kansas City
The Royals are less exciting today against Marco Estrada. What we know about Estrada is that he is a fly ball pitcher who manages to generate a decent amount of soft contact at 15.5%. The Royals don’t necessarily have a lot of power though which is a big part of the reason why you can pitch Estrada today. You can hunt for a home run here with Jorge Bonifacio, Eric Hosmer or Mike Moustakas though
Projected Lineup (Splits vs. RH Pitching)
| # | Player | Bats | wOBA | xwOBA | ISO | HC% | BB% | K% | GB% | FD Pos. | FD Sal. | DK Pos. | DK Sal. | FDRFT Pos. | FDRFT Sal. |
|---|---|---|---|---|---|---|---|---|---|---|---|---|---|---|---|
| 1 | Whit Merrifield | RIGHT | 0.297 | 0.296 | 0.122 | 32.2% | 4.6% | 18.1% | 42.0% | 2B | $3,200 | 2B | $3,400 | IF/OF | $6,600 |
| 2 | Jorge Bonifacio | RIGHT | 0.351 | 0.364 | 0.236 | 34.0% | 7.9% | 24.3% | 38.3% | OF | $2,700 | OF | $3,600 | RF | $7,200 |
| 3 | Lorenzo Cain | RIGHT | 0.326 | 0.312 | 0.128 | 30.3% | 7.4% | 20.8% | 48.0% | OF | $3,700 | OF | $4,100 | CF | $8,100 |
| 4 | Eric Hosmer | LEFT | 0.351 | 0.357 | 0.168 | 34.4% | 9.6% | 18.4% | 56.8% | 1B | $3,400 | 1B | $3,900 | 1B | $7,800 |
| 5 | Salvador Perez | RIGHT | 0.321 | 0.309 | 0.200 | 37.6% | 3.4% | 20.4% | 33.8% | C | $3,300 | C | $3,900 | C | $7,800 |
| 6 | Mike Moustakas | LEFT | 0.364 | 0.370 | 0.277 | 35.7% | 6.9% | 15.5% | 35.7% | 3B | $3,500 | 3B | $4,100 | 3B | $8,000 |
| 7 | Brandon Moss | LEFT | 0.310 | 0.328 | 0.265 | 38.5% | 9.2% | 31.1% | 26.2% | 1B | $2,300 | OF | $2,900 | IF/OF | $5,600 |
| 8 | Alcides Escobar | RIGHT | 0.257 | 0.248 | 0.079 | 22.8% | 3.3% | 16.7% | 46.6% | SS | $2,600 | SS | $2,200 | SS | $4,100 |
| 9 | Alex Gordon | LEFT | 0.292 | 0.327 | 0.149 | 35.8% | 10.2% | 26.4% | 39.4% | OF | $2,200 | OF | $2,600 | LF | $5,200 |
Elite Plays – None
Secondary Plays – Jorge Bonifacio
Stackability – ORANGE – A viable stack in large field GPPs.
Cincinnati at Washington – 4:05 PM ET
| Cincinnati | Washington | ||||||||||||||
 | Homer Bailey |  | Joe Ross | ||||||||||||
| RIGHT | RIGHT | ||||||||||||||
| Vegas Moneyline | Vegas Over/Under | ||||||||||||||
| WAS-155 | 9.5 | ||||||||||||||
| Stats | wOBA | xwOBA | HC% | BB% | K% | GB% | Stats | wOBA | xwOBA | HC% | BB% | K% | GB% | ||
|---|---|---|---|---|---|---|---|---|---|---|---|---|---|---|---|
| SP vs. Left (2016-17) | 0.420 | 0.403 | 51.5% | 6.4% | 21.3% | 46.9% | SP vs. Left (2016-17) | 0.373 | 0.357 | 35.0% | 8.3% | 18.9% | 38.5% | ||
| SP vs. Right (2016-17) | 0.311 | 0.295 | 14.3% | 6.3% | 26.6% | 43.9% | SP vs. Right (2016-17) | 0.291 | 0.295 | 28.9% | 4.1% | 23.3% | 44.2% | ||
Pitcher Grind Down
| Homer Bailey | |||||||||
 | FanDuel | DraftKings | FantasyDraft | ||||||
| Salary: | $6,500 | Salary: | $4,400 | Salary: | $8,800 | ||||
| Salary Rank: | 25 of 30 | Salary Rank: | 30 of 30 | Salary Rank: | 28 of 30 | ||||
| Stats | Starts | SIERA | ERA | K% | BB% | GB% | HC% | SC% | |
|---|---|---|---|---|---|---|---|---|---|
| 2016 | 6 | 3.55 | 6.65 | 24.3% | 6.3% | 45.2% | 30.7% | 16.0% | |
Homer Bailey will make his first start of the season. He’s set to return from an elbow injury that limited him to just nine starts last season. It’s tough to know what to expect from Bailey in this spot. He had a 24.3% K rate, 6.3% BB rate, and 45.3% ground ball rate. At one point, Bailey was one of the Reds best prospects but we should keep our expectations in check here. The Nationals own a 19.4% K rate, .344 wOBA and 110 wRC+ versus RH pitching this season.
Quick Breakdown: Bailey is only in play in the deepest of GPPs today as an SP2. Realistically, it’s best to simply take a wait and see approach here given the difficult matchup.
| Joe Ross | |||||||||
 | FanDuel | DraftKings | FantasyDraft | ||||||
| Salary: | $7,900 | Salary: | $5,900 | Salary: | $11,700 | ||||
| Salary Rank: | 14 of 30 | Salary Rank: | 18 of 30 | Salary Rank: | 18 of 30 | ||||
| Stats | Starts | SIERA | ERA | K% | BB% | GB% | HC% | SC% | |
|---|---|---|---|---|---|---|---|---|---|
| 2016 | 19 | 4.06 | 3.43 | 20.8% | 6.5% | 42.6% | 29.5% | 16.3% | |
| 2017 | 8 | 3.98 | 6.39 | 22.2% | 5.2% | 39.0% | 37.1% | 21.4% | |
Joe Ross is also a tough pitcher to figure out. Throughout his career, Ross has always had a problem with LH hitters. He owns a career .366 wOBA vs. LH compared to .266 vs. RH hitters. That hasn’t changed this season and likely won’t in the future. The Reds are a somewhat difficult matchup for RH pitching with a 20.9% K rate, .332 wOBA and 101 wRC+. They also own a .191 ISO which is 10th best in the league.
Quick Breakdown: All things considered, this probably isn’t the ideal spot to roll out Joe Ross. The Reds have some dangerous LH power in their lineup. Ross can be considered in tournaments on DK at his bargain price though.
Batter Grind Down
Cincinnati
The ideal targets here are Reds LH hitters. That obviously starts with Joey Votto who owns a .423 wOBA vs. RH pitching. Scooter Gennett is also worth a look if he’s batting near the top of the order. He owns a .326 wOBA vs. RH pitching. Finally, Scott Schebler owns a .341 wOBA and is in play against someone like Ross who struggles against Lh hitters.
Projected Lineup (Splits vs. RH Pitching)
| # | Player | Bats | wOBA | xwOBA | ISO | HC% | BB% | K% | GB% | FD Pos. | FD Sal. | DK Pos. | DK Sal. | FDRFT Pos. | FDRFT Sal. |
|---|---|---|---|---|---|---|---|---|---|---|---|---|---|---|---|
| 1 | Billy Hamilton | SWITCH | 0.302 | 0.252 | 0.078 | 18.5% | 8.9% | 20.1% | 47.5% | OF | $2,900 | OF | $4,300 | CF | $8,400 |
| 2 | Scooter Gennett | LEFT | 0.326 | 0.292 | 0.175 | 31.3% | 5.4% | 20.1% | 42.9% | 2B | $2,700 | 2B/OF | $3,900 | 2B | $7,800 |
| 3 | Joey Votto | LEFT | 0.423 | 0.436 | 0.257 | 40.1% | 17.3% | 14.3% | 37.2% | 1B | $4,400 | 1B | $4,700 | 1B | $9,200 |
| 4 | Adam Duvall | RIGHT | 0.332 | 0.326 | 0.253 | 36.6% | 5.8% | 27.0% | 33.7% | OF | $3,600 | OF | $4,400 | IF/OF | $8,400 |
| 5 | Eugenio Suarez | RIGHT | 0.316 | 0.315 | 0.155 | 33.2% | 8.2% | 23.6% | 40.9% | 3B | $3,100 | 3B | $3,700 | 3B | $7,200 |
| 6 | Scott Schebler | LEFT | 0.341 | 0.335 | 0.215 | 35.9% | 7.9% | 21.4% | 49.3% | OF | $3,400 | OF | $4,100 | RF | $8,000 |
| 7 | Devin Mesoraco | RIGHT | 0.298 | 0.297 | 0.198 | 22.1% | 8.4% | 18.9% | 41.2% | C | $2,600 | C | $3,100 | C | $6,000 |
| 8 | Jose Peraza | RIGHT | 0.309 | 0.297 | 0.093 | 19.6% | 1.8% | 13.7% | 43.7% | SS | $2,300 | 2B | $3,100 | 2B | $6,000 |
| 9 | Homer Bailey | RIGHT | 0.088 | 0.077 | 0.000 | 0.0% | 0.0% | 10.0% | 100.0% | P | $6,500 | P | $4,400 | P | $8,800 |
Elite Plays – Joey Votto
Secondary Plays – Scooter Gennett and Scott Schebler
Stackability – YELLOW – A viable mini-stack in cash games and full stack in GPPs.
Washington
Given that Homer Bailley only started nine games last season it is best to look at his career numbers. He owns a .333 wOBA vs. LH and .310 wOBA vs. RH hitters. He’s generally always hovered around a 45% ground ball rate and 20% K rate. Those numbers are nothing special but they are essentially league average for a SP. We can target Bryce Harper and Daniel Murphy here as we would against any RH pitcher. I wouldn’t call them elite plays though. As far as the rest of the Nationals, this is more of a stack or nothing spot.
Projected Lineup (Splits vs. RH Pitching)
| # | Player | Bats | wOBA | xwOBA | ISO | HC% | BB% | K% | GB% | FD Pos. | FD Sal. | DK Pos. | DK Sal. | FDRFT Pos. | FDRFT Sal. |
|---|---|---|---|---|---|---|---|---|---|---|---|---|---|---|---|
| 1 | Trea Turner | RIGHT | 0.382 | 0.329 | 0.232 | 30.8% | 4.5% | 18.3% | 47.5% | SS | $4,200 | SS | $5,300 | IF/OF | $10,400 |
| 2 | Brian Goodwin | LEFT | 0.317 | 0.264 | 0.224 | 33.3% | 5.7% | 25.7% | 45.7% | OF | $2,400 | OF | $3,500 | RF | $6,800 |
| 3 | Bryce Harper | LEFT | 0.382 | 0.397 | 0.245 | 34.9% | 18.3% | 15.5% | 39.4% | OF | $4,800 | OF | $5,600 | RF | $10,800 |
| 4 | Ryan Zimmerman | RIGHT | 0.331 | 0.341 | 0.198 | 36.4% | 5.7% | 23.0% | 44.7% | 1B | $4,100 | 1B | $4,800 | 1B | $9,200 |
| 5 | Daniel Murphy | LEFT | 0.412 | 0.396 | 0.247 | 38.2% | 6.7% | 8.8% | 35.9% | 2B | $4,100 | 2B | $5,200 | 2B | $10,200 |
| 6 | Anthony Rendon | RIGHT | 0.343 | 0.344 | 0.189 | 34.8% | 9.7% | 17.8% | 37.1% | 3B | $3,600 | 3B | $4,700 | 3B | $9,200 |
| 7 | Matt Wieters | SWITCH | 0.307 | 0.320 | 0.161 | 33.3% | 6.4% | 17.8% | 37.3% | C | $2,400 | C | $3,100 | C | $6,000 |
| 8 | Michael Taylor | RIGHT | 0.284 | 0.273 | 0.167 | 31.6% | 5.2% | 31.6% | 41.5% | OF | $3,300 | OF | $4,000 | CF | $7,600 |
| 9 | Joe Ross | RIGHT | 0.180 | 0.151 | 0.023 | 15.4% | 2.2% | 41.3% | 76.0% | P | $7,900 | P | $5,900 | P | $11,700 |
Elite Plays – None
Secondary Plays – Bryce Harper and Daniel Murphy
Stackability – ORANGE – A viable stack in large field GPPs.
Milwaukee at Atlanta – 4:10 PM ET
| Milwaukee | Atlanta | ||||||||||||||
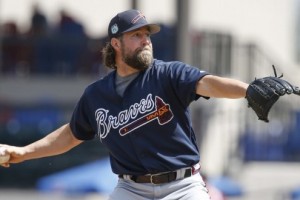
 | Matt Garza |  | R.A. Dickey | ||||||||||||
| RIGHT | RIGHT | ||||||||||||||
| Vegas Moneyline | Vegas Over/Under | ||||||||||||||
| ATL-106 | 9.5 | ||||||||||||||
| Stats | wOBA | xwOBA | HC% | BB% | K% | GB% | Stats | wOBA | xwOBA | HC% | BB% | K% | GB% | ||
|---|---|---|---|---|---|---|---|---|---|---|---|---|---|---|---|
| SP vs. Left (2016-17) | 0.353 | 0.362 | 37.1% | 10.3% | 11.9% | 48.5% | SP vs. Left (2016-17) | 0.343 | 0.341 | 28.5% | 9.9% | 14.8% | 41.8% | ||
| SP vs. Right (2016-17) | 0.305 | 0.291 | 33.7% | 4.9% | 19.9% | 53.6% | SP vs. Right (2016-17) | 0.350 | 0.348 | 30.5% | 8.3% | 17.0% | 46.7% | ||
Pitcher Grind Down
| Matt Garza | |||||||||
 | FanDuel | DraftKings | FantasyDraft | ||||||
| Salary: | $7,500 | Salary: | $5,700 | Salary: | $11,200 | ||||
| Salary Rank: | 17 of 30 | Salary Rank: | 19 of 30 | Salary Rank: | 19 of 30 | ||||
| Stats | Starts | SIERA | ERA | K% | BB% | GB% | HC% | SC% | |
|---|---|---|---|---|---|---|---|---|---|
| 2016 | 19 | 4.60 | 4.51 | 15.2% | 7.8% | 54.8% | 34.9% | 19.0% | |
| 2017 | 9 | 4.61 | 4.17 | 18.1% | 6.8% | 42.7% | 36.4% | 11.0% | |
Matt Garza has not been anything special through nine starts this season. He owns a 4.17 ERA, 18.1% K rate and 6.8% BB rate. Garza had shown excellent ground ball ability last season at 54.3% but that has dropped to 42.7% this year. He still has a problem with hard contact as well allowing 36.4%. The Braves check in at 19.5% K rate, .320 wOBA and 94 wRC+ vs. RH pitching. Those aren’t necessarily the type of numbers we want to target.
Quick Breakdown: Matt Garza is not a great option today as he only owns an 18.1% K rate and the Braves don’t really help out in that department as they check in at 19.5%.
| R.A. Dickey | |||||||||
 | FanDuel | DraftKings | FantasyDraft | ||||||
| Salary: | $7,200 | Salary: | $5,300 | Salary: | $10,400 | ||||
| Salary Rank: | 20 of 30 | Salary Rank: | 23 of 30 | Salary Rank: | 23 of 30 | ||||
| Stats | Starts | SIERA | ERA | K% | BB% | GB% | HC% | SC% | |
|---|---|---|---|---|---|---|---|---|---|
| 2016 | 29 | 4.81 | 4.46 | 17.3% | 8.7% | 42.1% | 30.0% | 22.7% | |
| 2017 | 13 | 5.43 | 5.35 | 13.3% | 9.8% | 49.6% | 28.9% | 25.0% | |
In two of his last three starts, R.A. Dickey has scored 28 or more DK points. While that sounds great, those starts were against San Francisco and Philadelphia. In the other start, he was dominated by the Nationals. This season, Dickey owns a 13.3% K rate, 5.35 ERA and 9.8% BB rate. He has a .343 wOBA vs. LH and .350 wOBA vs. RH hitters. The Brewers are usually a team we target with RH pitching as they own 24.6% K rate, .328 wOBA and 96 wRC+. They do own a .192 ISO though which ranks ninth..
Quick Breakdown: I’m not letting two good starts against the Phillies and Giants fool me. R.A. Dickey offers almost no strikeout upside. He can be avoided in everything but the deepest of tournaments.
Batter Grind Down
Milwaukee
Given that Dickey has a wOBA over .340 to hitters from both sides of the plate, we shouldn’t be afraid to use a Brewers here. Eric Sogard and Eric Thames each own a wOBA over .425 against RH pitching. They are strong plays in this matchup. Travis Shaw is also worth a look although he’s less exciting. He does have one career home run in 14 at bats off Dickey.
Projected Lineup (Splits vs. RH Pitching)
| # | Player | Bats | wOBA | xwOBA | ISO | HC% | BB% | K% | GB% | FD Pos. | FD Sal. | DK Pos. | DK Sal. | FDRFT Pos. | FDRFT Sal. |
|---|---|---|---|---|---|---|---|---|---|---|---|---|---|---|---|
| 1 | Eric Sogard | LEFT | 0.425 | 0.402 | 0.164 | 24.1% | 18.1% | 10.8% | 37.9% | 2B | $3,600 | 2B/SS | $4,100 | 2B | $8,100 |
| 2 | Eric Thames | LEFT | 0.432 | 0.373 | 0.348 | 43.2% | 19.0% | 22.6% | 40.9% | 1B | $3,400 | 1B/OF | $4,500 | 1B | $8,700 |
| 3 | Domingo Santana | RIGHT | 0.339 | 0.339 | 0.175 | 35.2% | 11.6% | 31.4% | 45.5% | OF | $3,100 | OF | $4,300 | RF | $8,400 |
| 4 | Travis Shaw | LEFT | 0.344 | 0.339 | 0.201 | 36.5% | 8.7% | 22.7% | 38.9% | 3B | $3,600 | 3B | $4,200 | 3B | $8,100 |
| 5 | Hernan Perez | RIGHT | 0.316 | 0.298 | 0.167 | 31.2% | 4.3% | 18.4% | 48.4% | OF | $3,200 | 3B/OF | $3,700 | IF/OF | $7,200 |
| 6 | Manny Pina | RIGHT | 0.351 | 0.317 | 0.195 | 26.6% | 6.9% | 17.2% | 35.2% | C | $2,400 | C | $3,600 | C | $7,200 |
| 7 | Keon Broxton | RIGHT | 0.312 | 0.290 | 0.204 | 38.8% | 9.2% | 38.7% | 43.6% | OF | $2,700 | OF | $4,100 | CF | $8,000 |
| 8 | Orlando Arcia | RIGHT | 0.267 | 0.244 | 0.122 | 25.7% | 4.4% | 21.6% | 55.1% | SS | $2,200 | SS | $3,200 | SS | $6,300 |
| 9 | Matt Garza | RIGHT | 0.133 | 0.145 | 0.000 | 6.7% | 6.5% | 41.9% | 91.7% | P | $7,500 | P | $5,700 | P | $11,200 |
Elite Plays – Eric Thames and Eric Sogard
Secondary Plays – Travis Shaw
Stackability – YELLOW – A viable mini-stack in cash games and full stack in GPPs.
Atlanta
Matt Garza is best targeted with LH hitters. He owns a .353 wOBA and lowly 11.9% K rate over the last two seasons vs. LH hitters. The only issue is the Braves do’t have a lot to offer when t comes to LH hitters. Matt Adams stands out as the best option as he owns a .350 wOBA vs. RH pitching. Ender Inciarte is also worth a look but he offers almost no power with a .103 ISO vs. RH pitching.
Projected Lineup (Splits vs. RH Pitching)
| # | Player | Bats | wOBA | xwOBA | ISO | HC% | BB% | K% | GB% | FD Pos. | FD Sal. | DK Pos. | DK Sal. | FDRFT Pos. | FDRFT Sal. |
|---|---|---|---|---|---|---|---|---|---|---|---|---|---|---|---|
| 1 | Ender Inciarte | LEFT | 0.316 | 0.296 | 0.103 | 26.4% | 8.3% | 13.5% | 42.9% | OF | $3,400 | OF | $4,300 | CF | $8,400 |
| 2 | Brandon Phillips | RIGHT | 0.330 | 0.306 | 0.128 | 28.6% | 3.2% | 12.2% | 47.0% | 2B | $3,300 | 2B | $3,900 | 2B | $7,600 |
| 3 | Nick Markakis | LEFT | 0.339 | 0.359 | 0.136 | 34.0% | 11.4% | 16.4% | 43.5% | OF | $3,500 | OF | $3,800 | RF | $7,500 |
| 4 | Matt Kemp | RIGHT | 0.340 | 0.352 | 0.217 | 36.8% | 4.9% | 23.9% | 40.4% | OF | $3,200 | OF | $4,300 | LF | $8,400 |
| 5 | Matt Adams | LEFT | 0.350 | 0.348 | 0.235 | 37.9% | 8.4% | 25.1% | 33.8% | 1B | $3,500 | 1B | $4,200 | 1B | $8,000 |
| 6 | Tyler Flowers | RIGHT | 0.367 | 0.343 | 0.155 | 41.8% | 8.0% | 25.1% | 41.8% | C | $3,000 | C | $3,700 | C | $7,200 |
| 7 | Dansby Swanson | RIGHT | 0.273 | 0.301 | 0.099 | 32.1% | 10.1% | 23.9% | 49.4% | SS | $2,800 | SS | $3,400 | SS | $6,800 |
| 8 | Johan Camargo | SWITCH | 0.242 | 0.258 | 0.115 | 27.8% | 0.0% | 33.3% | 52.9% | SS | $2,600 | 3B | $2,800 | SS | $5,400 |
| 9 | R.A. Dickey | RIGHT | 0.114 | 0.135 | 0.000 | 0.0% | 0.0% | 25.0% | 76.5% | P | $7,200 | P | $5,300 | P | $10,400 |