MLB Grind Down: Sunday, September 25th - Page Three

Jump to Page 1 2 3
LA Angels at Houston – 2:10 PM ET
| LA Angels | Houston | ||||||||
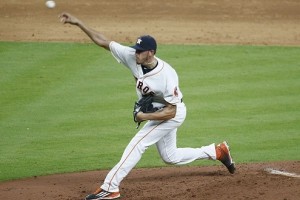
 | Daniel Wright |  | Joe Musgrove | ||||||
| RIGHT | RIGHT | ||||||||
| Vegas Moneyline | Vegas Over/Under | ||||||||
| HOU -180 | 9.0 | ||||||||
| Stats | wOBA | HR All. | HC% | K% | Stats | wOBA | HR All. | HC% | K% |
|---|---|---|---|---|---|---|---|---|---|
| SP vs. Left (2016) | 0.405 | 2 | 44.4% | 9.5% | SP vs. Left (2016) | 0.364 | 4 | 38.2% | 20.2% |
| SP vs. Right (2016) | 0.444 | 3 | 39.3% | 8.7% | SP vs. Right (2016) | 0.301 | 5 | 31.9% | 23.9% |
Pitcher Grind Down
| Daniel Wright | ||||||||||
 | FanDuel | DraftKings | ||||||||
| Salary: | $5,600 | Salary: | $4,000 | |||||||
| FPPG: | 7.1 | FPPG: | 1.1 | |||||||
| Pitcher Rating: | 23.8 | Pitcher Rank: | 30 | |||||||
| Statistics | Starts | PitchPS | SIERA | ERA | K% | BB% | SS% | GB% | FB% | HC% |
|---|---|---|---|---|---|---|---|---|---|---|
| L30 Days | 2 | 82.0 | 5.74 | 6.30 | 11.4% | 9.1% | 5.5% | 37.5% | 40.6% | 39.4% |
| 2016 | 5 | 96.2 | 5.43 | 7.48 | 9.1% | 4.6% | 5.8% | 37.0% | 38.0% | 41.8% |
Daniel Wright: This is not a guy we want on our teams today. Since being claimed by the Angels off of waivers, he has allowed 12 runs in just under 15 innings.
Home (2015-16):—ERA: 6.35 — K%: 9.4% — wOBA Allowed: 0.375
Away (2015-16):—ERA: 8.27 — K%: 8.9% — wOBA Allowed: 0.459
| Joe Musgrove | ||||||||||
 | FanDuel | DraftKings | ||||||||
| Salary: | $7,200 | Salary: | $7,100 | |||||||
| FPPG: | 27.3 | FPPG: | 14.1 | |||||||
| Pitcher Rating: | 66.6 | Pitcher Rank: | 12 | |||||||
| Statistics | Starts | PitchPS | SIERA | ERA | K% | BB% | SS% | GB% | FB% | HC% |
|---|---|---|---|---|---|---|---|---|---|---|
| L30 Days | 5 | 89.0 | 4.36 | 5.19 | 20.9% | 8.7% | 9.7% | 42.3% | 33.3% | 34.6% |
| 2016 | 9 | 97.9 | 3.95 | 4.42 | 22.3% | 7.0% | 10.0% | 44.0% | 35.2% | 34.6% |
Joe Musgrove: I am not a huge fan of pitching guys against the Angels because of the way they limit strikeouts. With that said, Musgrove has improved over each of his starts and looked really solid against the A’s. On this slate specifically, I do not hate the idea of having Musgrove shares.
Home (2015-16):—ERA: 1.86 — K%: 28.7% — wOBA Allowed: 0.238
Away (2015-16):—ERA: 7.27 — K%: 15.8% — wOBA Allowed: 0.419
Batter Grind Down
LA Angels
Angels: It is pretty much Mike Trout that we want to look at from this lineup as everyone else has been inconsistent or just not producing at all.
- Angels Offense (2016)
Team wOBA vs. RHP — 0.313 (18 of 30)
Team wOBA L30 Days — 0.310 (20 of 30)
Team ISO vs. RHP — 0.142 (26 of 30)
Team K% vs. RHP — 16.1% (1 of 30)
Pitches Per PA vs. RHP — 3.69 (30 of 30)
Runs Per Game — 4.35 (18 of 30)
Projected Run Total — 4.04 (23 of 30)
Projected Lineup
| # | Player | Bats | wOBA vs. RHP | ISO vs. RHP | HC% vs. RHP | wOBA L14 | FD Position | FD Salary | DK Position | DK Salary |
|---|---|---|---|---|---|---|---|---|---|---|
| 1 | Yunel Escobar | RIGHT | 0.318 | 0.064 | 27.0% | 0.275 | 3B | $2,800 | 3B | $3,100 |
| 2 | Kole Calhoun | LEFT | 0.327 | 0.158 | 35.4% | 0.277 | OF | $3,400 | OF | $3,200 |
| 3 | Mike Trout | RIGHT | 0.424 | 0.251 | 41.6% | 0.345 | OF | $4,600 | OF | $5,500 |
| 4 | Albert Pujols | RIGHT | 0.318 | 0.168 | 35.0% | 0.216 | 1B | $3,200 | 1B | $4,000 |
| 5 | C.J. Cron | RIGHT | 0.357 | 0.206 | 33.8% | 0.241 | 1B | $2,600 | 1B | $3,600 |
| 6 | Andrelton Simmons | RIGHT | 0.294 | 0.077 | 25.2% | 0.391 | SS | $2,800 | SS | $3,400 |
| 7 | Nick Buss | RIGHT | 0.310 | 0.193 | 29.2% | 0.272 | OF | $2,200 | OF | $2,500 |
| 8 | Carlos Perez | RIGHT | 0.251 | 0.121 | 23.9% | 0.215 | C | $2,100 | C | $2,200 |
| 9 | Cliff Pennington | SWITCH | 0.281 | 0.126 | 27.4% | 0.238 | SS | $2,000 | 2B/SS | $2,400 |
| Team Averages | — | 0.320 | 0.152 | 30.9% | 0.274 | — | — | — | — |
Elite Plays – Mike Trout
Secondary Plays – C.J. Cron , Kole Calhoun
Stackability – Red
Houston
Astros: Whenever a pitcher is pitching as bad as Wright, you have to take notice of the offense facing him. The Astros are a high-upside group to begin with and it would be foolish not to have some exposure here if you are playing in tournaments.
- Astros Offense (2016)
Team wOBA vs. RHP — 0.319 (12 of 30)
Team wOBA L30 Days — 0.306 (22 of 30)
Team ISO vs. RHP — 0.174 (10 of 30)
Team K% vs. RHP — 23.7% (27 of 30)
Pitches Per PA vs. RHP — 3.86 (15 of 30)
Runs Per Game — 4.54 (14 of 30)
Projected Run Total — 4.96 (3 of 30)
Projected Lineup
| # | Player | Bats | wOBA vs. RHP | ISO vs. RHP | HC% vs. RHP | wOBA L14 | FD Position | FD Salary | DK Position | DK Salary |
|---|---|---|---|---|---|---|---|---|---|---|
| 1 | George Springer | RIGHT | 0.328 | 0.169 | 31.6% | 0.267 | OF | $3,800 | OF | $4,000 |
| 2 | Yuli Gurriel | RIGHT | 0.335 | 0.159 | 29.1% | 0.290 | 3B | $3,000 | 1B/3B | $2,900 |
| 3 | Jose Altuve | RIGHT | 0.396 | 0.206 | 32.7% | 0.277 | 2B | $3,700 | 2B | $5,300 |
| 4 | Carlos Correa | RIGHT | 0.361 | 0.195 | 35.7% | 0.338 | SS | $3,600 | SS | $4,800 |
| 5 | Evan Gattis | RIGHT | 0.331 | 0.259 | 34.1% | 0.441 | C | $3,000 | C | $4,200 |
| 6 | Marwin Gonzalez | SWITCH | 0.288 | 0.140 | 35.1% | 0.208 | 1B | $2,800 | 1B | $3,600 |
| 7 | Tony Kemp | LEFT | 0.306 | 0.115 | 33.9% | 0.427 | OF | $2,100 | OF | $3,200 |
| 8 | Jason Castro | LEFT | 0.338 | 0.210 | 39.4% | 0.186 | C | $2,500 | C | $3,000 |
| 9 | Teoscar Hernandez | RIGHT | 0.286 | 0.188 | 20.0% | 0.280 | OF | $2,400 | OF | $2,800 |
| Team Averages | — | 0.330 | 0.182 | 32.4% | 0.302 | — | — | — | — |
Elite Plays – Carlos Correa , Evan Gattis
Secondary Plays – Jose Altuve , George Springer
Stackability – Yellow
Seattle at Minnesota – 2:10 PM ET
| Seattle | Minnesota | ||||||||
 | Taijuan Walker |  | Hector Santiago | ||||||
| RIGHT | LEFT | ||||||||
| Vegas Moneyline | Vegas Over/Under | ||||||||
| SEA -127 | 9.0 | ||||||||
| Stats | wOBA | HR All. | HC% | K% | Stats | wOBA | HR All. | HC% | K% |
|---|---|---|---|---|---|---|---|---|---|
| SP vs. Left (2016) | 0.301 | 15 | 30.0% | 22.4% | SP vs. Left (2016) | 0.349 | 7 | 31.7% | 18.6% |
| SP vs. Right (2016) | 0.341 | 10 | 28.2% | 19.5% | SP vs. Right (2016) | 0.332 | 23 | 38.2% | 18.7% |
Pitcher Grind Down
| Taijuan Walker | ||||||||||
 | FanDuel | DraftKings | ||||||||
| Salary: | $7,400 | Salary: | $9,500 | |||||||
| FPPG: | 25.7 | FPPG: | 13.6 | |||||||
| Pitcher Rating: | 64.1 | Pitcher Rank: | 14 | |||||||
| Statistics | Starts | PitchPS | SIERA | ERA | K% | BB% | SS% | GB% | FB% | HC% |
|---|---|---|---|---|---|---|---|---|---|---|
| L30 Days | 5 | 93.4 | 4.19 | 4.88 | 19.0% | 5.0% | 12.2% | 44.8% | 40.2% | 32.2% |
| 2016 | 23 | 91.4 | 4.04 | 4.32 | 20.8% | 5.7% | 10.1% | 44.2% | 38.3% | 29.0% |
| 2015 | 29 | 90.7 | 3.69 | 4.56 | 22.2% | 5.7% | 10.0% | 38.6% | 39.0% | 30.2% |
Taijuan Walker: The new delivery has looked pretty good for Walker so far, and this Twins team is a group I do not mind picking on a bit. There is risk with Walker given the fact he has never fully lived up to the hype, but this slate is full of risk and the upside is pretty decent here as well.
Home (2015-16):—ERA: 4.45 — K%: 24.1% — wOBA Allowed: 0.314
Away (2015-16):—ERA: 4.47 — K%: 19.1% — wOBA Allowed: 0.319
| Hector Santiago | ||||||||||
 | FanDuel | DraftKings | ||||||||
| Salary: | $7,600 | Salary: | $6,100 | |||||||
| FPPG: | 25.5 | FPPG: | 12.2 | |||||||
| Pitcher Rating: | 39.8 | Pitcher Rank: | 26 | |||||||
| Statistics | Starts | PitchPS | SIERA | ERA | K% | BB% | SS% | GB% | FB% | HC% |
|---|---|---|---|---|---|---|---|---|---|---|
| L30 Days | 5 | 97.4 | 6.35 | 3.94 | 11.6% | 10.1% | 5.3% | 26.0% | 56.0% | 42.6% |
| 2016 | 31 | 95.7 | 5.04 | 4.82 | 18.6% | 10.2% | 8.5% | 34.5% | 50.0% | 36.9% |
| 2015 | 32 | 98.8 | 4.50 | 3.59 | 20.9% | 9.2% | 8.5% | 29.9% | 53.6% | 33.6% |
Hector Santiago: Just when we thought he might be putting it together, Santiago goes out and allows six runs to the Tigers. The Mariners are a lefty heavy team but they have the ability to plug in a couple capable right-handed bats. Not only that, but the couple of lefties in the heart of the order can also hit lefties creating some under owned talent.
Home (2015-16):—ERA: 4.20 — K%: 21.3% — wOBA Allowed: 0.316
Away (2015-16):—ERA: 4.16 — K%: 18.2% — wOBA Allowed: 0.332
Batter Grind Down
Seattle
Mariners: I basically just gave you my thoughts on the Mariners in the Santiago blurb but they make for one of the better team stacks that should not be too highly owned.
- Mariners Offense (2016)
Team wOBA vs. LHP — 0.322 (13 of 30)
Team wOBA L30 Days — 0.309 (21 of 30)
Team ISO vs. LHP — 0.170 (9 of 30)
Team K% vs. LHP — 21.6% (15 of 30)
Pitches Per PA vs. LHP — 3.86 (16 of 30)
Runs Per Game — 4.70 (8 of 30)
Projected Run Total — 4.66 (7 of 30)
Projected Lineup
| # | Player | Bats | wOBA vs. LHP | ISO vs. LHP | HC% vs. LHP | wOBA L14 | FD Position | FD Salary | DK Position | DK Salary |
|---|---|---|---|---|---|---|---|---|---|---|
| 1 | Guillermo Heredia | SWITCH | 0.280 | 0.082 | 20.8% | 0.343 | OF | $2,700 | OF | $2,900 |
| 2 | Franklin Gutierrez | RIGHT | 0.391 | 0.244 | 52.1% | 0.328 | OF | $2,900 | OF | $3,900 |
| 3 | Robinson Cano | LEFT | 0.336 | 0.188 | 30.7% | 0.216 | 2B | $3,800 | 2B | $4,300 |
| 4 | Nelson Cruz | RIGHT | 0.394 | 0.301 | 37.5% | 0.357 | OF | $4,000 | OF | $5,100 |
| 5 | Kyle Seager | LEFT | 0.325 | 0.212 | 35.8% | 0.281 | 3B | $3,900 | 3B | $3,800 |
| 6 | Dae-ho Lee | RIGHT | 0.340 | 0.192 | 29.0% | 0.315 | 1B | $2,700 | 1B | $3,800 |
| 7 | Leonys Martin | LEFT | 0.296 | 0.131 | 29.3% | 0.324 | OF | $2,900 | OF | $3,800 |
| 8 | Chris Iannetta | RIGHT | 0.330 | 0.129 | 34.1% | 0.124 | C | $2,400 | C | $2,800 |
| 9 | Shawn O’Malley | SWITCH | 0.285 | 0.099 | 19.7% | 0.300 | OF | $2,100 | OF/SS | $2,900 |
| Team Averages | — | 0.331 | 0.175 | 32.1% | 0.288 | — | — | — | — |
Elite Plays – Nelson Cruz
Secondary Plays – Franklin Gutierrez , Kyle Seager , Dae-ho Lee
Stackability – Yellow
Minnesota
Twins: Minnesota has a lot of red in their projected lineup with the main exception being Brian Dozier. This is a big reason why I do not mind Walker on the day and for the most part want nothing to do with the Twins hitters.
- Twins Offense (2016)
Team wOBA vs. RHP — 0.318 (13 of 30)
Team wOBA L30 Days — 0.315 (16 of 30)
Team ISO vs. RHP — 0.168 (13 of 30)
Team K% vs. RHP — 21.9% (23 of 30)
Pitches Per PA vs. RHP — 3.95 (5 of 30)
Runs Per Game — 4.53 (15 of 30)
Projected Run Total — 4.34 (14 of 30)
Projected Lineup
| # | Player | Bats | wOBA vs. RHP | ISO vs. RHP | HC% vs. RHP | wOBA L14 | FD Position | FD Salary | DK Position | DK Salary |
|---|---|---|---|---|---|---|---|---|---|---|
| 1 | Brian Dozier | RIGHT | 0.372 | 0.270 | 33.5% | 0.390 | 2B | $3,600 | 2B | $4,700 |
| 2 | Jorge Polanco | RIGHT | 0.301 | 0.104 | 23.3% | 0.302 | 3B | $2,700 | 3B/SS | $3,200 |
| 3 | Robbie Grossman | SWITCH | 0.320 | 0.129 | 32.3% | 0.384 | OF | $2,800 | OF | $3,700 |
| 4 | Miguel Sano | RIGHT | 0.337 | 0.228 | 40.1% | 0.283 | OF | $3,100 | 3B/OF | $4,100 |
| 5 | Max Kepler | LEFT | 0.343 | 0.228 | 33.3% | 0.193 | OF | $2,600 | OF | $3,400 |
| 6 | Eduardo Escobar | SWITCH | 0.272 | 0.095 | 26.2% | 0.066 | SS | $2,000 | 3B/SS | $2,000 |
| 7 | Juan Centeno | LEFT | 0.298 | 0.125 | 33.3% | 0.205 | C | $2,500 | C | $2,400 |
| 8 | Byron Buxton | RIGHT | 0.295 | 0.189 | 23.7% | 0.283 | OF | $3,100 | OF | $3,300 |
| 9 | Logan Schafer | LEFT | 0.294 | 0.111 | 19.1% | 0.279 | OF | $2,300 | OF | $2,400 |
| Team Averages | — | 0.315 | 0.164 | 29.4% | 0.265 | — | — | — | — |
Elite Plays – None
Secondary Plays – Brian Dozier , Miguel Sano
Stackability – Red
Texas at Oakland – 4:05 PM ET
| Texas | Oakland | ||||||||
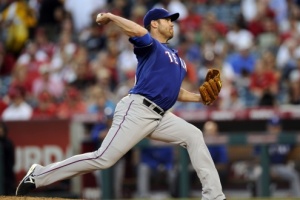
 | Colby Lewis |  | Jharel Cotton | ||||||
| RIGHT | RIGHT | ||||||||
| Vegas Moneyline | Vegas Over/Under | ||||||||
| OAK -106 | 8.0 | ||||||||
| Stats | wOBA | HR All. | HC% | K% | Stats | wOBA | HR All. | HC% | K% |
|---|---|---|---|---|---|---|---|---|---|
| SP vs. Left (2016) | 0.283 | 7 | 37.7% | 14.0% | SP vs. Left (2016) | 0.118 | 0 | 17.7% | 20.0% |
| SP vs. Right (2016) | 0.293 | 10 | 37.0% | 18.1% | SP vs. Right (2016) | 0.265 | 2 | 24.3% | 14.0% |
Pitcher Grind Down
| Colby Lewis | ||||||||||
 | FanDuel | DraftKings | ||||||||
| Salary: | $7,100 | Salary: | $7,300 | |||||||
| FPPG: | 28.5 | FPPG: | 15.2 | |||||||
| Pitcher Rating: | 52.6 | Pitcher Rank: | 24 | |||||||
| Statistics | Starts | PitchPS | SIERA | ERA | K% | BB% | SS% | GB% | FB% | HC% |
|---|---|---|---|---|---|---|---|---|---|---|
| L30 Days | 1 | 86.0 | 4.78 | 5.06 | 20.8% | 8.3% | 11.6% | 29.4% | 58.8% | 47.1% |
| 2016 | 17 | 93.9 | 4.85 | 3.40 | 16.2% | 6.0% | 8.4% | 34.8% | 47.6% | 37.3% |
| 2015 | 33 | 96.4 | 4.43 | 4.66 | 16.5% | 4.9% | 8.2% | 33.7% | 44.2% | 33.3% |
Colby Lewis: Even against an A’s team that we have picked on pretty much all season long, I will not start Colby Lewis. I guess what I am saying is never start Colby Lewis.
Home (2015-16):—ERA: 5.09 — K%: 15.9% — wOBA Allowed: 0.320
Away (2015-16):—ERA: 3.35 — K%: 16.9% — wOBA Allowed: 0.294
| Jharel Cotton | ||||||||||
 | FanDuel | DraftKings | ||||||||
| Salary: | $5,500 | Salary: | $5,900 | |||||||
| FPPG: | 30.0 | FPPG: | 17.4 | |||||||
| Pitcher Rating: | 41.4 | Pitcher Rank: | 25 | |||||||
| Statistics | Starts | PitchPS | SIERA | ERA | K% | BB% | SS% | GB% | FB% | HC% |
|---|---|---|---|---|---|---|---|---|---|---|
| L30 Days | 2 | 102.5 | 5.88 | 1.50 | 10.4% | 6.3% | 10.2% | 30.0% | 50.0% | 20.0% |
| 2016 | 3 | 93.3 | 4.78 | 1.50 | 16.2% | 4.4% | 11.4% | 33.3% | 50.0% | 22.2% |
Jharel Cotton: Cotton has done a tremendous job limiting runs from crossing the plate, but the strikeouts have been pretty hit or miss. This is a very dangerous Rangers team and while I think he will get some run support today, I would not run too many Cotton teams out there and nothing more than a tournament secondary pitcher on multiple pitcher sites.
Home (2015-16):—ERA: 1.46 — K%: 21.4% — wOBA Allowed: 0.170
Away (2015-16):—ERA: 1.59 — K%: 7.7% — wOBA Allowed: 0.277
Batter Grind Down
Texas
Rangers: This is an offense that does not get a ton of love but is more than capable of putting up a big number. The ISO throughout the lineup is indicative of the type of team we have here and although Cotton has been good to this point limiting runs it would not surprise me in the least to see Texas chase him early.
- Rangers Offense (2016)
Team wOBA vs. RHP — 0.326 (9 of 30)
Team wOBA L30 Days — 0.343 (4 of 30)
Team ISO vs. RHP — 0.177 (7 of 30)
Team K% vs. RHP — 19.8% (7 of 30)
Pitches Per PA vs. RHP — 3.83 (22 of 30)
Runs Per Game — 4.78 (6 of 30)
Projected Run Total — 3.96 (24 of 30)
Projected Lineup
| # | Player | Bats | wOBA vs. RHP | ISO vs. RHP | HC% vs. RHP | wOBA L14 | FD Position | FD Salary | DK Position | DK Salary |
|---|---|---|---|---|---|---|---|---|---|---|
| 1 | Carlos Gomez | RIGHT | 0.291 | 0.158 | 30.3% | 0.390 | OF | $3,500 | OF | $3,300 |
| 2 | Ian Desmond | RIGHT | 0.332 | 0.169 | 30.3% | 0.302 | OF | $3,900 | OF | $3,500 |
| 3 | Carlos Beltran | SWITCH | 0.342 | 0.207 | 34.5% | 0.339 | OF | $3,800 | OF | $3,600 |
| 4 | Adrian Beltre | RIGHT | 0.351 | 0.197 | 33.2% | 0.452 | 3B | $3,200 | 3B | $3,700 |
| 5 | Rougned Odor | LEFT | 0.347 | 0.247 | 33.8% | 0.263 | 2B | $3,700 | 2B | $4,200 |
| 6 | Jonathan Lucroy | RIGHT | 0.371 | 0.193 | 32.4% | 0.278 | C | $3,200 | C | $4,400 |
| 7 | Mitch Moreland | LEFT | 0.313 | 0.198 | 35.8% | 0.188 | 1B | $3,100 | 1B | $2,500 |
| 8 | Nomar Mazara | LEFT | 0.351 | 0.195 | 30.2% | 0.381 | OF | $3,300 | OF | $3,800 |
| 9 | Elvis Andrus | RIGHT | 0.327 | 0.123 | 25.9% | 0.426 | SS | $2,800 | SS | $3,600 |
| Team Averages | — | 0.336 | 0.187 | 31.8% | 0.335 | — | — | — | — |
Elite Plays – Carlos Beltran , Adrian Beltre
Secondary Plays – Ian Desmond , Rougned Odor , Jonathan Lucroy
Stackability – Yellow
Oakland
A’s: Colby Lewis is not a good pitcher but the A’s are not a good lineup either. This brings us to a scenario where I really do not like either.
- Athletics Offense (2016)
Team wOBA vs. RHP — 0.303 (27 of 30)
Team wOBA L30 Days — 0.302 (25 of 30)
Team ISO vs. RHP — 0.148 (23 of 30)
Team K% vs. RHP — 18.9% (4 of 30)
Pitches Per PA vs. RHP — 3.85 (19 of 30)
Runs Per Game — 4.10 (26 of 30)
Projected Run Total — 4.04 (22 of 30)
Projected Lineup
| # | Player | Bats | wOBA vs. RHP | ISO vs. RHP | HC% vs. RHP | wOBA L14 | FD Position | FD Salary | DK Position | DK Salary |
|---|---|---|---|---|---|---|---|---|---|---|
| 1 | Joey Wendle | LEFT | 0.289 | 0.057 | 30.4% | 0.303 | 2B | $2,400 | 2B | $2,600 |
| 2 | Stephen Vogt | LEFT | 0.316 | 0.157 | 27.0% | 0.302 | C | $3,000 | C | $3,500 |
| 3 | Ryon Healy | RIGHT | 0.353 | 0.195 | 28.0% | 0.439 | 3B | $3,400 | 3B | $3,700 |
| 4 | Danny Valencia | RIGHT | 0.324 | 0.145 | 31.6% | 0.311 | 3B | $2,900 | 3B/OF | $3,500 |
| 5 | Yonder Alonso | LEFT | 0.307 | 0.119 | 34.7% | 0.347 | 1B | $2,500 | 1B | $3,100 |
| 6 | Marcus Semien | RIGHT | 0.301 | 0.180 | 27.4% | 0.281 | SS | $2,900 | SS | $3,300 |
| 7 | Bruce Maxwell | LEFT | 0.349 | 0.137 | 43.2% | 0.438 | C | $2,800 | C | $2,600 |
| 8 | Brett Eibner | RIGHT | 0.262 | 0.163 | 21.2% | 0.318 | OF | $2,000 | OF | $3,100 |
| 9 | Jake Smolinski | RIGHT | 0.256 | 0.069 | 28.6% | 0.170 | OF | $2,400 | OF | $2,400 |
| Team Averages | — | 0.306 | 0.136 | 30.2% | 0.323 | — | — | — | — |
Elite Plays – None
Secondary Plays – Stephen Vogt , Danny Valencia
Stackability – Red
Colorado at LA Dodgers – 4:10 PM ET
| Colorado | LA Dodgers | ||||||||
 | Tyler Anderson |  | Brandon McCarthy | ||||||
| LEFT | RIGHT | ||||||||
| Vegas Moneyline | Vegas Over/Under | ||||||||
| LAD -180 | 8.0 | ||||||||
| Stats | wOBA | HR All. | HC% | K% | Stats | wOBA | HR All. | HC% | K% |
|---|---|---|---|---|---|---|---|---|---|
| SP vs. Left (2016) | 0.257 | 0 | 24.3% | 21.0% | SP vs. Left (2016) | 0.331 | 1 | 36.7% | 25.0% |
| SP vs. Right (2016) | 0.331 | 12 | 30.5% | 22.2% | SP vs. Right (2016) | 0.233 | 1 | 37.3% | 27.0% |
Pitcher Grind Down
| Tyler Anderson | ||||||||||
 | FanDuel | DraftKings | ||||||||
| Salary: | $6,500 | Salary: | $8,800 | |||||||
| FPPG: | 28.9 | FPPG: | 15.3 | |||||||
| Pitcher Rating: | 67.5 | Pitcher Rank: | 9 | |||||||
| Statistics | Starts | PitchPS | SIERA | ERA | K% | BB% | SS% | GB% | FB% | HC% |
|---|---|---|---|---|---|---|---|---|---|---|
| L30 Days | 5 | 97.0 | 3.61 | 4.20 | 25.4% | 7.1% | 13.6% | 45.1% | 30.5% | 29.4% |
| 2016 | 18 | 94.1 | 3.71 | 3.58 | 21.9% | 5.8% | 11.1% | 51.1% | 28.9% | 29.1% |
Tyler Anderson: This is a very interesting situation we have today. Anderson has not been good lately keeping runs from crossing the plate but he has been excellent in the strikeout department. Not only that but the Dodgers are a team we can attack with left handed pitching making Anderson even more intriguing.
Home (2015-16):—ERA: 3.00 — K%: 21.1% — wOBA Allowed: 0.312
Away (2015-16):—ERA: 5.10 — K%: 23.8% — wOBA Allowed: 0.316
| Brandon McCarthy | ||||||||||
 | FanDuel | DraftKings | ||||||||
| Salary: | $6,000 | Salary: | $6,600 | |||||||
| FPPG: | 24.6 | FPPG: | 13.3 | |||||||
| Pitcher Rating: | 67.3 | Pitcher Rank: | 11 | |||||||
| Statistics | Starts | PitchPS | SIERA | ERA | K% | BB% | SS% | GB% | FB% | HC% |
|---|---|---|---|---|---|---|---|---|---|---|
| 2016 | 8 | 74.4 | 4.91 | 3.63 | 26.2% | 16.6% | 7.6% | 35.9% | 42.3% | 37.0% |
| 2015 | 4 | 91.8 | 2.61 | 5.87 | 30.9% | 4.3% | 11.7% | 38.3% | 40.0% | 47.5% |
Brandon McCarthy: I do not want to pitch anyone coming off of the DL after a month with hip issues. You should 100% follow him on Twitter, but avoid him for DFS today.
Home (2015-16):—ERA: 4.82 — K%: 30.8% — wOBA Allowed: 0.336
Away (2015-16):—ERA: 3.98 — K%: 22.5% — wOBA Allowed: 0.269
Batter Grind Down
Colorado
Rockies: It is kind of silly that a team that ranks this high in this many categories and has that much blue in their projected lineup facing a guy coming off the DL would have the lowest projected run total. This is a good opportunity to teach the lesson of not trusting one number but instead look at the entire picture. I love the Rockies bats today and would be a little surprised if they are in fact low owned.
- Rockies Offense (2016)
Team wOBA vs. RHP — 0.346 (2 of 30)
Team wOBA L30 Days — 0.354 (1 of 30)
Team ISO vs. RHP — 0.194 (2 of 30)
Team K% vs. RHP — 20.3% (13 of 30)
Pitches Per PA vs. RHP — 3.90 (11 of 30)
Runs Per Game — 5.38 (2 of 30)
Projected Run Total — 3.54 (30 of 30)
Projected Lineup
| # | Player | Bats | wOBA vs. RHP | ISO vs. RHP | HC% vs. RHP | wOBA L14 | FD Position | FD Salary | DK Position | DK Salary |
|---|---|---|---|---|---|---|---|---|---|---|
| 1 | Charlie Blackmon | LEFT | 0.406 | 0.277 | 38.7% | 0.492 | OF | $3,700 | OF | $3,900 |
| 2 | DJ LeMahieu | RIGHT | 0.390 | 0.135 | 34.9% | 0.448 | 2B | $3,200 | 2B | $3,800 |
| 3 | Nolan Arenado | RIGHT | 0.399 | 0.296 | 37.4% | 0.350 | 3B | $3,800 | 3B | $4,000 |
| 4 | Carlos Gonzalez | LEFT | 0.380 | 0.208 | 36.3% | 0.332 | OF | $3,300 | OF | $3,600 |
| 5 | Ryan Raburn | RIGHT | 0.272 | 0.136 | 37.7% | 0.335 | OF | $2,200 | OF | $2,200 |
| 6 | Tom Murphy | RIGHT | 0.542 | 0.600 | 42.9% | 0.354 | C | $2,800 | C | $2,000 |
| 7 | Stephen Cardullo | RIGHT | 0.490 | 0.533 | 28.6% | 0.201 | OF | $3,000 | 1B | $2,000 |
| 8 | Cristhian Adames | SWITCH | 0.284 | 0.092 | 20.7% | 0.237 | SS | $2,600 | SS | $2,000 |
| 9 | Tyler Anderson | LEFT | 0.247 | 0.115 | 15.0% | 0.276 | P | $6,500 | P | $8,800 |
| Team Averages | — | 0.379 | 0.266 | 32.5% | 0.336 | — | — | — | — |
Elite Plays – Nolan Arenado (It is Sunday afterall)
Secondary Plays – Charlie Blackmon , Carlos Gonzalez , DJ LeMahieu
Stackability – Yellow
LA Dodgers
Dodgers: For a team facing a pitcher giving up a ton of runs lately, I really do not have a ton of interest here. Corey Seager is obviously a guy who has hit lefties well, and you can run out Puig and Kendrick but for the most part this is a fade.
- Dodgers Offense (2016)
Team wOBA vs. LHP — 0.275 (30 of 30)
Team wOBA L30 Days — 0.295 (26 of 30)
Team ISO vs. LHP — 0.120 (28 of 30)
Team K% vs. LHP — 22.9% (22 of 30)
Pitches Per PA vs. LHP — 3.93 (7 of 30)
Runs Per Game — 4.45 (16 of 30)
Projected Run Total — 4.46 (11 of 30)
Projected Lineup
| # | Player | Bats | wOBA vs. LHP | ISO vs. LHP | HC% vs. LHP | wOBA L14 | FD Position | FD Salary | DK Position | DK Salary |
|---|---|---|---|---|---|---|---|---|---|---|
| 1 | Howie Kendrick | RIGHT | 0.307 | 0.066 | 32.1% | 0.328 | 2B | $2,500 | 2B/OF | $3,500 |
| 2 | Corey Seager | LEFT | 0.313 | 0.167 | 41.2% | 0.327 | SS | $4,100 | SS | $3,900 |
| 3 | Justin Turner | RIGHT | 0.277 | 0.131 | 39.3% | 0.327 | 3B | $3,200 | 3B | $3,400 |
| 4 | Adrian Gonzalez | LEFT | 0.265 | 0.070 | 23.9% | 0.219 | 1B | $3,000 | 1B | $3,500 |
| 5 | Yasiel Puig | RIGHT | 0.329 | 0.225 | 30.0% | 0.246 | OF | $2,700 | OF | $3,500 |
| 6 | Yasmani Grandal | SWITCH | 0.333 | 0.147 | 34.0% | 0.184 | C | $3,100 | C | $3,300 |
| 7 | Kike Hernandez | RIGHT | 0.315 | 0.193 | 31.7% | 0.356 | OF | $2,300 | OF | $3,200 |
| 8 | Charlie Culberson | RIGHT | 0.289 | 0.028 | 30.0% | 0.439 | 2B | $2,200 | 2B/SS | $2,200 |
| 9 | Rich Hill | LEFT | 0.000 | P | $9,400 | P | $10,700 | |||
| Team Averages | — | 0.304 | 0.128 | 32.8% | 0.270 | — | — | — | — |
Elite Plays – None
Secondary Plays – Corey Seager , Yasiel Puig , Howie Kendrick
Stackability – Orange
San Francisco at San Diego – 4:40 PM ET
| San Francisco | San Diego | ||||||||
 | Johnny Cueto |  | Clayton Richard | ||||||
| RIGHT | LEFT | ||||||||
| Vegas Moneyline | Vegas Over/Under | ||||||||
| SF -150 | 8.5 | ||||||||
| Stats | wOBA | HR All. | HC% | K% | Stats | wOBA | HR All. | HC% | K% |
|---|---|---|---|---|---|---|---|---|---|
| SP vs. Left (2016) | 0.286 | 6 | 30.4% | 22.8% | SP vs. Left (2016) | 0.308 | 0 | 17.0% | 18.9% |
| SP vs. Right (2016) | 0.262 | 9 | 24.1% | 21.2% | SP vs. Right (2016) | 0.342 | 3 | 29.3% | 13.6% |
Pitcher Grind Down
| Johnny Cueto | ||||||||||
 | FanDuel | DraftKings | ||||||||
| Salary: | $9,600 | Salary: | $12,800 | |||||||
| FPPG: | 38.9 | FPPG: | 21.4 | |||||||
| Pitcher Rating: | 79.6 | Pitcher Rank: | 3 | |||||||
| Statistics | Starts | PitchPS | SIERA | ERA | K% | BB% | SS% | GB% | FB% | HC% |
|---|---|---|---|---|---|---|---|---|---|---|
| L30 Days | 6 | 96.3 | 3.89 | 2.43 | 19.9% | 5.8% | 8.7% | 51.3% | 27.4% | 30.4% |
| 2016 | 31 | 102.8 | 3.65 | 2.79 | 22.0% | 5.2% | 9.2% | 50.6% | 29.3% | 27.0% |
| 2015 | 32 | 102.1 | 3.81 | 3.44 | 20.3% | 5.3% | 9.9% | 42.4% | 35.6% | 28.7% |
Ty Blach: Blach will make his first major league start today in San Diego, which is about as good as you can ask for. Even with that said, if he is available on your site it probably is not worth taking the risk on a guy we are not sure can cut it at this level.
Home (2015-16):—ERA: 2.88 — K%: 21.0% — wOBA Allowed: 0.264
Away (2015-16):—ERA: 3.32 — K%: 21.2% — wOBA Allowed: 0.299
| Clayton Richard | ||||||||||
 | FanDuel | DraftKings | ||||||||
| Salary: | $6,800 | Salary: | $5,000 | |||||||
| FPPG: | 7.6 | FPPG: | 3.5 | |||||||
| Pitcher Rating: | 55.0 | Pitcher Rank: | 21 | |||||||
| Statistics | Starts | PitchPS | SIERA | ERA | K% | BB% | SS% | GB% | FB% | HC% |
|---|---|---|---|---|---|---|---|---|---|---|
| L30 Days | 5 | 95.0 | 3.53 | 1.17 | 18.2% | 7.6% | 9.7% | 66.3% | 15.3% | 26.5% |
| 2016 | 7 | 131.4 | 4.09 | 2.98 | 15.1% | 9.3% | 8.4% | 66.5% | 17.8% | 25.9% |
| 2015 | 3 | 205.0 | 3.33 | 3.83 | 12.2% | 3.9% | 6.2% | 59.3% | 14.7% | 25.2% |
Clayton Richard: He is producing ground balls at a very high rate and is not allowing runs since becoming a Padre, but the problem is that he also lacks strikeout upside which is only magnified when playing against the Giants. It is a good ballpark and he has had some success but this would be a very risky play even on a slate like this.
Home (2015-16):—ERA: 3.57 — K%: 15.3% — wOBA Allowed: 0.309
Away (2015-16):—ERA: 3.15 — K%: 12.7% — wOBA Allowed: 0.333
Batter Grind Down
San Francisco
Giants: This is another team that even when they score runs it is often a situation where the fantasy production is pretty minimal. I like guys like Posey and Pence against the southpaw but do not go too crazy here.
- Giants Offense (2016)
Team wOBA vs. LHP — 0.313 (22 of 30)
Team wOBA L30 Days — 0.288 (27 of 30)
Team ISO vs. LHP — 0.140 (25 of 30)
Team K% vs. LHP — 18.6% (3 of 30)
Pitches Per PA vs. LHP — 3.79 (27 of 30)
Runs Per Game — 4.35 (18 of 30)
Projected Run Total — 4.54 (9 of 30)
Projected Lineup
| # | Player | Bats | wOBA vs. LHP | ISO vs. LHP | HC% vs. LHP | wOBA L14 | FD Position | FD Salary | DK Position | DK Salary |
|---|---|---|---|---|---|---|---|---|---|---|
| 1 | Eduardo Nunez | RIGHT | 0.327 | 0.206 | 33.6% | 0.422 | 3B | $3,100 | 3B/SS | $5,100 |
| 2 | Angel Pagan | SWITCH | 0.308 | 0.156 | 23.5% | 0.292 | OF | $3,200 | OF | $3,600 |
| 3 | Buster Posey | RIGHT | 0.386 | 0.194 | 36.2% | 0.339 | C | $3,500 | C | $4,900 |
| 4 | Hunter Pence | RIGHT | 0.379 | 0.262 | 37.2% | 0.442 | OF | $2,900 | OF | $4,300 |
| 5 | Gorkys Hernandez | RIGHT | 0.407 | 0.222 | 62.5% | 0.356 | OF | $2,400 | OF | $2,800 |
| 6 | Brandon Belt | LEFT | 0.379 | 0.221 | 31.6% | 0.374 | 1B | $3,400 | 1B | $4,500 |
| 7 | Brandon Crawford | LEFT | 0.308 | 0.110 | 39.1% | 0.277 | SS | $3,100 | SS | $3,300 |
| 8 | Joe Panik | LEFT | 0.269 | 0.073 | 24.0% | 0.191 | 2B | $3,200 | 2B | $3,200 |
| 9 | Matt Cain | RIGHT | 0.232 | 0.286 | 33.3% | P | $5,200 | P | $4,800 | |
| Team Averages | — | 0.333 | 0.192 | 35.7% | 0.337 | — | — | — | — |
Elite Plays – Buster Posey , Hunter Pence
Secondary Plays – Eduardo Nunez , Brandon Belt
Stackability – Orange
San Diego
Padres: This is team that you simply cannot stack at this point but Schimpf as a filler option still exists, and the upside is solid with him.
- Padres Offense (2016)
Team wOBA vs. RHP — 0.291 (30 of 30)
Team wOBA L30 Days — 0.271 (30 of 30)
Team ISO vs. RHP — 0.153 (22 of 30)
Team K% vs. RHP — 24.9% (29 of 30)
Pitches Per PA vs. RHP — 3.90 (10 of 30)
Runs Per Game — 4.22 (22 of 30)
Projected Run Total — 3.96 (25 of 30)
Projected Lineup
| # | Player | Bats | wOBA vs. RHP | ISO vs. RHP | HC% vs. RHP | wOBA L14 | FD Position | FD Salary | DK Position | DK Salary |
|---|---|---|---|---|---|---|---|---|---|---|
| 1 | Jon Jay | LEFT | 0.306 | 0.105 | 32.2% | 0.267 | OF | $3,000 | OF | $2,600 |
| 2 | Carlos Asuaje | LEFT | 0.000 | 0.000 | 0.0% | 0.000 | SS | $2,100 | ||
| 3 | Wil Myers | RIGHT | 0.340 | 0.206 | 32.3% | 0.433 | 1B | $3,300 | 1B | $4,600 |
| 4 | Ryan Schimpf | LEFT | 0.373 | 0.322 | 39.1% | 0.277 | 2B | $3,400 | 2B/3B | $3,300 |
| 5 | Alex Dickerson | LEFT | 0.333 | 0.214 | 30.5% | 0.314 | OF | $3,100 | OF | $3,000 |
| 6 | Hunter Renfroe | RIGHT | 0.000 | OF | $2,200 | OF | $2,100 | |||
| 7 | Austin Hedges | RIGHT | C | $2,300 | C | $2,100 | ||||
| 8 | Luis Sardinas | SWITCH | 0.237 | 0.080 | 20.3% | 0.328 | SS | $2,800 | SS | $2,300 |
| 9 | Clayton Richard | LEFT | 0.000 | 0.000 | 0.0% | 0.000 | P | $6,800 | P | $5,000 |
| Team Averages | — | 0.227 | 0.132 | 22.1% | 0.202 | — | — | — | — |
Elite Plays – None
Secondary Plays – Ryan Schimpf
Stackability – Red
St. Louis at Chicago Cubs – 8:08 PM ET
| St. Louis | Chicago Cubs | ||||||||
 | Carlos Martinez |  | Jon Lester | ||||||
| RIGHT | LEFT | ||||||||
| Vegas Moneyline | Vegas Over/Under | ||||||||
| CHC -165 | 8.5 | ||||||||
| Stats | wOBA | HR All. | HC% | K% | Stats | wOBA | HR All. | HC% | K% |
|---|---|---|---|---|---|---|---|---|---|
| SP vs. Left (2016) | 0.326 | 11 | 33.5% | 18.3% | SP vs. Left (2016) | 0.237 | 3 | 31.6% | 27.7% |
| SP vs. Right (2016) | 0.240 | 3 | 23.6% | 24.4% | SP vs. Right (2016) | 0.270 | 17 | 25.3% | 23.7% |
Pitcher Grind Down
| Carlos Martinez | ||||||||||
 | FanDuel | DraftKings | ||||||||
| Salary: | $9,400 | Salary: | $9,200 | |||||||
| FPPG: | 32.6 | FPPG: | 16.8 | |||||||
| Pitcher Rating: | 68.9 | Pitcher Rank: | 5 | |||||||
| Statistics | Starts | PitchPS | SIERA | ERA | K% | BB% | SS% | GB% | FB% | HC% |
|---|---|---|---|---|---|---|---|---|---|---|
| L30 Days | 5 | 99.0 | 3.62 | 2.73 | 25.0% | 8.1% | 11.5% | 54.0% | 27.6% | 25.8% |
| 2016 | 29 | 97.1 | 4.02 | 3.16 | 21.1% | 8.6% | 9.0% | 56.1% | 26.1% | 29.0% |
| 2015 | 29 | 98.1 | 3.44 | 3.01 | 24.4% | 8.3% | 10.5% | 54.5% | 25.5% | 27.6% |
Carlos Martinez: This game features two of the better pitching options on the board against each other. Martinez has been the Cardinals best pitcher both in real life and for fantasy purposes this season and he has decent potential anytime he takes the mound, but against a tough Cubs lineup I like him more for tournaments only.
Home (2015-16):—ERA: 3.69 — K%: 21.2% — wOBA Allowed: 0.311
Away (2015-16):—ERA: 2.48 — K%: 24.3% — wOBA Allowed: 0.277
| Jon Lester | ||||||||||
 | FanDuel | DraftKings | ||||||||
| Salary: | $10,700 | Salary: | $13,000 | |||||||
| FPPG: | 38.4 | FPPG: | 21.2 | |||||||
| Pitcher Rating: | 91.4 | Pitcher Rank: | 2 | |||||||
| Statistics | Starts | PitchPS | SIERA | ERA | K% | BB% | SS% | GB% | FB% | HC% |
|---|---|---|---|---|---|---|---|---|---|---|
| L30 Days | 5 | 101.4 | 3.39 | 0.50 | 26.0% | 5.5% | 11.2% | 42.9% | 31.0% | 23.0% |
| 2016 | 30 | 98.5 | 3.61 | 2.36 | 24.6% | 6.4% | 10.3% | 46.4% | 32.6% | 26.7% |
| 2015 | 32 | 99.5 | 3.19 | 3.34 | 25.0% | 5.7% | 10.4% | 48.9% | 29.3% | 29.0% |
Jon Lester: It has been a fantastic season for Lester who has pitched very well at home and against the Cardinals, which sets up nicely for him tonight. The win is not a sure thing for either side as this could turn out to be a pitchers duel with Martinez taking the hill for Saint Louis. I like him a bit more than the Redbirds hurler, but both are pretty solid options tonight.
Home (2015-16):—ERA: 2.84 — K%: 24.8% — wOBA Allowed: 0.280
Away (2015-16):—ERA: 2.89 — K%: 24.9% — wOBA Allowed: 0.272
Batter Grind Down
St. Louis
Cardinals: Saint Louis is fighting for their playoff life, but I do not know how much I trust this offense tonight facing Lester who has been great for Chicago. They have been pretty average overall against left-handed pitching and their main threat is swinging a cold bat right now.
- Cardinals Offense (2016)
Team wOBA vs. LHP — 0.320 (17 of 30)
Team wOBA L30 Days — 0.312 (17 of 30)
Team ISO vs. LHP — 0.171 (8 of 30)
Team K% vs. LHP — 21.4% (14 of 30)
Pitches Per PA vs. LHP — 3.82 (21 of 30)
Runs Per Game — 4.79 (5 of 30)
Projected Run Total — 3.87 (28 of 30)
Projected Lineup
| # | Player | Bats | wOBA vs. LHP | ISO vs. LHP | HC% vs. LHP | wOBA L14 | FD Position | FD Salary | DK Position | DK Salary |
|---|---|---|---|---|---|---|---|---|---|---|
| 1 | Matt Carpenter | LEFT | 0.352 | 0.158 | 30.0% | 0.311 | 2B | $3,300 | 2B/3B | $3,100 |
| 2 | Jedd Gyorko | RIGHT | 0.318 | 0.160 | 32.7% | 0.305 | 3B | $2,800 | 2B/3B | $2,700 |
| 3 | Stephen Piscotty | RIGHT | 0.413 | 0.266 | 29.2% | 0.256 | OF | $2,900 | OF | $3,500 |
| 4 | Brandon Moss | LEFT | 0.303 | 0.154 | 37.3% | 0.175 | 1B | $3,200 | 1B/OF | $2,900 |
| 5 | Yadier Molina | RIGHT | 0.338 | 0.114 | 29.8% | 0.295 | C | $2,700 | C | $2,400 |
| 6 | Matt Adams | LEFT | 0.345 | 0.239 | 36.1% | 0.373 | 1B | $2,700 | 1B | $3,000 |
| 7 | Jhonny Peralta | RIGHT | 0.256 | 0.143 | 28.6% | 0.225 | SS | $2,800 | 3B | $2,300 |
| 8 | Randal Grichuk | RIGHT | 0.337 | 0.246 | 36.6% | 0.343 | OF | $3,300 | OF | $3,000 |
| 9 | Carlos Martinez | RIGHT | 0.265 | 0.083 | 44.4% | 0.568 | P | $9,400 | P | $9,200 |
| Team Averages | — | 0.325 | 0.174 | 33.9% | 0.317 | — | — | — | — |
Elite Plays – None
Secondary Plays – Stephen Piscotty , Randal Grichuk
Stackability – Red
Chicago Cubs
Cubs: This is a more dangerous squad offensively than the Cardinals and while Martinez has been tough, I would much rather stack up the Chicago side of things if you are playing bats from this game.
- Cubs Offense (2016)
Team wOBA vs. RHP — 0.327 (8 of 30)
Team wOBA L30 Days — 0.316 (14 of 30)
Team ISO vs. RHP — 0.168 (13 of 30)
Team K% vs. RHP — 21.7% (22 of 30)
Pitches Per PA vs. RHP — 3.97 (3 of 30)
Runs Per Game — 4.97 (3 of 30)
Projected Run Total — 4.63 (8 of 30)
Projected Lineup
| # | Player | Bats | wOBA vs. RHP | ISO vs. RHP | HC% vs. RHP | wOBA L14 | FD Position | FD Salary | DK Position | DK Salary |
|---|---|---|---|---|---|---|---|---|---|---|
| 1 | Dexter Fowler | SWITCH | 0.356 | 0.165 | 28.1% | 0.478 | OF | $4,000 | OF | $5,000 |
| 2 | Kris Bryant | RIGHT | 0.388 | 0.253 | 41.2% | 0.316 | 3B | $4,200 | 3B/OF | $4,800 |
| 3 | Anthony Rizzo | LEFT | 0.408 | 0.277 | 39.1% | 0.357 | 1B | $4,600 | 1B | $5,200 |
| 4 | Ben Zobrist | SWITCH | 0.345 | 0.159 | 32.9% | 0.293 | 2B | $3,000 | 2B | $4,000 |
| 5 | Addison Russell | RIGHT | 0.314 | 0.163 | 29.4% | 0.338 | SS | $2,300 | SS | $3,500 |
| 6 | Jason Heyward | LEFT | 0.284 | 0.097 | 27.1% | 0.348 | OF | $3,000 | OF | $3,200 |
| 7 | Jorge Soler | RIGHT | 0.329 | 0.204 | 31.4% | 0.311 | OF | $2,300 | OF | $3,700 |
| 8 | Miguel Montero | LEFT | 0.314 | 0.161 | 30.1% | 0.347 | C | $2,500 | C | $3,100 |
| 9 | Jon Lester | LEFT | 0.136 | 0.049 | 23.7% | 0.468 | P | $10,700 | P | $13,000 |
| Team Averages | — | 0.319 | 0.170 | 31.4% | 0.362 | — | — | — | — |