MLB Grind Down: Saturday, September 23rd

Jump to Page 1 2 3
The RotoGrinders MLB Grind Down will give you an in-depth analysis into the upcoming MLB schedule. This article will break down the numbers for every single game and give you analysis on which trends you can exploit. While matchups are a major factor in daily fantasy baseball, there are plenty of other factors to consider such as injuries, weather, and salaries.
The analysis should point you in the right direction, but it is still up to you to decipher the information and make your own selections. No sport has more variance than baseball. The best choice is not always the right choice but following the trends will win you money over time.
Note: As always, if you want to try a new DFS site, be sure to click through a RotoGrinders link and use our DraftKings promo code, FanDuel promo code, and FantasyDraft promo code to receive the best perks in the industry.
Stackability Rating System:
GREEN – A viable full stack in cash games and GPPs.
YELLOW – A viable mini-stack in cash games and full stack in GPPs.
ORANGE – A viable stack in large field GPPs.
RED – Not a recommended stack for cash games or GPPs.
Chicago Cubs at Milwaukee – 1:05 PM ET
| Chicago Cubs | Milwaukee | ||||||||||||||
 | Kyle Hendricks |  | Brent Suter | ||||||||||||
| RIGHT | LEFT | ||||||||||||||
| Vegas Moneyline | Vegas Over/Under | ||||||||||||||
| CHC-125 | 9.0 | ||||||||||||||
| Stats | wOBA | xwOBA | HC% | BB% | K% | GB% | Stats | wOBA | xwOBA | HC% | BB% | K% | GB% | ||
|---|---|---|---|---|---|---|---|---|---|---|---|---|---|---|---|
| SP vs. Left (2016-17) | 0.309 | 0.310 | 33.1% | 10.2% | 22.0% | 43.2% | SP vs. Left (2016-17) | 0.248 | 0.296 | 32.0% | 8.7% | 17.4% | 48.0% | ||
| SP vs. Right (2016-17) | 0.278 | 0.293 | 27.1% | 4.7% | 19.4% | 55.4% | SP vs. Right (2016-17) | 0.316 | 0.297 | 28.1% | 6.6% | 20.1% | 46.7% | ||
Pitcher Grind Down
| Kyle Hendricks | |||||||||
 | FanDuel | DraftKings | FantasyDraft | ||||||
| Salary: | $8,700 | Salary: | $9,400 | Salary: | $18,300 | ||||
| Salary Rank: | 6 of 30 | Salary Rank: | 7 of 30 | Salary Rank: | 3 of 30 | ||||
| Stats | Starts | SIERA | ERA | K% | BB% | GB% | HC% | SC% | |
|---|---|---|---|---|---|---|---|---|---|
| 2016 | 30 | 3.70 | 2.13 | 22.8% | 5.9% | 48.4% | 25.8% | 25.1% | |
| 2017 | 22 | 4.23 | 3.22 | 20.6% | 7.3% | 50.0% | 29.8% | 22.9% | |
| L30 | 5 | 3.80 | 2.38 | 20.9% | 4.7% | 54.9% | 18.8% | 26.0% | |
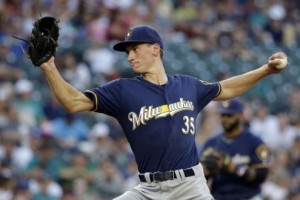
The day starts with a quick two game early afternoon slate, and both FanDuel and DraftKings have split up today’s slate in the same fashion. The Cubs have logged come from behind wins in each of the first two games of this series, marking a huge step toward the team clinching the NL Central. They haven’t done that just yet, so expect them to continue to go all-out for victories. Kyle Hendricks has been pitching much better since returning from injury, and he has given up three or fewer runs in all 11 starts since his return. That includes two solid starts against this Brewers squad, and the matchup enhances his strikeout upside a little bit. That’s a positive, as Hendricks isn’t normally the highest strikeout guy on the planet.
Quick Breakdown: If you are playing the two game early afternoon slate, Hendricks is the safest pitcher on the board. It’s difficult to avoid him on multi-pitcher sites.
| Brent Suter | |||||||||
 | FanDuel | DraftKings | FantasyDraft | ||||||
| Salary: | $7,000 | Salary: | $5,800 | Salary: | $11,600 | ||||
| Salary Rank: | 18 of 30 | Salary Rank: | 23 of 30 | Salary Rank: | 7 of 30 | ||||
| Stats | Starts | SIERA | ERA | K% | BB% | GB% | HC% | SC% | |
|---|---|---|---|---|---|---|---|---|---|
| 2016 | 2 | 4.33 | 3.32 | 16.5% | 5.5% | 43.3% | 34.3% | 22.9% | |
| 2017 | 12 | 4.34 | 3.41 | 19.5% | 7.1% | 47.0% | 29.0% | 24.0% | |
| L30 | 3 | 3.99 | 1.50 | 18.0% | 6.0% | 54.1% | 26.3% | 39.5% | |
Suter is a decent left-hander, but he is not being allowed to throw a ton of pitches right now as the Brewers look to limit his workload. He threw 64 pitches in his last start, which represented a high water mark since his September recall. That limitation makes him a very tough sell against a dangerous Cubs offense.
Quick Breakdown: With a pitch limit very clearly in place, Suter can be avoided in all formats, though I would roster him before I clicked Bud Norris. That slots him third of the four pitchers on this early slate.
Batter Grind Down
Chicago Cubs
Projected Lineup (Splits vs. LH Pitching)
| # | Player | Bats | wOBA | xwOBA | ISO | HC% | BB% | K% | GB% | FD Pos. | FD Sal. | DK Pos. | DK Sal. | FDRFT Pos. | FDRFT Sal. |
|---|---|---|---|---|---|---|---|---|---|---|---|---|---|---|---|
| 1 | Ben Zobrist | SWITCH | 0.244 | 0.293 | 0.119 | 29.6% | 10.3% | 13.8% | 52.9% | OF | $3,100 | 2B/OF | $3,500 | IF/OF | $6,900 |
| 2 | Kris Bryant | RIGHT | 0.413 | 0.432 | 0.227 | 35.1% | 20.4% | 15.1% | 38.1% | 3B | $4,300 | 3B | $5,300 | IF/OF | $10,200 |
| 3 | Anthony Rizzo | LEFT | 0.383 | 0.383 | 0.259 | 33.6% | 10.5% | 14.5% | 44.4% | 1B | $3,900 | 1B | $5,400 | 1B | $10,400 |
| 4 | Willson Contreras | RIGHT | 0.395 | 0.387 | 0.255 | 34.5% | 15.6% | 18.0% | 54.3% | C | $3,200 | C | $4,200 | IF/OF | $8,100 |
| 5 | Albert Almora | RIGHT | 0.384 | 0.359 | 0.150 | 29.4% | 10.7% | 13.2% | 46.7% | OF | $2,400 | OF | $3,300 | CF | $6,600 |
| 6 | Javier Baez | RIGHT | 0.390 | 0.331 | 0.275 | 40.5% | 6.2% | 24.8% | 42.7% | 2B | $3,400 | 2B/SS | $3,600 | 2B | $7,200 |
| 7 | Jason Heyward | LEFT | 0.292 | 0.266 | 0.106 | 21.8% | 3.4% | 22.2% | 43.7% | OF | $2,900 | OF | $3,300 | RF | $6,400 |
| 8 | Addison Russell | RIGHT | 0.348 | 0.356 | 0.190 | 31.7% | 13.1% | 24.2% | 43.3% | SS | $2,800 | SS | $3,300 | SS | $6,600 |
| 9 | Kyle Hendricks | RIGHT | 0.058 | 0.000 | 20.0% | 0.0% | 66.7% | 60.0% | P | $8,700 | P | $9,400 | P | $18,300 |
While I can’t endorse Brent Suter as a pitching option because of his pitch count, that doesn’t automatically mean that I love the Cubs offense. Suter is not a bad pitcher by any means and sports a 3.41 ERA and 29% hard contact rate, both of which are very good. His advanced metrics do suggest some regression, though. He is a traditional splits LHP and has held lefties to a .248 wOBA this year, so RHBs are the preferred targets if you decide to attack him.
Elite Plays – Kris Bryant, Ben Zobrist, Willson Contreras
Secondary Plays – Albert Almora, Javier Baez
Stackability – YELLOW
Milwaukee
Projected Lineup (Splits vs. RH Pitching)
| # | Player | Bats | wOBA | xwOBA | ISO | HC% | BB% | K% | GB% | FD Pos. | FD Sal. | DK Pos. | DK Sal. | FDRFT Pos. | FDRFT Sal. |
|---|---|---|---|---|---|---|---|---|---|---|---|---|---|---|---|
| 1 | Eric Sogard | LEFT | 0.348 | 0.349 | 0.104 | 24.9% | 16.2% | 10.6% | 40.6% | 2B | $2,300 | 2B/SS | $3,300 | 2B | $6,400 |
| 2 | Neil Walker | SWITCH | 0.367 | 0.359 | 0.207 | 34.1% | 11.5% | 16.4% | 37.1% | 2B | $3,200 | 2B | $3,700 | 2B | $7,200 |
| 3 | Ryan Braun | RIGHT | 0.352 | 0.335 | 0.219 | 38.1% | 7.8% | 21.2% | 48.0% | OF | $3,700 | OF | $4,200 | LF | $8,000 |
| 4 | Travis Shaw | LEFT | 0.372 | 0.357 | 0.255 | 40.0% | 10.6% | 22.1% | 41.9% | 3B | $3,300 | 3B | $4,300 | 3B | $8,400 |
| 5 | Domingo Santana | RIGHT | 0.369 | 0.341 | 0.224 | 37.6% | 11.5% | 30.5% | 45.0% | OF | $4,100 | OF | $4,600 | RF | $9,000 |
| 6 | Eric Thames | LEFT | 0.387 | 0.353 | 0.296 | 42.6% | 14.5% | 28.0% | 37.2% | 1B | $3,600 | 1B/OF | $4,200 | 1B | $8,000 |
| 7 | Stephen Vogt | LEFT | 0.300 | 0.302 | 0.191 | 33.5% | 7.3% | 19.6% | 38.8% | C | $2,100 | C | $2,900 | C | $5,700 |
| 8 | Brett Phillips | LEFT | 0.312 | 0.239 | 0.154 | 22.6% | 11.9% | 35.6% | 41.9% | OF | $2,600 | OF | $2,700 | CF | $5,400 |
| 9 | Brent Suter | LEFT | 0.305 | 0.000 | 11.1% | 0.0% | 23.1% | 100.0% | P | $7,000 | P | $5,800 | P | $11,600 |
With Hendricks being arguably the top pitcher on this very early slate, the Brewers don’t carry a whole lot of intrigue. When he’s right, Hendricks gets a lot of ground balls and limits damage very well. There isn’t a lot on my radar here, though Travis Shaw has been smashing RHP this year and owns a pair of home runs in ten career at bats against Hendricks. He is the top target here.
Elite Plays – Travis Shaw
Secondary Plays – Ryan Braun, Eric Thames
Stackability – ORANGE
LA Angels at Houston – 1:05 PM ET
| LA Angels | Houston | ||||||||||||||
 | Bud Norris |  | Charlie Morton | ||||||||||||
| RIGHT | RIGHT | ||||||||||||||
| Vegas Moneyline | Vegas Over/Under | ||||||||||||||
| HOU-159 | 9.5 | ||||||||||||||
| Stats | wOBA | xwOBA | HC% | BB% | K% | GB% | Stats | wOBA | xwOBA | HC% | BB% | K% | GB% | ||
|---|---|---|---|---|---|---|---|---|---|---|---|---|---|---|---|
| SP vs. Left (2016-17) | 0.244 | 0.292 | 26.8% | 15.2% | 30.5% | 44.6% | SP vs. Left (2016-17) | 0.249 | 0.279 | 27.5% | 8.8% | 32.4% | 46.3% | ||
| SP vs. Right (2016-17) | 0.355 | 0.324 | 36.7% | 5.9% | 26.5% | 43.3% | SP vs. Right (2016-17) | 0.354 | 0.313 | 27.1% | 8.4% | 22.1% | 54.7% | ||
Pitcher Grind Down
| Bud Norris | |||||||||
 | FanDuel | DraftKings | FantasyDraft | ||||||
| Salary: | $5,500 | Salary: | $4,700 | Salary: | $9,300 | ||||
| Salary Rank: | 27 of 30 | Salary Rank: | 30 of 30 | Salary Rank: | 10 of 30 | ||||
| Stats | Starts | SIERA | ERA | K% | BB% | GB% | HC% | SC% | |
|---|---|---|---|---|---|---|---|---|---|
| 2016 | 19 | 4.38 | 5.10 | 20.6% | 9.9% | 47.6% | 31.7% | 13.2% | |
| 2017 | 1 | 3.49 | 4.53 | 28.2% | 10.0% | 43.8% | 32.9% | 14.4% | |
| L30 | 1 | 3.77 | 4.70 | 20.0% | 5.7% | 40.0% | 32.0% | 12.0% | |
Bud Norris is all sorts of hittable, and he has thrown just 21 and 31 pitches in two outings since his September arrival in Los Angeles. He is the worst pitcher in these two early games and is not on the fantasy radar against the Astros.
Quick Breakdown: Norris can safely be avoided in all formats.
| Charlie Morton | |||||||||
 | FanDuel | DraftKings | FantasyDraft | ||||||
| Salary: | $9,200 | Salary: | $8,700 | Salary: | $16,800 | ||||
| Salary Rank: | 5 of 30 | Salary Rank: | 10 of 30 | Salary Rank: | 4 of 30 | ||||
| Stats | Starts | SIERA | ERA | K% | BB% | GB% | HC% | SC% | |
|---|---|---|---|---|---|---|---|---|---|
| 2016 | 4 | 3.56 | 4.15 | 26.8% | 11.3% | 62.8% | 20.5% | 15.9% | |
| 2017 | 23 | 3.72 | 3.75 | 27.0% | 8.6% | 51.1% | 27.3% | 20.2% | |
| L30 | 4 | 2.92 | 3.43 | 32.6% | 6.7% | 57.7% | 15.4% | 19.2% | |
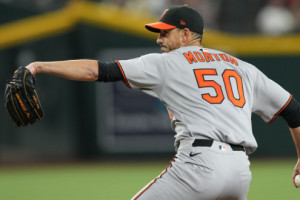
In terms of upside, you could make a case for Morton as the top pitching option in these two early games. His 27% strikeout rate and 11% swinging strike rate are the best that you will find on the slate, and his 3.72 SIERA and 3.57 xFIP are more than respectable. His occasional lapses in focus and command are the biggest negatives, and the Angels offense is certainly no pushover at this point. However, Morton is definitely in play for cash games and tournaments, and he is almost a must roster on DraftKings in the two pitcher format.
Quick Breakdown: Morton has the most upside on this short two game slate and is in play for all DFS formats.
Batter Grind Down
LA Angels
Projected Lineup (Splits vs. RH Pitching)
| # | Player | Bats | wOBA | xwOBA | ISO | HC% | BB% | K% | GB% | FD Pos. | FD Sal. | DK Pos. | DK Sal. | FDRFT Pos. | FDRFT Sal. |
|---|---|---|---|---|---|---|---|---|---|---|---|---|---|---|---|
| 1 | Brandon Phillips | RIGHT | 0.320 | 0.301 | 0.138 | 25.1% | 3.1% | 11.8% | 50.7% | 2B | $3,300 | 2B/3B | $3,500 | 2B | $6,900 |
| 2 | Mike Trout | RIGHT | 0.455 | 0.433 | 0.356 | 39.4% | 17.8% | 18.3% | 33.8% | OF | $4,700 | OF | $5,400 | CF | $10,500 |
| 3 | Justin Upton | RIGHT | 0.354 | 0.344 | 0.227 | 41.0% | 11.9% | 29.9% | 34.7% | OF | $3,800 | OF | $4,100 | LF | $8,100 |
| 4 | Albert Pujols | RIGHT | 0.293 | 0.332 | 0.170 | 36.9% | 5.1% | 14.4% | 42.4% | 1B | $3,000 | 1B | $3,300 | 1B | $6,400 |
| 5 | Kole Calhoun | LEFT | 0.320 | 0.329 | 0.148 | 32.4% | 10.8% | 21.5% | 42.5% | OF | $3,300 | OF | $3,400 | RF | $6,600 |
| 6 | Andrelton Simmons | RIGHT | 0.330 | 0.304 | 0.155 | 30.4% | 5.2% | 10.0% | 48.7% | SS | $2,700 | SS | $3,600 | SS | $7,200 |
| 7 | Luis Valbuena | LEFT | 0.317 | 0.309 | 0.246 | 34.9% | 11.4% | 27.2% | 34.5% | 3B | $2,900 | 1B/3B | $2,900 | 3B | $5,600 |
| 8 | C.J. Cron | RIGHT | 0.331 | 0.349 | 0.183 | 35.9% | 6.5% | 23.8% | 31.1% | 1B | $3,800 | 1B | $3,300 | 1B | $6,600 |
| 9 | Martin Maldonado | RIGHT | 0.280 | 0.281 | 0.170 | 28.1% | 2.1% | 25.4% | 48.1% | C | $2,000 | C | $2,500 | C | $4,800 |
I don’t generally pick on Charlie Morton a lot, and the Angels are not a team that I am super interested in this afternoon. I understand that it may be necessary to take a piece from this team on the two game slate, and I would stick to the top of the order if you do that. Morton has shown strong reverse splits this year and has allowed a .354 wOBA to RHBs. While a lot of that is BABIP-luck driven, that’s at least good news for a RH-heavy Angels lineup. The patient hitters in the middle of the order are the strongest options.
Elite Plays – Mike Trout, Justin Upton
Secondary Plays – Albert Pujols, Brandon Phillips
Stackability – YELLOW / ORANGE
Houston
Projected Lineup (Splits vs. RH Pitching)
| # | Player | Bats | wOBA | xwOBA | ISO | HC% | BB% | K% | GB% | FD Pos. | FD Sal. | DK Pos. | DK Sal. | FDRFT Pos. | FDRFT Sal. |
|---|---|---|---|---|---|---|---|---|---|---|---|---|---|---|---|
| 1 | George Springer | RIGHT | 0.364 | 0.361 | 0.232 | 37.7% | 8.8% | 19.9% | 49.4% | OF | $3,300 | OF | $5,100 | RF | $9,900 |
| 2 | Josh Reddick | LEFT | 0.363 | 0.334 | 0.188 | 33.0% | 8.3% | 11.9% | 33.3% | OF | $3,600 | OF | $4,400 | RF | $8,400 |
| 3 | Jose Altuve | RIGHT | 0.410 | 0.358 | 0.209 | 29.3% | 8.9% | 12.8% | 45.4% | 2B | $4,100 | 2B | $5,400 | 2B | $10,400 |
| 4 | Carlos Correa | RIGHT | 0.356 | 0.374 | 0.215 | 37.6% | 10.9% | 20.9% | 47.3% | SS | $3,200 | SS | $4,400 | SS | $8,700 |
| 5 | Marwin Gonzalez | SWITCH | 0.387 | 0.331 | 0.226 | 34.8% | 9.3% | 20.3% | 43.5% | OF | $3,000 | OF/SS | $4,500 | IF/OF | $8,800 |
| 6 | Alex Bregman | RIGHT | 0.328 | 0.329 | 0.171 | 32.5% | 8.3% | 16.4% | 40.9% | 3B | $3,400 | 3B/SS | $3,900 | 3B | $7,600 |
| 7 | Carlos Beltran | SWITCH | 0.305 | 0.300 | 0.180 | 32.6% | 7.1% | 18.0% | 42.5% | OF | $2,000 | OF | $3,200 | IF/OF | $6,300 |
| 8 | Yuli Gurriel | RIGHT | 0.358 | 0.332 | 0.197 | 33.3% | 2.6% | 9.5% | 44.8% | 1B | $3,400 | 1B | $3,600 | 1B | $7,200 |
| 9 | Brian McCann | LEFT | 0.311 | 0.326 | 0.171 | 33.7% | 9.5% | 14.5% | 39.4% | C | $2,800 | C | $3,400 | C | $6,600 |
This is essentially a bullpen game for the Angels, and Bud Norris isn’t any great shakes himself. Houston is my favorite offense from these two early games, and it is not particularly close. They also have the highest team total at 5.3 runs. Fire ‘em up.
Elite Plays – George Springer, Jose Altuve, Marwin Gonzalez, Josh Reddick
Secondary Plays – Carlos Correa, Yuli Gurriel, Brian McCann, Alex Bregman
Stackability – GREEN
NY Yankees at Toronto – 4:07 PM ET
| NY Yankees | Toronto | ||||||||||||||
 | Sonny Gray |  | Joe Biagini | ||||||||||||
| RIGHT | RIGHT | ||||||||||||||
| Vegas Moneyline | Vegas Over/Under | ||||||||||||||
| NYY-157 | 9.0 | ||||||||||||||
| Stats | wOBA | xwOBA | HC% | BB% | K% | GB% | Stats | wOBA | xwOBA | HC% | BB% | K% | GB% | ||
|---|---|---|---|---|---|---|---|---|---|---|---|---|---|---|---|
| SP vs. Left (2016-17) | 0.264 | 0.285 | 26.4% | 7.9% | 23.0% | 54.1% | SP vs. Left (2016-17) | 0.342 | 0.287 | 33.6% | 7.7% | 22.1% | 53.0% | ||
| SP vs. Right (2016-17) | 0.302 | 0.310 | 30.6% | 7.7% | 23.7% | 54.8% | SP vs. Right (2016-17) | 0.310 | 0.299 | 28.1% | 7.8% | 17.0% | 58.0% | ||
Pitcher Grind Down
| Sonny Gray | |||||||||
 | FanDuel | DraftKings | FantasyDraft | ||||||
| Salary: | $8,700 | Salary: | $11,000 | Salary: | $21,300 | ||||
| Salary Rank: | 6 of 30 | Salary Rank: | 4 of 30 | Salary Rank: | 2 of 30 | ||||
| Stats | Starts | SIERA | ERA | K% | BB% | GB% | HC% | SC% | |
|---|---|---|---|---|---|---|---|---|---|
| 2016 | 22 | 4.32 | 5.69 | 18.2% | 8.1% | 53.9% | 33.6% | 16.1% | |
| 2017 | 25 | 3.88 | 3.38 | 23.4% | 7.8% | 54.5% | 28.6% | 16.3% | |
| L30 | 5 | 3.44 | 3.41 | 27.7% | 6.2% | 51.2% | 28.6% | 10.7% | |
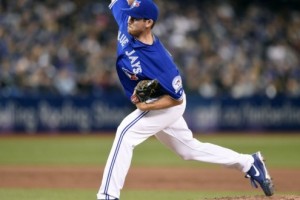
The “official” four game early slate begins here, and the Yankees will look to maintain their hopes of an AL East title with a rebound performance after a bad loss on Friday in Toronto. Sonny Gray has been a bit shaky of late, as two of his four September outings have been poor. He still has respectable overall numbers since joining the Yankees, and a matchup against the Blue Jays isn’t necessarily bad for a pitcher these days. Gray has a reasonable, if not great, strikeout profile, and he is generally never a “must roster.” I like him a good bit today, but his DK price tag is outrageously high.
Quick Breakdown: Gray is my second favorite pitcher on the afternoon slate, but his price tag is a little hot for my liking on DraftKings. He’s a better play on FanDuel, though he is still behind Carlos Carrasco in terms of my interest level.
| Joe Biagini | |||||||||
 | FanDuel | DraftKings | FantasyDraft | ||||||
| Salary: | $5,500 | Salary: | $5,600 | Salary: | $11,200 | ||||
| Salary Rank: | 27 of 30 | Salary Rank: | 24 of 30 | Salary Rank: | 8 of 30 | ||||
| Stats | Starts | SIERA | ERA | K% | BB% | GB% | HC% | SC% | |
|---|---|---|---|---|---|---|---|---|---|
| 2016 | 0 | 3.45 | 3.06 | 21.0% | 6.4% | 52.2% | 23.0% | 17.7% | |
| 2017 | 16 | 4.18 | 5.33 | 19.1% | 7.8% | 56.0% | 30.3% | 19.3% | |
| L30 | 5 | 4.58 | 6.17 | 16.5% | 7.3% | 53.7% | 27.7% | 21.7% | |
Biagini may have a decent future in the major leagues, but he is nowhere near there yet. He did not make it out of the second inning in his last start, and his ERA for the year has ballooned all the way to 5.33. He is not a fantasy option against a Yankees offense that has been much better in September.
Quick Breakdown: Biagini can safely be avoided in all formats.
Batter Grind Down
NY Yankees
Projected Lineup (Splits vs. RH Pitching)
| # | Player | Bats | wOBA | xwOBA | ISO | HC% | BB% | K% | GB% | FD Pos. | FD Sal. | DK Pos. | DK Sal. | FDRFT Pos. | FDRFT Sal. |
|---|---|---|---|---|---|---|---|---|---|---|---|---|---|---|---|
| 1 | Brett Gardner | LEFT | 0.360 | 0.330 | 0.188 | 32.2% | 10.8% | 18.4% | 41.1% | OF | $4,100 | OF | $4,100 | LF | $8,000 |
| 2 | Aaron Judge | RIGHT | 0.420 | 0.427 | 0.326 | 43.1% | 16.2% | 31.4% | 35.6% | OF | $4,600 | OF | $5,700 | RF | $11,200 |
| 3 | Gary Sanchez | RIGHT | 0.372 | 0.371 | 0.253 | 35.2% | 6.7% | 23.3% | 43.9% | C | $3,600 | C | $5,300 | C | $10,200 |
| 4 | Didi Gregorius | LEFT | 0.366 | 0.289 | 0.246 | 25.9% | 4.9% | 11.9% | 37.7% | SS | $3,700 | SS | $4,000 | SS | $7,600 |
| 5 | Chase Headley | SWITCH | 0.347 | 0.323 | 0.133 | 32.3% | 12.2% | 23.7% | 43.1% | 1B | $3,800 | 1B/3B | $3,600 | 3B | $7,200 |
| 6 | Starlin Castro | RIGHT | 0.327 | 0.294 | 0.158 | 29.0% | 3.3% | 20.1% | 49.6% | 2B | $2,900 | 2B | $3,900 | 2B | $7,600 |
| 7 | Matt Holliday | RIGHT | 0.306 | 0.328 | 0.193 | 30.6% | 9.9% | 26.3% | 48.0% | OF | $3,000 | 1B | $3,700 | IF/OF | $7,200 |
| 8 | Todd Frazier | RIGHT | 0.325 | 0.342 | 0.179 | 29.8% | 14.5% | 22.2% | 37.7% | 3B | $3,700 | 3B | $3,700 | 3B | $7,200 |
| 9 | Greg Bird | LEFT | 0.255 | 0.307 | 0.141 | 34.3% | 12.2% | 27.8% | 30.3% | 1B | $2,800 | 1B | $3,200 | 1B | $6,400 |
Biagini gets a solid amount of ground balls, but he has had a slightly more difficult time retiring left-handed batters. LHBs have posted a .342 wOBA and nearly 34% hard contact rate against him this year, so that is the ideal spot to look for bats. Brett Gardner and Didi Gregorius are elite options here, and the rest of the lineup is certainly in play, along with a full stack. Biagini is unlikely to pitch deep into this game in any circumstance as the Jays look to limit his innings.
Elite Plays – Brett Gardner, Didi Gregorius, Gary Sanchez
Secondary Plays – Aaron Judge, Chase Headley
Stackability – YELLOW / GREEN
Toronto
Projected Lineup (Splits vs. RH Pitching)
| # | Player | Bats | wOBA | xwOBA | ISO | HC% | BB% | K% | GB% | FD Pos. | FD Sal. | DK Pos. | DK Sal. | FDRFT Pos. | FDRFT Sal. |
|---|---|---|---|---|---|---|---|---|---|---|---|---|---|---|---|
| 1 | Ezequiel Carrera | LEFT | 0.354 | 0.294 | 0.141 | 26.6% | 7.9% | 23.1% | 48.9% | OF | $2,000 | OF | $3,100 | RF | $6,000 |
| 2 | Josh Donaldson | RIGHT | 0.391 | 0.376 | 0.272 | 33.3% | 15.9% | 22.8% | 43.3% | 3B | $3,700 | 3B | $4,600 | 3B | $9,000 |
| 3 | Justin Smoak | SWITCH | 0.363 | 0.387 | 0.275 | 41.0% | 10.8% | 22.1% | 34.0% | 1B | $2,900 | 1B | $4,000 | 1B | $7,800 |
| 4 | Jose Bautista | RIGHT | 0.305 | 0.322 | 0.176 | 35.3% | 12.7% | 23.9% | 35.6% | OF | $2,900 | OF | $3,500 | RF | $6,800 |
| 5 | Kendrys Morales | SWITCH | 0.293 | 0.356 | 0.191 | 38.0% | 7.1% | 21.9% | 46.2% | 1B | $3,000 | 1B | $3,200 | 1B | $6,400 |
| 6 | Kevin Pillar | RIGHT | 0.278 | 0.291 | 0.129 | 25.9% | 5.0% | 15.7% | 44.4% | OF | $2,800 | OF | $3,000 | CF | $6,000 |
| 7 | Russell Martin | RIGHT | 0.335 | 0.340 | 0.166 | 29.2% | 14.0% | 21.3% | 52.0% | C | $2,500 | C | $3,000 | C | $6,000 |
| 8 | Ryan Goins | LEFT | 0.270 | 0.274 | 0.119 | 30.2% | 6.9% | 18.6% | 46.7% | SS | $2,200 | 2B/SS | $2,500 | 2B | $4,800 |
| 9 | Darwin Barney | RIGHT | 0.254 | 0.248 | 0.120 | 21.6% | 1.4% | 15.5% | 48.5% | 2B | $2,800 | 2B/3B | $3,000 | 2B | $6,000 |
There isn’t much to love for the Blue Jays offense these days, and they don’t have the greatest of matchups here against Sonny Gray, who has held both RHBs and LHBs to a sub-.305 wOBA this season. RHBs actually have a slightly better batted ball profile, so perhaps you can play the reverse splits angle with a power hitter like Josh Donaldson. That’s not the best of sales pitches, but I won’t have much exposure to this offense.
Elite Plays – None
Secondary Plays – Josh Donaldson, Russell Martin
Stackability – ORANGE
Boston at Cincinnati – 4:10 PM ET
| Boston | Cincinnati | ||||||||||||||
 | Eduardo Rodriguez |  | Robert Stephenson | ||||||||||||
| LEFT | RIGHT | ||||||||||||||
| Vegas Moneyline | Vegas Over/Under | ||||||||||||||
| BOS-128 | 9.5 | ||||||||||||||
| Stats | wOBA | xwOBA | HC% | BB% | K% | GB% | Stats | wOBA | xwOBA | HC% | BB% | K% | GB% | ||
|---|---|---|---|---|---|---|---|---|---|---|---|---|---|---|---|
| SP vs. Left (2016-17) | 0.363 | 0.342 | 33.9% | 8.6% | 26.7% | 29.2% | SP vs. Left (2016-17) | 0.362 | 0.349 | 43.4% | 18.2% | 23.5% | 37.3% | ||
| SP vs. Right (2016-17) | 0.303 | 0.298 | 30.5% | 8.5% | 26.0% | 36.0% | SP vs. Right (2016-17) | 0.348 | 0.338 | 34.4% | 12.2% | 24.9% | 36.9% | ||
Pitcher Grind Down
| Eduardo Rodriguez | |||||||||
 | FanDuel | DraftKings | FantasyDraft | ||||||
| Salary: | $8,300 | Salary: | $8,600 | Salary: | $16,800 | ||||
| Salary Rank: | 9 of 30 | Salary Rank: | 11 of 30 | Salary Rank: | 4 of 30 | ||||
| Stats | Starts | SIERA | ERA | K% | BB% | GB% | HC% | SC% | |
|---|---|---|---|---|---|---|---|---|---|
| 2016 | 20 | 4.44 | 4.71 | 21.8% | 8.7% | 31.6% | 27.6% | 22.2% | |
| 2017 | 22 | 4.00 | 4.15 | 26.2% | 8.5% | 34.8% | 31.1% | 18.6% | |
| L30 | 5 | 3.68 | 4.60 | 27.3% | 7.0% | 37.8% | 31.7% | 20.7% | |
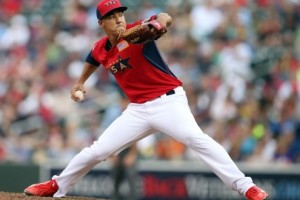
If you have read my stuff on RotoGrinders at all this year, you probably know by now that I am a sucker for Eduardo Rodriguez. I can’t quit his constantly cheap price tag to go along with his solid overall profile, which includes a 26% strikeout rate and 12% swinging strike rate. Today’s matchup isn’t the greatest on the road in a hitter-friendly park against a sneaky good Cincinnati lineup, and it’s tough to endorse Rodriguez in single pitcher formats. However, he’s a fine complementary piece on multi-pitcher sites like FantasyDraft or DraftKings, and I like him as a second pitching choice on those sites.
Quick Breakdown: Rodriguez carries some risk against the Reds, but he is a solid SP #2 choice with upside. The tournament appeal is certainly there, and you could even make a case for him in cash games on a short slate.
| Robert Stephenson | |||||||||
 | FanDuel | DraftKings | FantasyDraft | ||||||
| Salary: | $7,700 | Salary: | $6,400 | Salary: | $12,600 | ||||
| Salary Rank: | 15 of 30 | Salary Rank: | 19 of 30 | Salary Rank: | 6 of 30 | ||||
| Stats | Starts | SIERA | ERA | K% | BB% | GB% | HC% | SC% | |
|---|---|---|---|---|---|---|---|---|---|
| 2016 | 8 | 5.12 | 6.08 | 18.2% | 11.2% | 34.5% | 37.9% | 17.2% | |
| 2017 | 9 | 4.86 | 5.01 | 24.3% | 14.5% | 37.1% | 37.8% | 12.8% | |
| L30 | 5 | 4.20 | 3.04 | 33.3% | 15.8% | 30.4% | 32.8% | 10.3% | |
Robert Stephenson has similar strikeout upside to that of the aforementioned Rodriguez, but he also has a 14.5% walk rate, has allowed hard contact almost 38% of the time, and has a generally ugly profile other than the strikeouts. That strikeout upside is also limited against a pesky Red Sox offense that doesn’t strike out a ton. Pass.
Quick Breakdown: If you are looking for upside potential in this game, you want the pitcher on the other side. There are too many red flags with Stephenson.
Batter Grind Down
Boston
Projected Lineup (Splits vs. RH Pitching)
| # | Player | Bats | wOBA | xwOBA | ISO | HC% | BB% | K% | GB% | FD Pos. | FD Sal. | DK Pos. | DK Sal. | FDRFT Pos. | FDRFT Sal. |
|---|---|---|---|---|---|---|---|---|---|---|---|---|---|---|---|
| 1 | Xander Bogaerts | RIGHT | 0.312 | 0.273 | 0.130 | 30.7% | 8.2% | 18.7% | 47.1% | SS | $3,300 | SS | $4,400 | SS | $8,400 |
| 2 | Dustin Pedroia | RIGHT | 0.327 | 0.311 | 0.098 | 25.3% | 9.0% | 10.6% | 48.5% | 2B | $3,200 | 2B | $3,600 | 2B | $7,200 |
| 3 | Andrew Benintendi | LEFT | 0.350 | 0.343 | 0.181 | 37.1% | 9.6% | 16.8% | 36.9% | OF | $4,200 | OF | $4,800 | LF | $9,200 |
| 4 | Mookie Betts | RIGHT | 0.326 | 0.331 | 0.187 | 35.4% | 9.5% | 11.7% | 39.6% | OF | $4,500 | OF | $5,500 | RF | $10,800 |
| 5 | Mitch Moreland | LEFT | 0.326 | 0.377 | 0.201 | 39.7% | 9.7% | 20.6% | 41.1% | 1B | $2,800 | 1B | $3,700 | 1B | $7,200 |
| 6 | Christian Vazquez | RIGHT | 0.321 | 0.284 | 0.109 | 27.9% | 4.9% | 19.3% | 46.2% | C | $2,600 | C | $3,400 | C | $6,600 |
| 7 | Rafael Devers | LEFT | 0.302 | 0.285 | 0.170 | 33.3% | 7.2% | 21.7% | 51.4% | 3B | $3,300 | 3B | $3,700 | 3B | $7,200 |
| 8 | Jackie Bradley Jr. | LEFT | 0.315 | 0.322 | 0.177 | 37.0% | 8.3% | 24.0% | 43.1% | OF | $3,500 | OF | $3,500 | CF | $6,800 |
| 9 | Eduardo Rodriguez | LEFT | 0.000 | 0.000 | 0.0% | 0.0% | 50.0% | 100.0% | P | $8,300 | P | $8,600 | P | $16,800 |
The Red Sox continue to play well and they are likely going to win the AL East, but this is definitely a case of an offense where the sum of the parts is better than the individual pieces. Their offensive numbers are still lagging this year, with the primary draw being their high walks and low strikeouts, though the walks have dipped in the second half. Still, a stack holds some appeal against a pitcher with a massive walk rate and a lot of hard contact problems. Both RHBs and LHBs have posted a .345+ wOBA against Stephenson this year, so the entire lineup is in play. Boston does get a bit of a downgrade without a designated hitter, but they still have a solid 5.1 run team total.
Elite Plays – Mookie Betts, Andrew Benintendi, Mitch Moreland (assuming he starts at 1B)
Secondary Plays – Dustin Pedroia, Rafael Devers, Xander Bogaerts
Stackability – GREEN / YELLOW
Cincinnati
Projected Lineup (Splits vs. LH Pitching)
| # | Player | Bats | wOBA | xwOBA | ISO | HC% | BB% | K% | GB% | FD Pos. | FD Sal. | DK Pos. | DK Sal. | FDRFT Pos. | FDRFT Sal. |
|---|---|---|---|---|---|---|---|---|---|---|---|---|---|---|---|
| 1 | Billy Hamilton | SWITCH | 0.237 | 0.215 | 0.082 | 15.8% | 3.1% | 23.3% | 47.0% | OF | $3,100 | OF | $3,700 | CF | $7,200 |
| 2 | Zack Cozart | RIGHT | 0.454 | 0.375 | 0.295 | 36.8% | 13.3% | 12.4% | 35.5% | SS | $3,600 | SS | $4,200 | SS | $8,000 |
| 3 | Joey Votto | LEFT | 0.421 | 0.409 | 0.271 | 32.5% | 19.0% | 15.1% | 44.7% | 1B | $4,000 | 1B | $5,100 | 1B | $10,000 |
| 4 | Eugenio Suarez | RIGHT | 0.395 | 0.368 | 0.252 | 45.1% | 15.7% | 24.3% | 41.5% | 3B | $3,900 | 3B | $3,900 | 3B | $7,600 |
| 5 | Scooter Gennett | LEFT | 0.305 | 0.249 | 0.181 | 25.8% | 5.0% | 28.0% | 47.7% | 2B | $3,200 | 2B | $3,800 | 2B | $7,500 |
| 6 | Adam Duvall | RIGHT | 0.378 | 0.354 | 0.298 | 33.7% | 7.5% | 21.8% | 42.6% | OF | $2,300 | OF | $3,800 | IF/OF | $7,500 |
| 7 | Scott Schebler | LEFT | 0.334 | 0.312 | 0.236 | 38.5% | 0.8% | 22.0% | 49.0% | OF | $3,100 | OF | $4,000 | RF | $7,800 |
| 8 | Tucker Barnhart | SWITCH | 0.273 | 0.303 | 0.113 | 26.0% | 11.1% | 18.1% | 58.3% | C | $2,800 | C | $2,800 | C | $5,400 |
| 9 | Robert Stephenson | RIGHT | 0.000 | 0.000 | 0.0% | 0.0% | 60.0% | 100.0% | P | $7,700 | P | $6,400 | P | $12,600 |
I generally don’t pick on Eduardo Rodriguez, and this slate is just large enough to where I feel comfortable avoiding bats against him. He has shown reverse splits this year and has far worse numbers against LHBs, but almost all of that is due to a ridiculously unsustainable .387 BABIP. Don’t fall into the trap of playing Joey Votto simply because of Rodriguez’ splits against lefties. He is a secondary play, but you can definitely avoid this whole unit today.
Elite Plays – None
Secondary Plays – Zack Cozart, Joey Votto
Stackability – ORANGE / YELLOW
Cleveland at Seattle – 4:10 PM ET
| Cleveland | Seattle | ||||||||||||||
 | Carlos Carrasco |  | Andrew Moore | ||||||||||||
| RIGHT | RIGHT | ||||||||||||||
| Vegas Moneyline | Vegas Over/Under | ||||||||||||||
| CLE-170 | 8.5 | ||||||||||||||
| Stats | wOBA | xwOBA | HC% | BB% | K% | GB% | Stats | wOBA | xwOBA | HC% | BB% | K% | GB% | ||
|---|---|---|---|---|---|---|---|---|---|---|---|---|---|---|---|
| SP vs. Left (2016-17) | 0.316 | 0.313 | 33.3% | 6.4% | 26.8% | 43.2% | SP vs. Left (2016-17) | 0.336 | 0.364 | 26.5% | 3.1% | 11.3% | 19.3% | ||
| SP vs. Right (2016-17) | 0.273 | 0.278 | 26.1% | 5.3% | 28.4% | 45.5% | SP vs. Right (2016-17) | 0.314 | 0.345 | 36.8% | 3.9% | 13.2% | 35.2% | ||
Pitcher Grind Down
| Carlos Carrasco | |||||||||
 | FanDuel | DraftKings | FantasyDraft | ||||||
| Salary: | $10,200 | Salary: | $12,800 | Salary: | $24,800 | ||||
| Salary Rank: | 3 of 30 | Salary Rank: | 2 of 30 | Salary Rank: | 1 of 30 | ||||
| Stats | Starts | SIERA | ERA | K% | BB% | GB% | HC% | SC% | |
|---|---|---|---|---|---|---|---|---|---|
| 2016 | 25 | 3.44 | 3.32 | 25.0% | 5.7% | 48.5% | 36.4% | 16.0% | |
| 2017 | 30 | 3.42 | 3.48 | 27.7% | 5.8% | 44.5% | 29.3% | 19.8% | |
| L30 | 5 | 2.89 | 1.51 | 28.9% | 2.2% | 45.7% | 16.3% | 31.5% | |
Carrasco checks in as your top pitching option on the afternoon slate. While he has a couple of duds in his profile over the last few months, six of his last eight starts have been absolutely dynamic. In those six outings, he has allowed zero runs or one run every time, and he has logged at least eight strikeouts with two or fewer walks in all of them. The matchup is not a scary one in a decent park against an average Mariners lineup, and Carrasco has more upside than any other pitcher this afternoon. He is a lock and load play in all formats, and his overall 3.42 SIERA and 27.7% strikeout rate are the best that you will find on the slate.
Quick Breakdown: Find a way to get Carrasco into your lineups and lock him in as the top pitcher of the afternoon.
| Andrew Moore | |||||||||
 | FanDuel | DraftKings | FantasyDraft | ||||||
| Salary: | $5,600 | Salary: | $5,200 | Salary: | $10,400 | ||||
| Salary Rank: | 26 of 30 | Salary Rank: | 27 of 30 | Salary Rank: | 9 of 30 | ||||
| Stats | Starts | SIERA | ERA | K% | BB% | GB% | HC% | SC% | |
|---|---|---|---|---|---|---|---|---|---|
| 2017 | 8 | 5.48 | 5.40 | 12.4% | 3.5% | 28.2% | 32.3% | 14.8% | |
| L30 | 2 | 4.73 | 3.24 | 17.2% | 4.7% | 32.0% | 24.0% | 20.0% | |
Moore is the worst pitcher of the afternoon, and there is nothing to like about anything in his profile. His 5.48 SIERA, 5.68 xFIP, and 12% strikeout rate should be enough to convince you to run far away. If that’s not enough, a matchup against an Indians team that has lost a whole two games in the past month should be enough to do the trick.
Quick Breakdown: Moore can safely be avoided in all formats.
Batter Grind Down
Cleveland
Projected Lineup (Splits vs. RH Pitching)
| # | Player | Bats | wOBA | xwOBA | ISO | HC% | BB% | K% | GB% | FD Pos. | FD Sal. | DK Pos. | DK Sal. | FDRFT Pos. | FDRFT Sal. |
|---|---|---|---|---|---|---|---|---|---|---|---|---|---|---|---|
| 1 | Francisco Lindor | SWITCH | 0.345 | 0.346 | 0.239 | 32.1% | 8.4% | 12.9% | 40.3% | SS | $4,600 | SS | $5,600 | SS | $10,800 |
| 2 | Austin Jackson | RIGHT | 0.322 | 0.304 | 0.126 | 36.2% | 7.9% | 22.5% | 45.2% | OF | $3,800 | OF | $3,800 | CF | $7,500 |
| 3 | Jose Ramirez | SWITCH | 0.398 | 0.355 | 0.272 | 33.6% | 8.4% | 10.7% | 38.6% | 2B | $4,200 | 2B/3B | $5,000 | IF/OF | $9,900 |
| 4 | Edwin Encarnacion | RIGHT | 0.376 | 0.388 | 0.265 | 37.5% | 13.9% | 19.4% | 34.6% | 1B | $4,400 | 1B | $4,900 | 1B | $9,600 |
| 5 | Jay Bruce | LEFT | 0.372 | 0.374 | 0.279 | 42.8% | 9.8% | 20.8% | 32.9% | OF | $3,400 | OF | $4,300 | RF | $8,400 |
| 6 | Carlos Santana | SWITCH | 0.375 | 0.390 | 0.225 | 37.5% | 14.0% | 17.8% | 32.2% | 1B | $3,600 | 1B | $4,600 | 1B | $8,800 |
| 7 | Jason Kipnis | LEFT | 0.306 | 0.306 | 0.193 | 32.5% | 6.8% | 20.1% | 30.8% | 2B | $2,900 | 2B | $3,400 | 2B | $6,600 |
| 8 | Yandy Diaz | RIGHT | 0.282 | 0.319 | 0.054 | 33.8% | 7.8% | 19.4% | 60.8% | 3B | $2,500 | 3B | $2,800 | 3B | $5,600 |
| 9 | Yan Gomes | RIGHT | 0.267 | 0.257 | 0.101 | 23.5% | 7.5% | 26.2% | 39.4% | C | $2,700 | C | $2,700 | C | $5,400 |
As has been the case often in the month of September, the Indians check in as an elite offense to target. Andrew Moore doesn’t miss any bats, and the Indians will make contact here. Moore is a fly ball pitcher who has just a 19% ground ball rate against LHBs and a 35% ground ball rate against RHBs. While lefties have posted the higher wOBA, righties have made more hard contact. I’ll consider Moore splits neutral for now, and all the power hitters for Cleveland are in play here. I will likely stick to a few power hitters as opposed to opting for the full stack, but that doesn’t mean that a stack is not in play.
Elite Plays – Edwin Encarnacion, Francisco Lindor, Jose Ramirez
Secondary Plays – Jay Bruce, Yan Gomes, Carlos Santana
Stackability – YELLOW / GREEN
Seattle
Projected Lineup (Splits vs. RH Pitching)
| # | Player | Bats | wOBA | xwOBA | ISO | HC% | BB% | K% | GB% | FD Pos. | FD Sal. | DK Pos. | DK Sal. | FDRFT Pos. | FDRFT Sal. |
|---|---|---|---|---|---|---|---|---|---|---|---|---|---|---|---|
| 1 | Jean Segura | RIGHT | 0.331 | 0.293 | 0.135 | 25.3% | 4.8% | 14.8% | 55.6% | SS | $3,800 | SS | $3,400 | SS | $6,800 |
| 2 | Mitch Haniger | RIGHT | 0.361 | 0.324 | 0.201 | 37.3% | 9.0% | 24.4% | 44.0% | OF | $3,300 | OF | $3,500 | LF | $6,900 |
| 3 | Robinson Cano | LEFT | 0.381 | 0.395 | 0.216 | 39.9% | 8.5% | 10.4% | 49.0% | 2B | $3,600 | 2B | $3,500 | 2B | $6,800 |
| 4 | Nelson Cruz | RIGHT | 0.393 | 0.387 | 0.277 | 39.3% | 7.8% | 21.5% | 40.3% | OF | $4,000 | OF | $3,600 | RF | $7,200 |
| 5 | Kyle Seager | LEFT | 0.328 | 0.368 | 0.197 | 37.9% | 9.3% | 15.4% | 30.3% | 3B | $3,300 | 3B | $3,400 | 3B | $6,800 |
| 6 | Yonder Alonso | LEFT | 0.373 | 0.376 | 0.224 | 35.4% | 14.4% | 22.5% | 33.1% | 1B | $2,400 | 1B | $3,100 | 1B | $6,000 |
| 7 | Mike Zunino | RIGHT | 0.341 | 0.306 | 0.235 | 38.1% | 8.5% | 38.5% | 34.4% | C | $2,700 | C | $2,800 | C | $5,400 |
| 8 | Ben Gamel | LEFT | 0.323 | 0.300 | 0.136 | 28.5% | 7.7% | 20.5% | 43.2% | OF | $2,900 | OF | $3,200 | RF | $6,300 |
| 9 | Guillermo Heredia | SWITCH | 0.266 | 0.265 | 0.072 | 16.3% | 6.5% | 15.1% | 48.5% | OF | $2,000 | OF | $2,500 | LF | $4,800 |
Targeting hitters against Carrasco feels like being way too cute. Even on a four game slate, it’s hard to pick on a guy with such a good overall profile. I will pass on this whole group.